FRAMA (Ehlers true modified calculation)Credit goes to Shizaru for the original calculation. I made just a few fixes, so that the calculation is really that of Ehlers. Fixed H2 and L2 period, fixed w natural logarithmمؤشر Pine Script®من nemoznyتم تحديثه 1010662
Ehlers Super Smoother by ShizaruJohn Ehlers’ “Super Smoother”, a 2-pole Butterworth filter combined with a 2-bar SMA that suppresses the Nyquist frequencyمؤشر Pine Script®من Shizaru407
Ehlers Universal Oscillator by ShizaruThe original script was posted on ProRealCode by user Nicolas. In “Whiter Is Brighter,” author John Ehlers presents a new indicator he calls the universal oscillator. It is based on his theory that market data resembles pink noise, or as he puts it, “noise with memory.” Main signal occurs when oscillator cross zero line. Second signal occurs when one column value is higher (lower) than previous column when we are above (below) zero line.مؤشر Pine Script®من Shizaru11188
Ehlers Ideal RSI v1.0 by JustUncleLCreated by Request: Description: This is an implementation of Dr. Ehlers Ideal RSI. It uses a Homodyne Discriminator to calculate the dominate cycle of the trend and then uses the half cycle as the length for the RSI calculation. Main Reference: - "http://www.jstas.com/RSI/RSI ideaal.htm" it's in Dutch, use Google translate مؤشر Pine Script®من JustUncleL1010469
Fractal Dimension Adaptive Moving Average (D-AMA)etfhq.com Overall the D-AMA produced results that were near identical to that of the FRAMA but the D-AMA is a slightly faster average. It is very difficult to pick between the FRAMA and the D-AMA but becuase the FRAMA offers a slightly longer trade duration it the best Moving Average we have tested so far.مؤشر Pine Script®من Shizaru22194
Fractal Adaptive Moving AverageSettings: FRAMA: blue line, SC = 252, FC = 40, length = 252 EMA: orange line, length = 50 FRAMA seems to be the evolution of the current and much-used EMA. The basic strategy is simple: long if the price crosses up the line, short or exit if vice versa. The main difference between EMA and FRAMA is that the first one seems to lag much more than the first one, as we can see from the chart below (crude oil daily chart) FYI etfhq.com quantstrattrader.wordpress.com مؤشر Pine Script®من Shizaru88438
Relative Vigour Index (RVI). EhlersRelative Vigor Index - RVI ------------------------------------ An indicator used in technical analysis that measures the conviction of a recent price action and the likelihood that it will continue. The RVI compares the positioning of a security's closing price relative to its price range, and the result is smoothed by calculating an exponential moving average of the values. The RVI indicator is calculated in a similar fashion to the stochastic oscillator, but the vigor index compares the close relative to the open rather than to the low. Traders expect the RVI value to grow as the bullish trend gains momentum because in this type of environment, a security's closing price tends to be at the top of the range while the open is near the low of the day. Usage Example: www.investopedia.com مؤشر Pine Script®من hecate22287
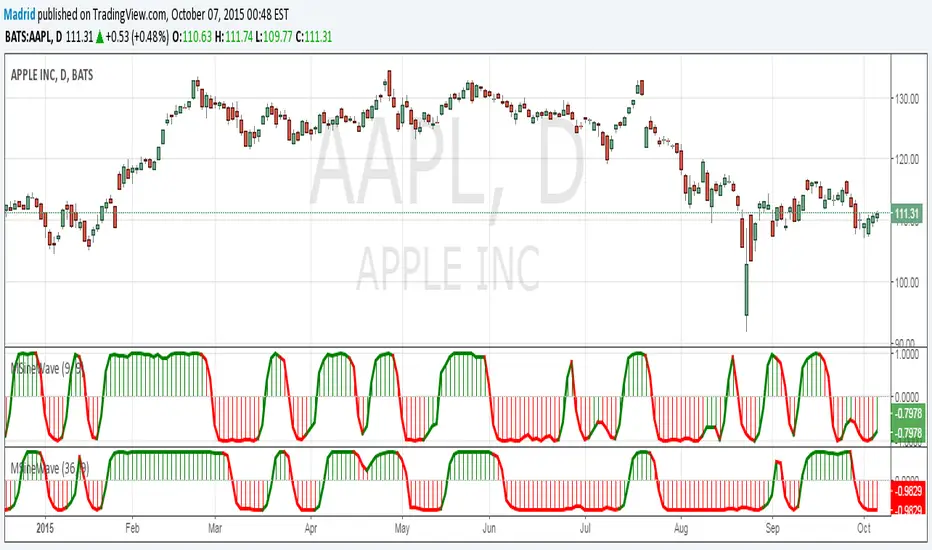
Madrid SinewaveThis implements the Even Better Sinewave indicator as described in the book Cycle Analysis for Traders by John F. Ehlers . In the example I used 36 as the cycle to be analyzed and a second cycle with a shorter period, 9, the larger period tells where the dominant cycle is heading, and the faster cycle signals entry/exit points and reversals.مؤشر Pine Script®من Madrid1010 1.6 K
Ehlers Smoothed Adaptive Momentum [LazyBear]Bored of Ehlers yet? :) I still have plenty of Ehlers in my collection, was thinking of publishing one of his Fishers or Adaptive RVI next, but @ChartArt requested Smoothed Adaptive Momentum (SAM), so here we go... This is my 200th script (not including the variations and other custom scripts I shared over PM). My complete list of indicators here - bit.ly Now, about the indicator :) This smoothed adaptive momentum is straightforward to use (per Ehlers original rules). If it crosses above zero buy the next open, if it crosses below zero sell the next open. Of course, I strongly suggest filtering the signals. Finally, here's an Ehlers-only chart to help determine where BTC is heading :P More info: - Ehlers CG Oscillator: - Cybernetic Analysis for Stocks and Futures (Ehlers) List of my public indicators: bit.ly List of my app-store indicators: blog.tradingview.com --Updated chart-- Here's the chart with barcolors ON (forgot to turn it on in the published one) مؤشر Pine Script®من LazyBear77 2.5 K
Ehlers Adaptive CG Indicator [LazyBear]Lets go with another adaptive indicator today. BTW, this is my 199th script (1 more and I am planning to work on my other backlogs). This is the adaptive version of Ehlers' Center Of Gravity (CG) (already published, check "More info" below). Idea behind making something "adaptive" is to calculate it using dynamic cycle period inputs instead of static setting. In adaptive CG, Ehlers uses the dominant cycle period as the length in computation of alpha. According to Ehlers this should be more responsive than the non-adaptive version. Buy and sell signals should often occur one bar earlier than for the non-adaptive version. I have the usual options in place. Check out plain CC for comparison. Here's a quick comparison between CG and Adaptive CG: More info: - Ehlers CG Oscillator: - Cybernetic Analysis for Stocks and Futures (Ehlers) List of my public indicators: bit.ly List of my app-store indicators: blog.tradingview.com مؤشر Pine Script®من LazyBear22 1.8 K
Ehlers Adaptive Cyber Cycle Indicator [LazyBear]Another famous Ehlers indicator. This is the adaptive version of Ehlers' Cyber Cycle (CC) (already published, check "More info" below). Idea behind making something "adaptive" is to calculate it using dynamic cycle period inputs instead of static setting. In adaptive cyber cycle, Ehlers uses the dominant cycle period as the length in computation of alpha. According to Ehlers this should be more responsive than the non-adaptive version. Buy and sell signals should often occur one bar earlier than for the non-adaptive version. I have the usual options in place. Check out plain CC for comparison. More info: - Cyber Cycle Indicator: - Cybernetic Analysis for Stocks and Futures (Ehlers) List of my public indicators: bit.ly List of my app-store indicators: blog.tradingview.com مؤشر Pine Script®من LazyBear1313 1.8 K
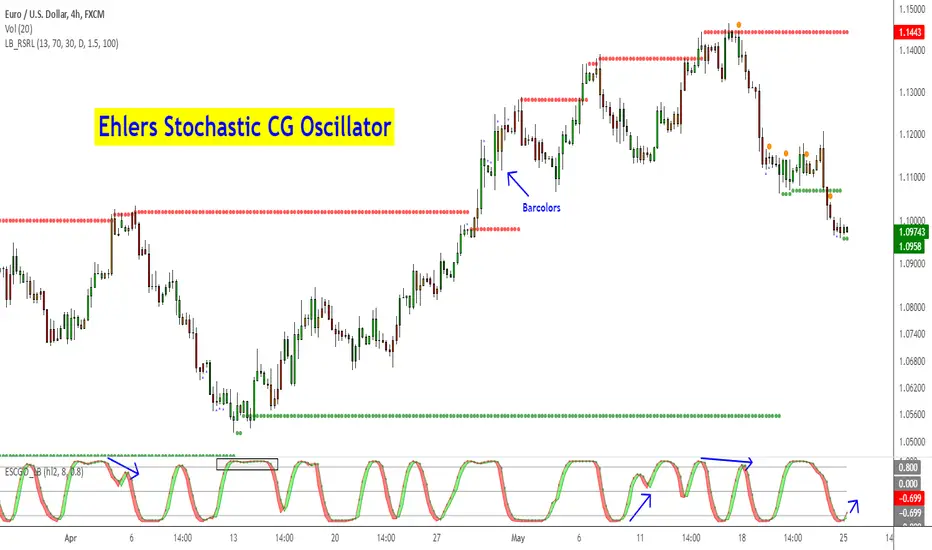
Ehlers Stochastic CG Oscillator [LazyBear]Another one from Ehlers. Ehlers likes the idea behind StochRSI so much, he dedicated a full chapter in his book (linked below) on how stoch works with his "superlative" (his words, not mine) indicators. This is stoch of his CG oscillator. Standard stochastic oscillator uses fixed period for calculations and does not adjust to the constantly changing market cycle length. Stochastic CG Oscillator does not have such a drawback. Use this like normal stochRSI osc (Uncheck "Fill Osc/Trigger" option, sample chart below) More info: - CG oscillator: - Cybernetic Analysis for Stocks and Futures (Ehlers) List of my public indicators: bit.ly List of my app-store indicators: blog.tradingview.com مؤشر Pine Script®من LazyBear88 5.1 K
Ehlers MESA Adaptive Moving Average [LazyBear]Another one to add to Ehlers collection. The MESA Adaptive Moving Average (MAMA) adapts to price movement based on the rate of change of phase as measured by the Hilbert Transform Discriminator. This method features a fast attack average and a slow decay average so that composite average rapidly ratchets behind price changes and holds the average value until the next ratchet occurs. Consider FAMA (Following AMA) as the signal. Here are some of the options: Fill MAMA/FAMA region (ribbon mode): Mark Crossovers: The above options (along with the bar colors) allow this to be used as a standalone system. BTW, John Ehlers calls MAMA, "Mother of all Adaptive Moving Averages", lemme know what you think :) More info: - MESA Adaptive Moving Average, Stocks and Commodities Magazine, August 2001 - MAMA: www.mesasoftware.com List of my public indicators: bit.ly List of my app-store indicators: blog.tradingview.com مؤشر Pine Script®من LazyBear4646 6.1 K
Ehlers Simple Cycle Indicator [LazyBear]One of the early cycle indicators from John Ehlers. Ehlers suggests using this with ITrend (see linked PDF below). Osc/signal crosses identify entry/exit points. Options page has the usual set of configurable params. More info: - Simple Cycle Indicator: www.mesasoftware.com List of my public indicators: bit.ly List of my app-store indicators: blog.tradingview.com مؤشر Pine Script®من LazyBear11 1.8 K
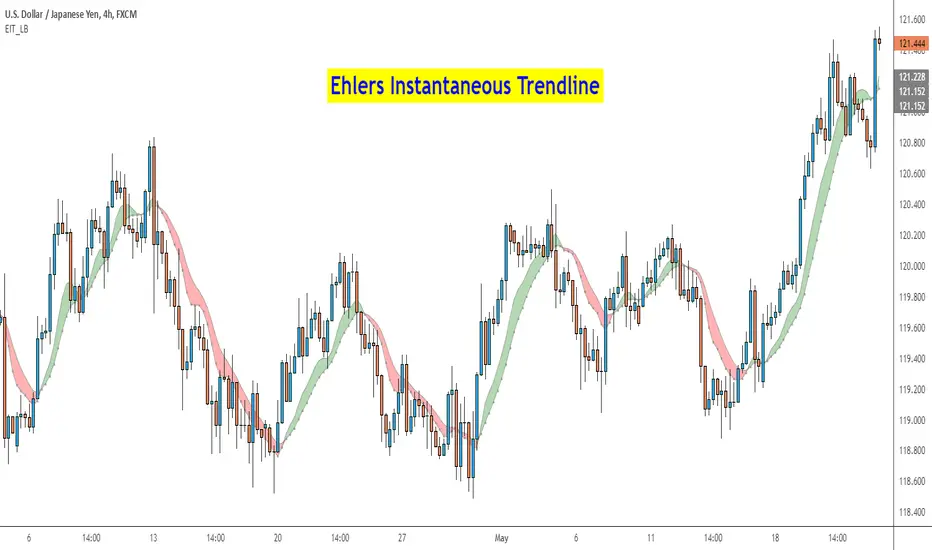
Ehlers Instantaneous Trend [LazyBear]One more to add to the Ehlers collection. Ehlers Instantaneous Trendline, by John Ehlers, identifies the market trend by doing removing cycle component. I think, this simplicity is what makes it attractive :) To understand Ehlers's thought process behind this, refer to the PDF linked below. There are atleast 6 variations of this ITrend. This version is from his early presentations. Is this better than a simple HMA? May be, May be not. I will leave it to you to decide :) I have added options to show this as a ribbon, and to color bars based on ITrend. Check out the options page. More info: - ITrend: www.mesasoftware.com List of my public indicators: bit.ly List of my app-store indicators: blog.tradingview.com مؤشر Pine Script®من LazyBear3636 8.9 K
Ehlers Center of Gravity Oscillator [LazyBear]As part of my "Ehler's Indicators week", here's one more. CG Oscillator, by John Ehlers, provides a smoothed, essentially zero lag oscillator for identifying market turning points. The "CG" in the name of the oscillator refers to "Center Of Gravity" of the prices over the window of observation. Entry/Exit are based on the osc/signal crossovers. Enabling the "Color bars" options helps in easily identifying crossovers. More info: - CG osc (pdf): www.mesasoftware.com - TASC Article: traders.com - Cybernetic Analysis for Stocks and Futures (Ehlers, 2004) List of my public indicators: bit.ly List of my app-store indicators: blog.tradingview.com مؤشر Pine Script®من LazyBear66 2.4 K
Ehlers Cyber Cycle Indicator [LazyBear]The Cyber Cycle Indicator, developed by John Ehlers, is used for isolating the cycle component of the market from its trend counterpart. Unlike other oscillators like RSI, Cyber Cycle Indicator's wave has a variable amplitude. Use the osc/signal crossover for entry/exit points. You can enable highlighting the crossovers by using region fills (via options page). I have also added an option to color the bars based on this. Actually I have lot of Ehlers indicators in my to-publish backlog, will try to prioritize them over the others in the pipeline. Lets have an Ehlers week for indicators :) More info: Cybernetic Analysis for Stocks and Futures List of my public indicators: bit.ly List of my app-store indicators: blog.tradingview.com مؤشر Pine Script®من LazyBear88 1.3 K
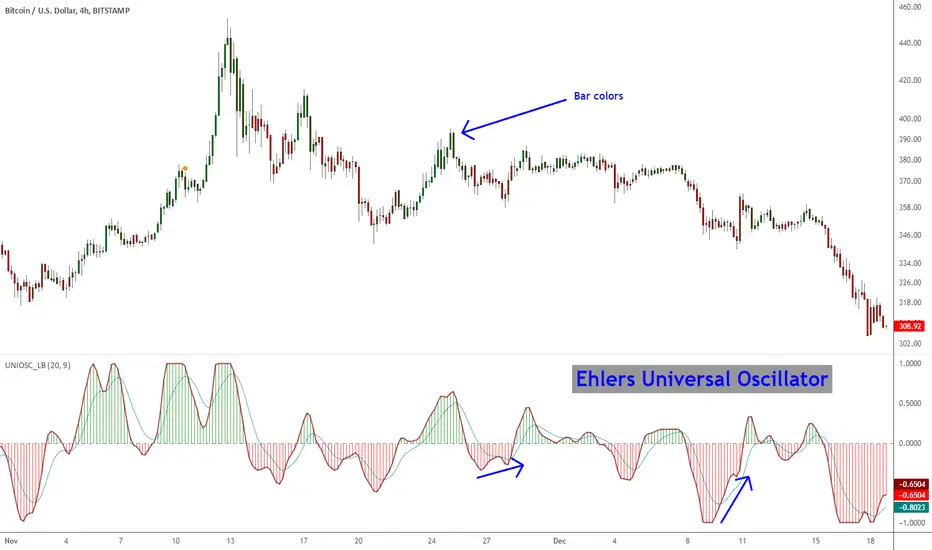
Ehlers Universal Oscillator [LazyBear]Universal Oscillator by Mr. Ehlers is an evolution of his SuperSmoother filter. The new indicator follows the swings in price without introducing extra delay. It is controlled through one single input – the band edge – which basically is frequency. The smaller it is set, the less lag there is, but you may see lot of whipsaws. Built-in automatic gain control normalizes the output to vary between the range of -1 to +1. Mr. Ehlers suggests a straightforward system: - Buy when long-term Universal Oscillator crosses above zero - Sell when long-term Universal Oscillator crosses below zero I have added options to draw a signal line, histogram and bar coloring. Bar coloring, if enabled, is done using the histogram color, but you can change it easily to signal_cross by uncommenting a line (check the source). More info: Whiter is Brighter - Ehlers List of my other indicators: - GDoc: docs.google.com - Chart: مؤشر Pine Script®من LazyBear3131 1.2 K
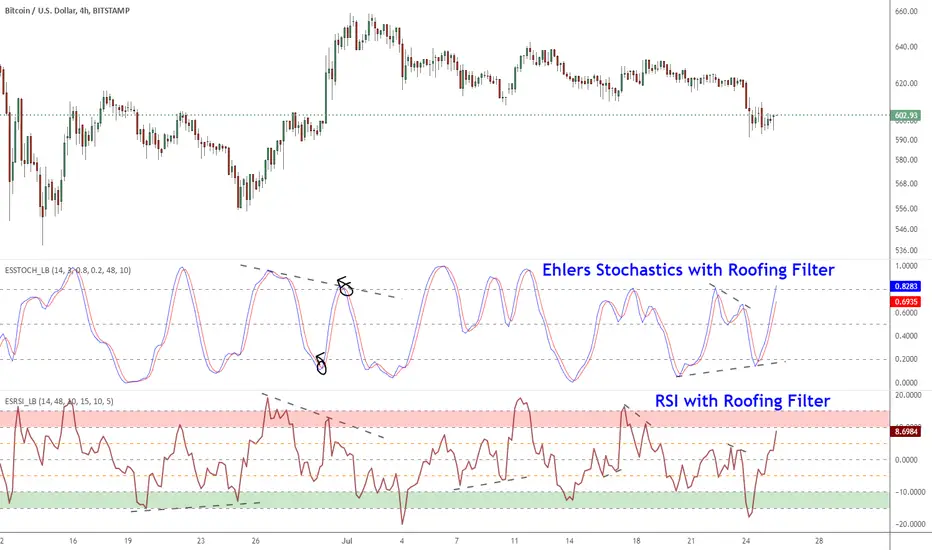
Ehlers Smoothed Stochastic & RSI with Roofing FiltersRoofing filters, first discussed by Mr.John Ehlers, act as a passband, filtering out unwanted noise from market data and accentuating turning points. I have included 2 indicators with filters enabled. Both support double smoothing via options page. All the parameters are configurable. Info on Roofing Filter and Ehlers Super Smoother: ---------------------------------------------------- The Ehlers' Roofing Filter is an expansion on Ehlers Super Smoother Filter, both being smoothing techniques based on analog filters. This filter aims at reducing noise in price data. In Super Smoother Filter, regardless of the time frame used, all waves having cycles of less than 10 bars are considered noise (customizable via options page). The Roofing Filter uses this principle, however, it also creates a so-called "roof" by eliminating wave components having cycles greater than 48 bars which are perceived as "spectral dilation". Thus, the filter only passes those spectral components whose periods are between 10 and 48 bars. This technique noticeably reduces indicator lag and also helps assess turning points more accurately. More info: - Spectral dilation paper: www.mesasoftware.com - John Ehlers presentation: www.youtube.com ------------------------------------------------------ If you want to use RSI %B and Bandwidth, follow this guide to "Make mine" this chart and get access to the source: drive.google.com For the complete list of my indicators, check this post: مؤشر Pine Script®من LazyBear1818 2.3 K
Fisher Transform Indicator by Ehlers - Strategy Market prices do not have a Gaussian probability density function as many traders think. Their probability curve is not bell-shaped. But trader can create a nearly Gaussian PDF for prices by normalizing them or creating a normalized indicator such as the relative strength index and applying the Fisher transform. Such a transformed output creates the peak swings as relatively rare events. Fisher transform formula is: y = 0.5 * ln ((1+x)/(1-x)) The sharp turning points of these peak swings clearly and unambiguously identify price reversals in a timely manner. مؤشر Pine Script®من HPotter2828 1.7 K
Fisher Transform Indicator by Ehlers Market prices do not have a Gaussian probability density function as many traders think. Their probability curve is not bell-shaped. But trader can create a nearly Gaussian PDF for prices by normalizing them or creating a normalized indicator such as the relative strength index and applying the Fisher transform. Such a transformed output creates the peak swings as relatively rare events. Fisher transform formula is: y = 0.5 * ln ((1+x)/(1-x)) The sharp turning points of these peak swings clearly and unambiguously identify price reversals in a timely manner. مؤشر Pine Script®من HPotter77 1.9 K
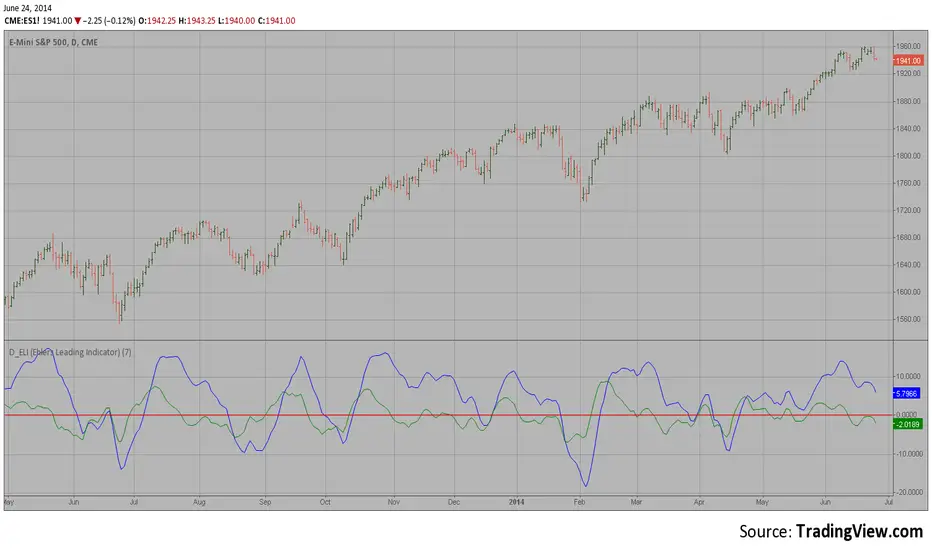
D_ELI (Ehlers Leading Indicator) This Indicator plots a single Daily DSP (Detrended Synthetic Price) and a Daily ELI (Ehlers Leading Indicator) using intraday data. Detrended Synthetic Price is a function that is in phase with the dominant cycle of real price data. This one is computed by subtracting a 3 pole Butterworth filter from a 2 Pole Butterworth filter. Ehlers Leading Indicator gives an advanced indication of a cyclic turning point. It is computed by subtracting the simple moving average of the detrended synthetic price from the detrended synthetic price. Buy and Sell signals arise when the ELI indicator crosses over or under the detrended synthetic price. See "MESA and Trading Market Cycles" by John Ehlers pages 64 - 70. مؤشر Pine Script®من HPotter11330