MA Cross MTF Alert (Miu)This script extends the classic moving average crossover strategy with support for up to 8 user-defined symbols across 4 custom timeframes, combined with a visual and alert system designed for traders who monitor multiple assets simultaneously.
Unlike traditional MA crossover tools, this script enables traders to receive real-time alerts for crossovers across multiple assets and timeframes, even when the script is not actively displayed on the chart — ideal for passive monitoring in multi-asset strategies.
What it does:
This script calculates two customizable moving averages (SMA or EMA) for each selected symbol and timeframe.
It then tracks crossover events:
- Bullish crossover when the fast MA crosses above the slow MA
- Bearish crossunder when the fast MA crosses below the slow MA
On the chart, it also displays the crossover signals for the current symbol and timeframe using color-coded cross icons.
Key features:
- Select SMA or EMA type for both moving averages
- Customize MA lengths and colors
- Works with any asset and timeframe
- Alerts include symbol and timeframe info for easy identification
How to use:
1) Add the indicator to your chart.
2) Choose the moving average type and lengths.
3) Enable/disable any of the 8 symbols and 4 timeframes.
4) Set up TradingView alerts by clicking “Create Alert” and selecting one of the alert() calls.
5) You will receive a message like:
BTC (1h) | MA Crossover ▲ or ETH (15m) | MA Crossunder ▼
Technical note:
This script uses request.security() to retrieve moving average values from up to 8 different symbols and 4 different timeframes in real time.
Feel free to leave your feedback or suggestions in the comments section below.
Enjoy!
EMA-SMA

EMA x 3 MAsThis indicator can be used for moving average strategies based on a EMA trigger over MAs (SMAs) : MA1 , MA2 , MA3 .
Based on those crossings, the background color will change for the upcoming candle showing green for upper crossing change (the more MA are crossed, the darker is the background). Order and priority of background colors :
1/ EMA x MA1
2/ EMA x MA2 (if EMA x MA1 confirmed)
3/ EMA x MA3 (if EMA x MA1and EMA x MA2 confirmed)
EMA and MAs can also be tuned with your own values in the parameters, therefore allowing you to try different strategies and to use the EMA and MAs as support/resistance indication.
You can set up the background and lines colors in the Style in the parameters.

5 Moving AveragesFive Moving averages. Choose from several types, SMA, EMA, SMMA etc... Has X and Y offset.
SUPER MULTI MOVING AVERAGE [Gabbo]📈 Moving Average Indicator Update - Version 2
🔹 New Features and Improvements:
1️⃣ Enhanced MA Selection for Table Lines:
Previously, the indicator did not allow users to choose a different Moving Average type for the table lines. Now, you can select the MA type for the table.
2️⃣ New Table Text Customization Inputs:
Added inputs to choose the table text color and size for a more personalized display.
3️⃣ Improved Input Visibility and Organization:
We’ve reorganized the inputs so that the most commonly used options are now placed at the beginning for quicker and more convenient configuration.
4️⃣ Bug Fixes and Code Improvements:
Minor bugs have been fixed, and the code has been optimized for improved stability and performance. The code is now cleaner and fully functional in version 6.
5️⃣ Cometreon Public Library Integration:
To lighten the code and improve modularity, we’ve integrated the Cometreon public library. This makes the code more efficient and reduces the need to duplicate common functions.
☄️ With this update, the Moving Average indicator becomes even more versatile and user-friendly, offering a refined table interface and enhanced customization options!

Staple MAsThis is a useful indicator which allows you to plot multiple common predefined Moving Averages (Ema and Sma). Here are some of its features:
Ability to quickly display many common EMAs and SMAs.
Multiple timeframes.
Descriptive labels to avoid misreading.
Simple and well-organized Input Tab.

Higher TF Moving AveragesScript showing up to 5 different Moving Averages of a Higher Timeframe.
User can select the MA type (EMA or SMA) and its length.
Default are 10, 20, 50, 100 and 200 period SMAs.
The script will also plot optional labels with price display.
All plots and color are configurable.
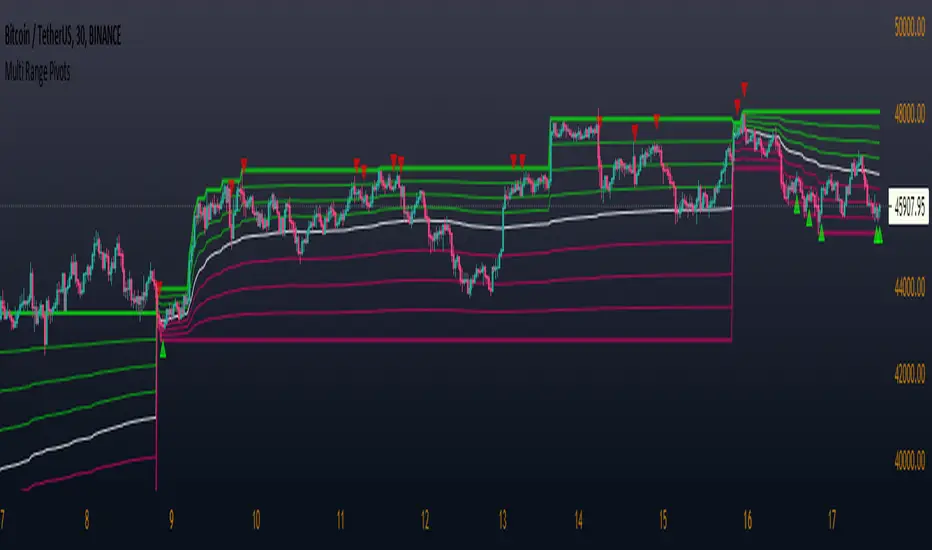
Multi Range Pivots
Multi Range Pivots works by recognizing the high and low of the timeframe selected and plotting range high to MEAN averages and range low to MEAN averages.
This is essentially the VWAP pivots updated to include not only VWAP as a MEAN, but also SMA, EMA, VWMA, DEMA, TEMA, TRIMA, KAMA, MAMA, T3, H/L basis and Donchian basis.
Also, with high and low no longer repainting, I was able to add true reliable signals.
Enjoy
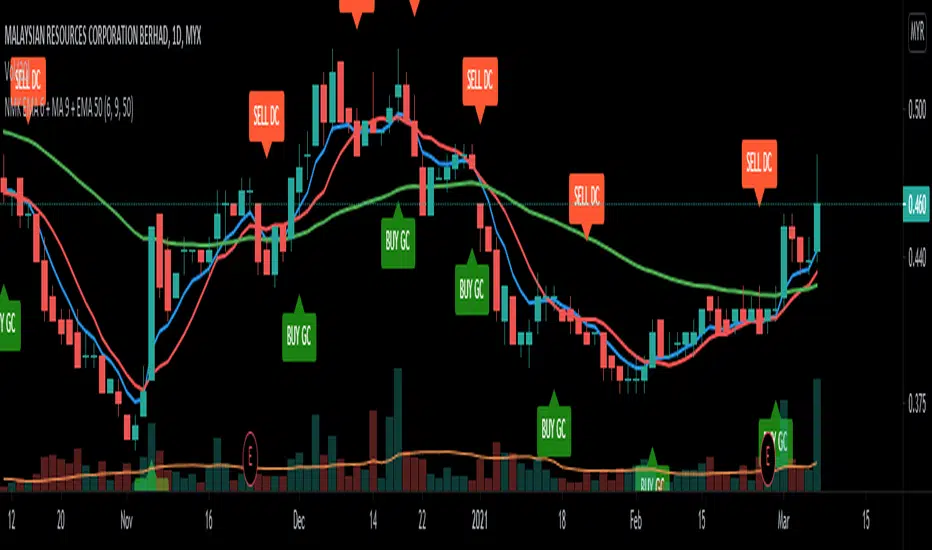
NMK EMA 6 + MA 9 + EMA 50Conceived by Murad Khalid
Shows the GC of EMA 6 and MA 9
Shows the DC of EMA 6 and MA 9
Use EMA 50 as the dynamic support
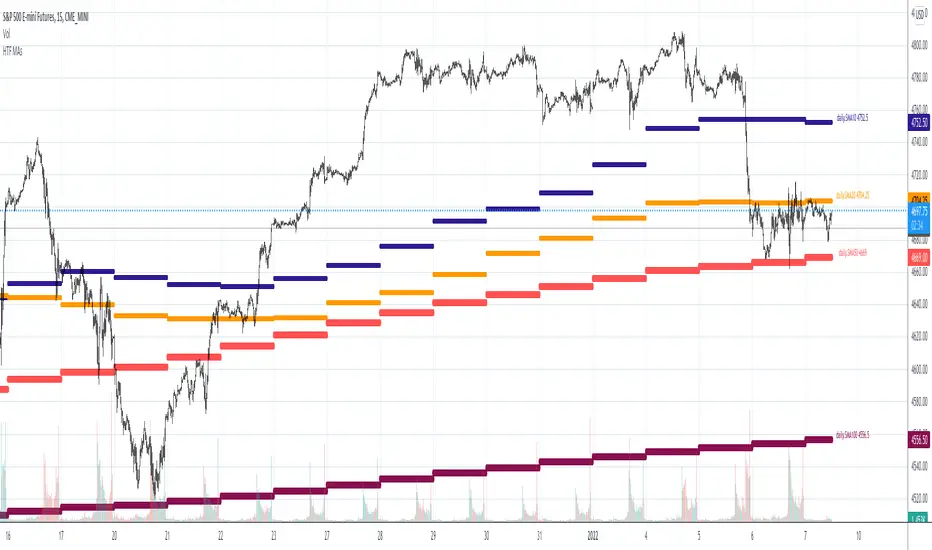
Weekly & Daily SMA 50/100/200The daily and weekly simple moving averages (SMA) are displayed in all timeframes.
The SMAs can be used for support and resistance. The lines of the past 50, 100 and 200 days and weeks are considered strong supports and resistances.
The daily lines are yellow and the weekly lines are green. The thicker and more visible a line is, the more important it is in the chart.


Ichimoku ++ public v0.9Description:
The intention of this script is to build/provide a kind of work station / work bench for analysing markets and especially Bitcoin . Another goal is to get maximum market information while maintaining a good chart overview. A chart overloaded with indicators is useless because it obscures the view of the chart as the most important indicator. The chart should be clear and market structure should be easy to see. In addition, some indicator signals can be activated to better assess the quality of signals from the past. The chart environment or the chart context is important for the quality of a signal.
The intention of this script is not to teach someone how to trade or how to use these Indicators but to provide a tool to analyse markets better and to help to draw conclusions of market behaviour in a higher quality.
A general advise:
Use the included indicators and signals in a confluent way to get stoploss, buy and sell entry points. SR clusters can be identified for use in conjunction with fractals as entry and exit pints. My other scripts can also help. Prefer 4 hours, daily and a longer time frame. There is no "Holy Grail" :).
If someone is new to trading you should learn about the indicators first. Definitely learn about Ichimoku Cloud Indicator.
Integrated indicators are:
Ichimoku Cloud and signals
Parabolic SAR and signal
ATR stop
Bollinger Bands
EMA / SMA and background color as signal
Williams Fractals and signal
Puell Multiple signal

CBG Swing HighLow MAThis indicator will show the swing high and lows for the number of bars back. It's very easy to use and shows good support and resistance levels.
I then took it a step further and added a moving average with all the standard types in my indicators:
SMA
EMA
Weighted
Hull
Symmetrical
Volume Weighted
Wilder
Linear Regression
I then added Bollinger Bands to show the standard deviation from the midline.
Finally, I added a simple bar coloring scheme: green if above the upper BB, Red if below and orange if in the middle.
I am just testing this out so please use with caution. If anyone in the community wants to run some backtests, that would be great and we would all appreciate it.
Of course you can keep it all simple and turn off all the moving averages and bollinger bands.
Enjoy! :-)

CBG Keltner ChannelsKeltner Channel with the following Moving Average types: SMA, EMA, Weighted, Hull, Symmetrical, Volume Weighted, Wilder and Linear Regression. Plus 2 bands with full color shading.
The picture shows the Keltner channels with the Wilder MA, my favorite. See how easy it would have been to stay in the move down? Excellent indicator.

Bollinger Channels / EMA and SMAThis is written as a system to replace the BB strategy.
I think it will work well.
It looks pretty stylish.
Description / Usage:
Adjust the length and multiplier based on your location with Bollinger Bands.
The multiplier of 1 provides you with a basic channel with high and low-source EMA (or SMA).
And with the 8-day exponential moving average, you can observe short entries and exits.
I wish good luck to the friends who will use it.
You can support and track new indicators.
Bu, BB stratejisinin yerini alacak bir sistem olarak yazılmıştır.
Oldukça şık görünüyor.
Kullanım
Bollinger Bantları ile bulunduğunuz yere göre uzunluk ve çarpanı ayarlayın.
1 çarpanı size yüksek ve düşük kaynaklı EMA (veya SMA) içeren temel bir kanal sağlar.
Ve 8 günlük üstel hareketli ortalama ile kısa giriş ve çıkışları gözlemleyebilirsiniz.
Kullanacak arkadaşlara bol kazançlar diliyorum.
Yeni indikatör için destek olabilir ve takip edebilirsiniz.

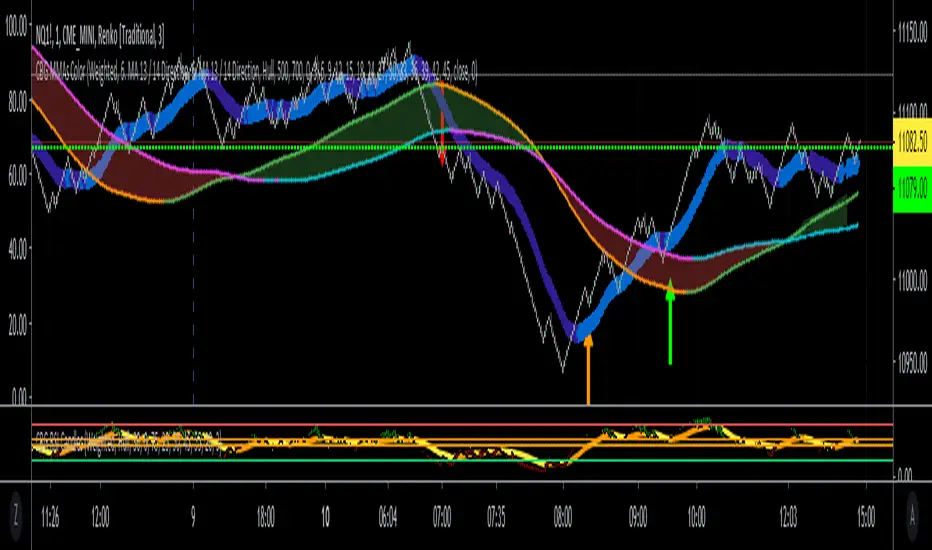
CBG MultiAverages ColorsThe latest version of my multiple moving averages. Now includes up to 14 moving averge lines plus a separate slow and fast moving average that can be assigned a different MA type.
In the screen shot is the fast/slow set to Hull with 15/50 periods. It is overlaid on top of my Key Numbers indicator.
7 moving averages in 1 indicator, including the Hull Moving Average .
SMA
EMA
Weighted
Hull
Symetrical
Volume Weighted
Wilder
Linear Regression
Lots of other features like background shading and paint bar colors.
Multi-EMA | 5 EMAs in 1 ScriptAdd up to 5 EMAs to your charts with this script.
Fully Customizable.
----------------------------------------
Wanna try my other scripts?
Histogram with Divergence Finder:
Willams %R with 13 EMA and Divergence Finder:
More scripts here:
www.tradingview.com
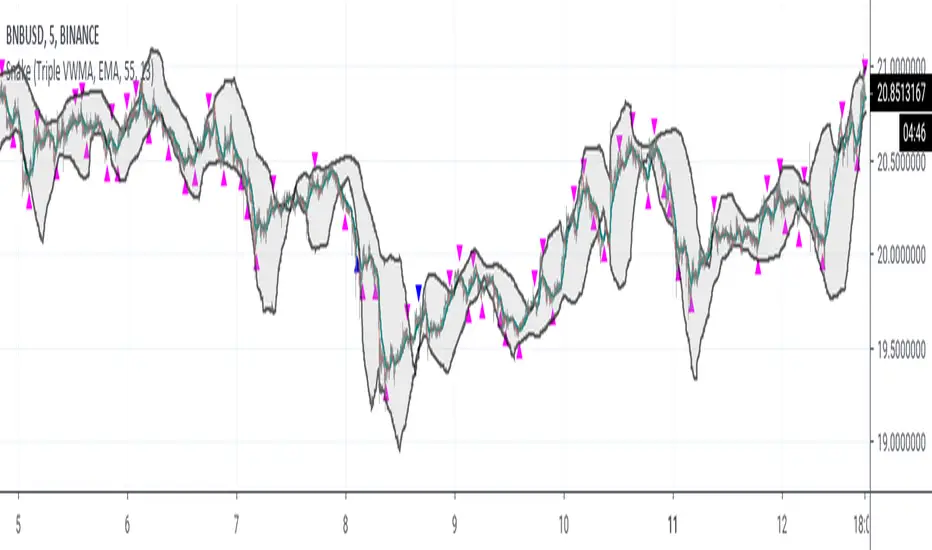
SnakeWhile moving averages are a good way to visualize price action, they are, in general, very poor indicators to trade against. Usually, the lowest prices occur before the cross over of multiple moving averages, while the best profits occur just before the crossunders of the moving averages.
This study captures the buy signals before the cross overs and sells just prior to the cross unders, when prices are lowest and highest respectively.
This is accomplished by treating the moving average as a "snake", specifically looking for the "head" of the snake to turn upwards when buying is most opportunistic. Note the the body must still be trending downward.
For selling, the "snake's head" must be turning down while the body is trending up.
This script uses blue arrows, pointing up, at the bottom, to indicate a buy signal, sending an alert of BUY ASSET.
Blue arrows, point down, at the top, represent sell signals with an alert of SELL ASSET.
The gray bar or strip is momentum. The snake's head must be above momentum for a sell, and below for a buy. This study does NOT work well with stable coins.
The longer the momentum, the more likely weak signals will be weeded out, but also presents less opportunities for buys.
The longer the length of the snake, the more likely cascading down turns will be ignored, but requires a longer trend to identify buy signals.


The Mango Ribbon The Mango Ribbon is a convenience indicator which encompasses a combination of moving averages combining those of exponential and Ichimoku averages. I will be updating this indicator with more features as time passes.
Hope you enjoy. For access, simply pm me on Telegram (porco1x) or use the sign up form at mangoresearch.co

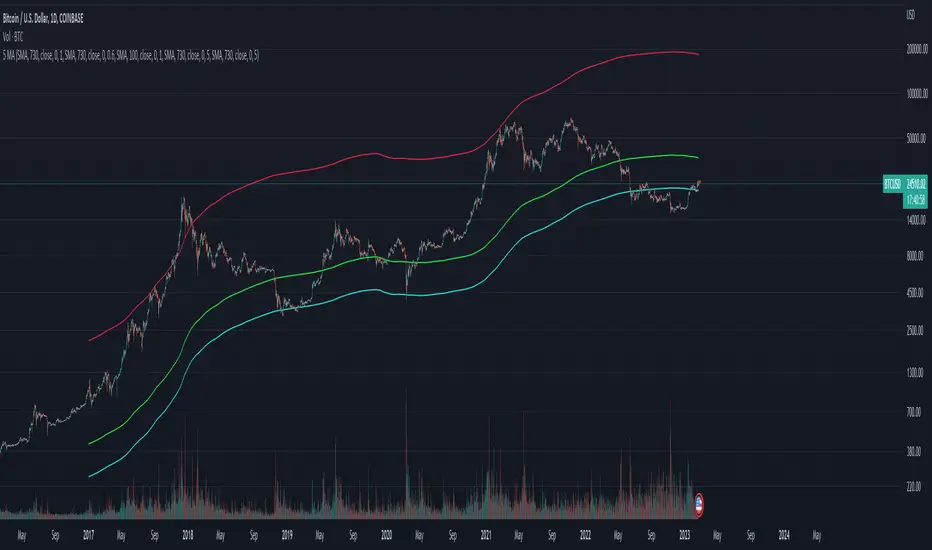
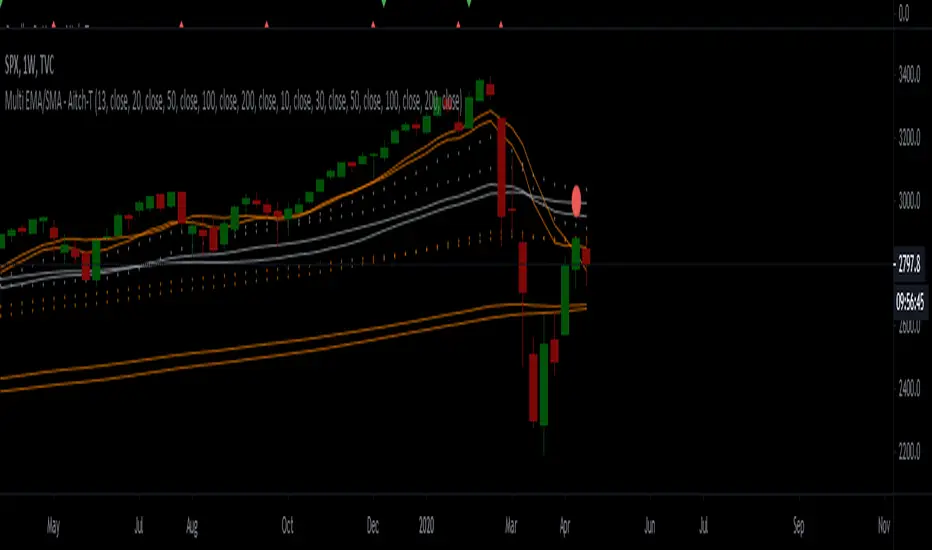
Adaptive Moving AveragesThis script is able to adaptively show different moving averages, depending on the timeframe.
The default values are:
-8 weekly EMA
-20,50,100 and 200 SMA
-4 hourly 50 EMA
-Hourly 50 EMA
-15 minutes 20 SMA
These moving averages are the ones I use the most, and were originally covered in a video by Financial Freedom (Nasir Jones) called " HOW TO USE MOVING AVERAGES- BTC CASE STUDY" (Highly recommended).
Feel free to change the default values. Also, if you don't want to show certain moving averages, go to style and just untick the visibility checkbox of the ones you don't want to see.

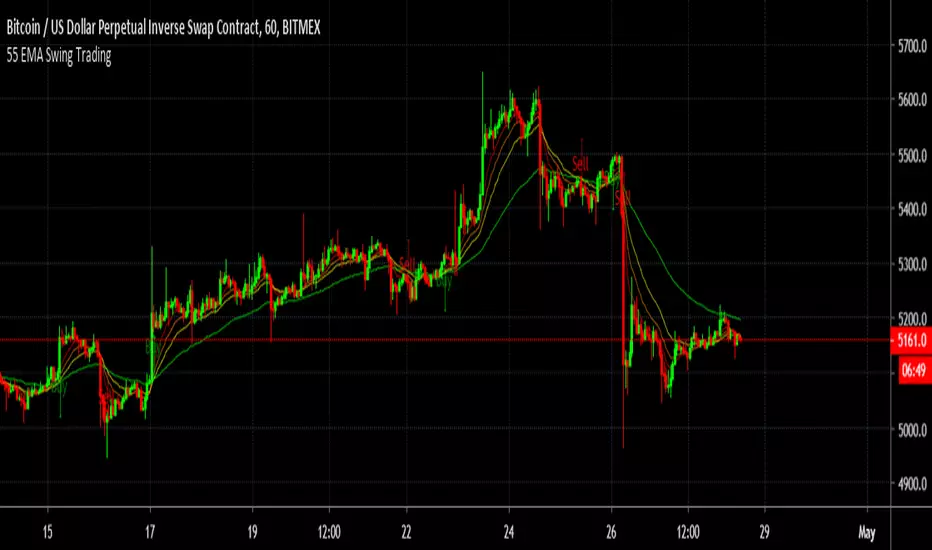
55 EMA Swing TradingA simple Buy and sell strategy using 55 EMA - " 55 EMA Swing Trading"
The source code is publicly available to for further modification.