US/SPY- Financial Regime Index Swing Strategy Credits: concept inspired by EdgeTools Bloomberg Financial Conditions Index (Proxy)
Improvements: eight component basket, inverse volatility weights, winsorization option( statistical technique used to limit the influence of outliers in a dataset by replacing extreme values with less extreme ones, rather than removing them entirely), slope and price gates, exit guards, table and gradients.
Summary in one paragraph
A macro regime swing strategy for index ETFs, futures, FX majors, and large cap equities on daily calculation with optional lower time execution. It acts only when a composite Financial Conditions proxy plus slope and an optional price filter align. Originality comes from an eight component macro basket with inverse volatility weights and winsorized return z scores that produce a portable yardstick.
Scope and intent
Markets: SPY and peers, ES futures, ACWI, liquid FX majors, BTC, large cap equities.
Timeframes: calculation daily by default, trade on any chart.
Default demo: SPY on Daily.
Purpose: convert broad financial conditions into clear swing bias and exits.
Originality and usefulness
Unique fusion: return z scores for eight liquid proxies with inverse volatility weighting and optional winsorization, then slope and price gates.
Failure mode addressed: false starts in chop and early shorts during easy liquidity.
Testability: all knobs are inputs and the table shows components and weights.
Portable yardstick: z scores center at zero so thresholds transfer across symbols.
Method overview in plain language
Base measures
Return basis: natural log return over a configurable window, standardized to a z score. Winsorization optional to cap extremes.
Components
EQ US and EQ GLB measure equity tone.
CREDIT uses LQD over HYG. Higher credit quality outperformance is risk off so sign is flipped after z score.
RATES2Y uses two year yield, sign flipped.
SLOPE uses ten minus two year yield spread.
USD uses DXY, sign flipped.
VOL uses VIX, sign flipped.
LIQ uses BIL over SPY, sign flipped.
Each component is smoothed by the composite EMA.
Fusion rule
Weighted sum where weights are equal or inverse volatility with exponent gamma, normalized to percent so they sum to one.
Signal rule
Long when composite crosses up the long threshold and its slope is positive and price is above the SMA filter, or when composite is above the configured always long floor.
Short when composite crosses down the short threshold and its slope is negative and price is below the SMA filter.
Long exit on cross down of the long exit line or on a fresh short signal.
Short exit on cross up of the short exit line or on a fresh long signal, or when composite falls below the force short exit guard.
What you will see on the chart
Markers on suggestion bars: L for long, S for short, LX and SX for exits.
Reference lines at zero and soft regime bands at plus one and minus one.
Optional background gradient by regime intensity.
Compact table with component z, weight percent, and composite readout.
Table fields and quick reading guide
Component: EQ US, EQ GLB, CREDIT, RATES2Y, SLOPE, USD, VOL, LIQ.
Z: current standardized value, green for positive risk tone where applicable.
Weight: contribution percent after normalization.
Composite: current index value.
Reading tip: a broadly green Z column with slope positive often precedes better long context.
Inputs with guidance
Setup
Calc timeframe: default Daily. Leave blank to inherit chart.
Lookback: 50 to 1500. Larger length stabilizes regimes and delays turns.
EMA smoothing: 1 to 200. Higher smooths noise and delays signals.
Normalization
Winsorize z at ±3: caps extremes to reduce one off shocks.
Return window for equities: 5 to 260. Shorter reacts faster.
Weighting
Weight lookback: 20 to 520.
Weight mode: Equal or InvVol.
InvVol exponent gamma: 0.1 to 3. Higher compresses noisy components more.
Signals
Trade side: Long Short or Both.
Entry threshold long and short: portable z thresholds.
Exit line long and short: soft exits that give back less.
Slope lookback bars: 1 to 20.
Always long floor bfci ≥ X: macro easy mode keep long.
Force short exit when bfci < Y: macro stress guard.
Confirm
Use price trend filter and Price SMA length.
View
Glow line and Show component table.
Symbols
SPY ACWI HYG LQD VIX DXY US02Y US10Y BIL are defaults and can be changed.
Realism and responsible publication
No performance claims. Past is not future.
Shapes can move intrabar and settle on close.
Execution is on standard candles only.
Honest limitations and failure modes
Major economic releases and illiquid sessions can break assumptions.
Very quiet regimes reduce contrast. Use longer windows or higher thresholds.
Component proxies are ETFs and indexes and cannot match a proprietary FCI exactly.
Strategy notice
Orders are simulated on standard candles. All security calls use lookahead off. Nonstandard chart types are not supported for strategies.
Entries and exits
Long rule: bfci cross above long threshold with positive slope and optional price filter OR bfci above the always long floor.
Short rule: bfci cross below short threshold with negative slope and optional price filter.
Exit rules: long exit on bfci cross below long exit or on a short signal. Short exit on bfci cross above short exit or on a long signal or on force close guard.
Position sizing
Percent of equity by default. Keep target risk per trade low. One percent is a sensible starting point. For this example we used 3% of the total capital
Commisions
We used a 0.05% comission and 5 tick slippage
Legal
Education and research only. Not investment advice. Test in simulation first. Use realistic costs.
سهم

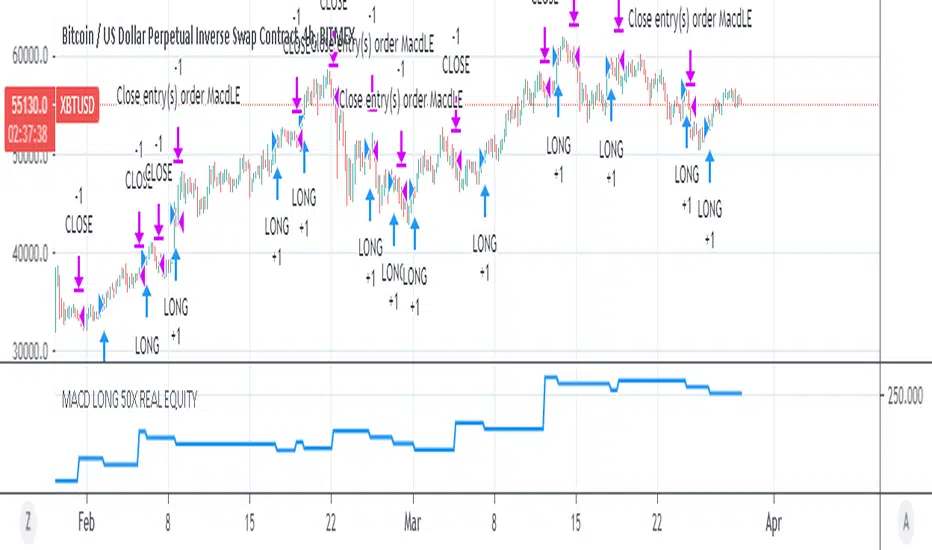
MACD 50x Leveraged Strategy Real Equity Simulation Hello, I wrote this script to merge the two scripts I shared before.
The aim here is to see the real value of the state of the capital as a result of leveraged transactions and to combine both long and short directions.
Scripts :
MACD Long 50x Leverage Strategy :
MACD Short 50x Leverage Strategy :
The parameters have not changed so they are the same as the previous two scripts:
Adding margin: Forbidden or not specified. (Add Margin : No)
Position Size : %1 (0.01) (For each trade)
Stop-Loss : %2 (For each trade)
Long : Crossover(delta,0) (Standard MACD)
Long Exit : Long Stop Level or Short Entry
(In the case of Long Stop, all trades are closed and no positions are opened in short direction.)
Short : Crossunder(delta,0) (Standard MACD)
Short Exit : Short Stop or Long Entry
(In the case of Short Stop, all trades are closed and no positions are opened in the long direction.)
NOTE :
This is a simulation made using standard parameters, showing the state of the balance in very simple rules with leveraged transactions only.
The nice thing here is the direct observation of the results by making modifications on the strategy parameters.
Regards.

MACD 50x Leveraged Short Strategy with Real Equity
Hello there ,
Short version of the Macd Long strategy.
MACD Long strategy:
Adding margin: Forbidden or not specified. (Add Margin : No)
Position size: (for each trade) 1%
Stop-Loss: (2% Above Entry Level)
Long: macd crossunder
Exit: macd crossover
Or ofc touching the stop-Loss value as predicted.
These strategies are just examples.
The goal is to observe true equity and equity change.
Warning: This strategy simulation is for Short direction only.
Regards.

MACD 50x Leveraged Long Strategy Results with Real Equity Hello there.
I was looking for a way to simulate leveraged transactions in Tradingview and this script came out.
You can examine the equity graph without looking at the strategy results.
Thus, the facts will come to light.
Strategy parameters:
Adding margin: Forbidden or not specified. (Add Margin : No)
Position size: (for each trade) 1%
Stop-Loss: (2%)
Long: macd crossover
Exit: macd crossunder
Or ofc touching the stop-Loss value as predicted.
Warning: This strategy simulation is for Long direction only.
Regards.
Understanding order sizestype: properties manipulation, no programming needed
time required: 15minutes, at least
level: medium (need to know contracts, trading pairs)
A strategy can "appear" to work or be broken depending on the pile of cash that is working on. This amount is defined in the strat properties, under "order size".
For noobs (like me) this is very confusing at first :)
A strat opens/closes positions using units, a generic measure for the chart being operated on. Thes "units" can be a fixed amount of cash, a fixed amount of contracts, or a floating amount based on the last profits made. I recommend checking my previous strat to figure the case of contracts .
So, any trading price is the amount of "things" you get for some "cash". The things are the first unit, the "cash" is the second. Some examples:
XAU/USD - 1 xau oz is worth x dollars
BTC/USD - 1 bitcoin is worth x dollars
GBP/EUR - 1 pound is worth x euros
To add to confusion, a lot of markets the "unit size" is different from what the strat thinks it is. An options contract is 100 shares(the unit), 1 xau contract is 10 oz(units), 1 eur/usd contract is 100k euros and so on... so, after figuring out how the sizes work in a strat, then the sizes must be adapted for the specific market in question.
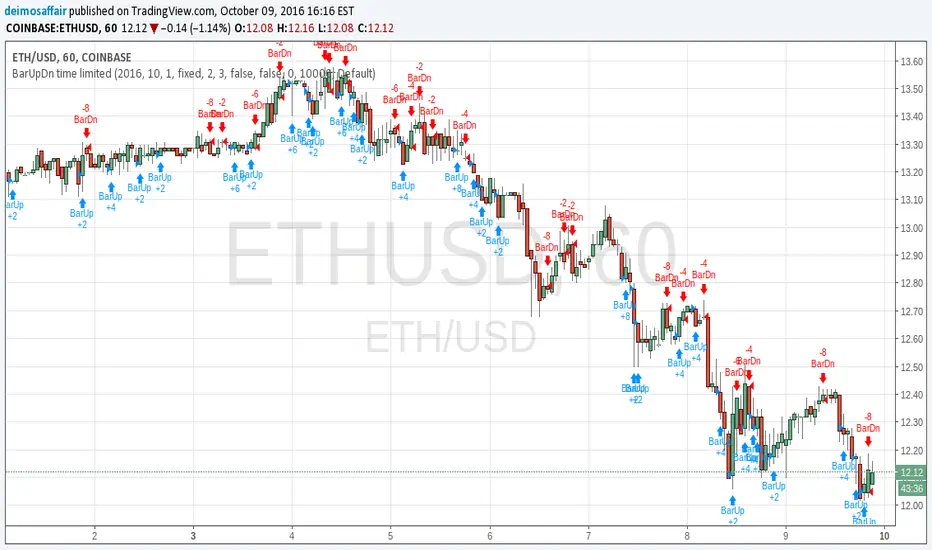
The choice os using the ETHUSD pair is because:
1 - you can buy 1eth, unlike a gold contract for example, so 1 "unit" = 1 eth, easier to get
2 - ETH is around 12 bucks, wich gives round numbers on the math, easier to wrap the brains around :)
3- is an unusual pair, so the regular contract sizes don't apply, and the brain is not conditioned to work inside the box ;)
You will have to access the script properties, to change the values. As these values are changed you will see exactly the differences in the values of the strat.
Text is too long, check the comments for all the cases
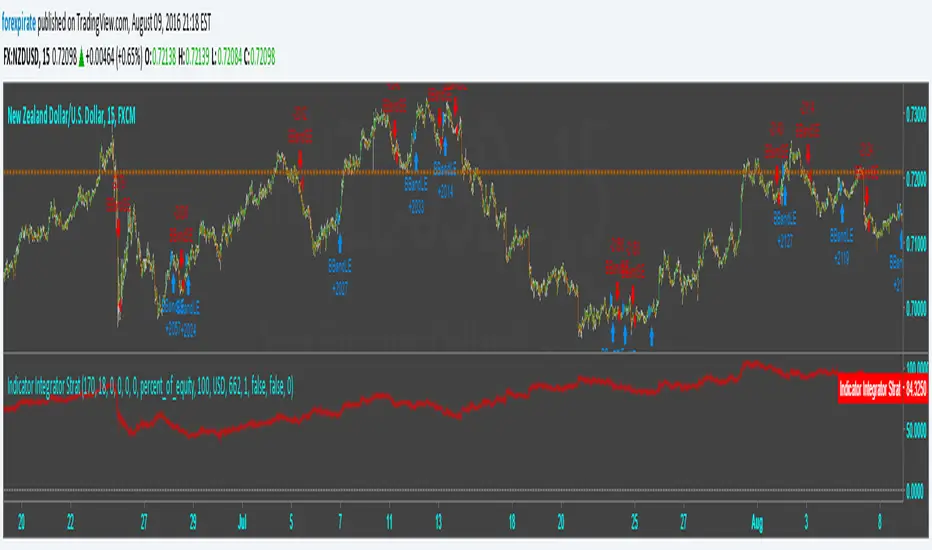
Indicator Integrator Strat <<<<<< UPDATED with CorrectionFound an error in the orders. Script was making double orders at times. I fixed it. It is tuned as such:
NZDUSD
15 min chart
starting $USD to show 1000 contracts for minicontract with FXCM (start date 3-18 $633 with 1:50 leverage)
Indicator plots ==> Starting equity - (trade gain and loses) - (number of trades) * (spread) = true balance estimate