MRM+R2 [VK] V4.0MRM VK Alert
This is the alert version of MRM strategy.
MACD and RSI can be used multi time frame to filter trend.
It is a very simple strategy which goes long/short when MACD , RSI and MA Trend Changes in higher Time Frame.
Additional Features :
RSI 2 signals to Re-enter
ATR stops plotted below signals
إيثيريوم (عملة رقمية)

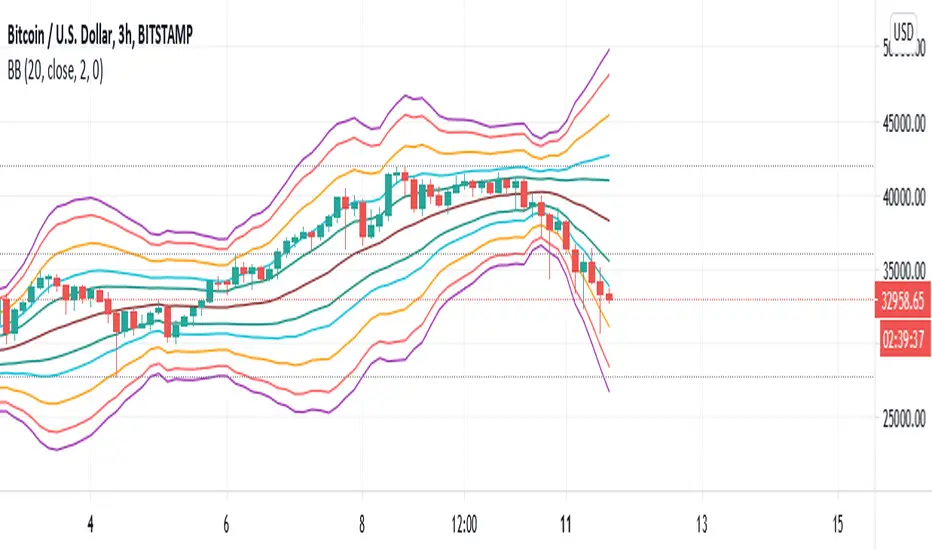
DeLorean-V4 Long/ShortThis study aims to follow the trend of the asset, in longer times it is quite correct, but it can also be used in shorter time to be able to follow the trend of the asset.
Using the Bollinger Bands indicator, to get a better idea of volatility .
This indicator shows me the best trend in the cryptocurrency scenario, but it was very positive, also showing the trend in the "traditional" market.
Configured alerts for Long / Short.
Enjoy!
----------------PT-BR-----------
Este estudo visa acompanhar a tendência do ativo, em tempos maiores é bem assertivo, mas podendo também ser usado em menores tempo para poder acompanhar a tendência do ativo.
Usando o indicador Bollinger Bands , para ter uma ideia melhor da volatilidade.
Este indicador me mostra a tendência melhor no cenário de criptomoedas, mas foi bem assertivo também mostrando a tendência no mercado "tradicional".
Configurado alertas para Long/Short.
Enjoy!

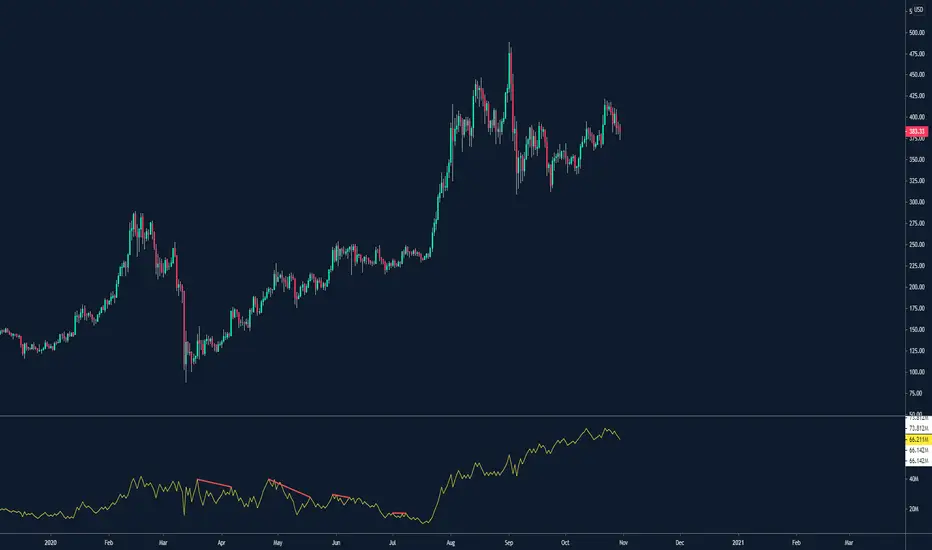
ETH Top Cap [jamesray]This script is modified from Top Cap , as published here.
Historically it matches market tops for ETH

Vix SpikeThis script calculates spikes Vix tops and bottoms. The Vix Market Bottom is calculated using CM_Williams_Vix_Fix Finds Market Bottoms (Chris Moody). The Vix Market Top is calculated as the inverse of CM Williams’ formula.
The highest Vix Bottom and the highest Vix Top are averaged (over the Highest Vix Lookback period).
Buys are signaled when the Vix Bottom line crosses below the Highest Vix Average.
Sells are signaled when the Vix Top line crosses below Highest Vix Average.
BINANCE:ETHUSDT 5 min
BYBIT:XRPUSD 5 min

Ether (Ethereum) CME Gaps [NeoButane]Detects gaps in trading for CME's "Ether" cash-settled futures. This will show gaps as they happen on the 24/7 charts that crypto exchanges use. It is not usable on CME's tickers themselves, as gaps in trading are not displayed.
This indicator will only display if viewing an ETH chart.
More information on the CME ETH futures here:
www.cmegroup.com
Based on:
What's different: CME's BTC and ETH markets trade the same hours, but one may hit a limit breaker while there may be a case where the other does not.

Mayfair Crypto Strength IndexWorking on the basis of a currency strength index - expresses the index value of a currency. For economists, it is often calculated as purchasing power. while for financial traders, it can be described as an indicator, reflecting many factors related to the currency; for example, fundamental data, overall economic performance or in Crypto terms the strength of the company/asset itself.
In the base version;
BTC is the thicker Orange level.
ETH - the Green
XRP - Blue
The concept then is similar to a stochastic indicator or RSI - 20% oversold regio & 80% overbought. The zero line can be used as Bullush or Bearish.
We wanted to create something that shows the correlation between the top cryptocurrencies as we are often asked about breaking down one or the other.
This is not a buy me now or sell me then indicator - just there to assist and compare assets easily.
Please feel free to like and follow.
Disclaimer
This idea does not constitute as financial advice. It is for educational purposes only, our principle trader has over 20 years’ experience in stocks, ETF’s, and Forex. Hence each trade setup might have different hold times, entry or exit conditions, and will vary from the post/idea shared here. You can use the information from this post to make your own trading plan for the instrument discussed. Trading carries a risk; a high percentage of retail traders lose money. Please keep this in mind when entering any trade. Stay safe.

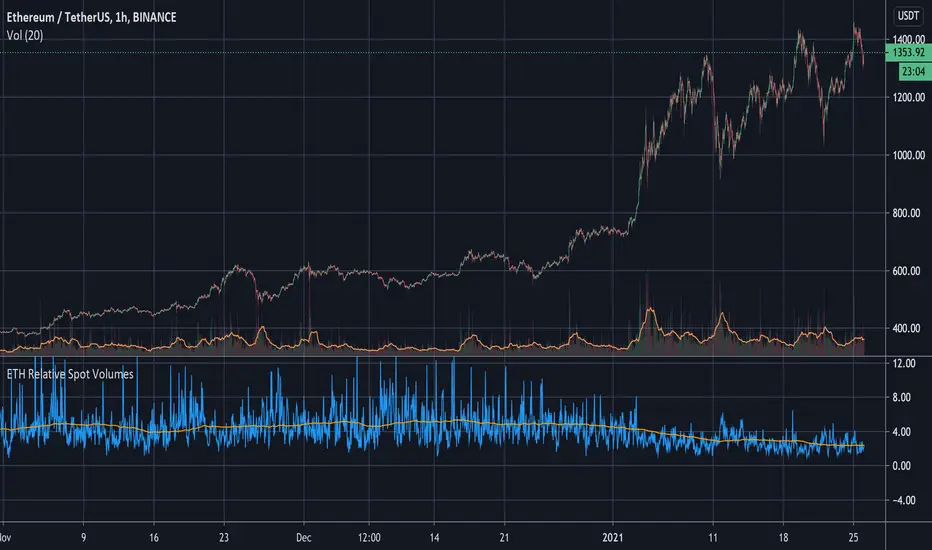
ETH Relative Spot VolumesCompares ETHUSD spot market volumes to ETHUSD perpetual swap volumes.
A higher ratio indicates higher spot buying interest and a more sustained growth overall.
Rallies-driven by spot are deemed more resilient to being affected by high funding rates on futures markets. The long-term trend seems to be increased derivatives volume on ETHUSD contracts making spikes of spot interest more noticeable.
A 200-period Simple Moving Average is applied to indicate a long-term trend.
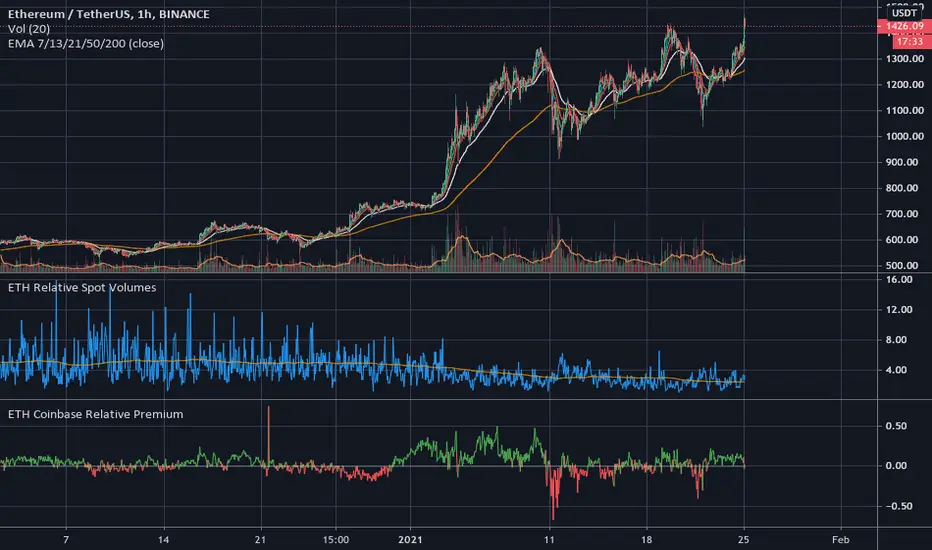
ETH Coinbase Relative PremiumIndicates the relative price premium on Coinbase ETHUSD market against Binance ETHUSDT market.
A great indicator for spotting US-driven spot buying.
Bullmarket Support BandThis Indicator displays a Bull Market Support Band for Bitcoin and Ethereum . If the bands cross and the price falls below them it usually means (at least by historical data) that the Bull Market ist coming to an end.
Use in weekly timeframe!

ETH Aggregated Perps VolumeAggregated ETH volume of the top perpetual swaps.
It's quoted in USD.
Every exchange's volume has been correctly converted.
Most people don't know that a lot of exchanges display their volume differently because of the face value that 1 contract has.
You can see in the settings which perps are included and you can opt to exclude certain contracts.
Indicator is free just add it to your favourites.

PROFIT MAKER |Crypto|ETH|BTC|YFI - SignalThis is the version with alerts of this strategy:
Description:
This is a trend-following strategy that works very well for many Crypto assets in the usd or usdt pair
It can be used for both futures and spot!
Some of the assets in which this strategy is proven are
Asset Exchange TF
BINANCE:ADAUSDT Binance 45m
BINANCE:BTCUSDT Binance 1h
BINANCE:YFIUSDT Binance 30m
BINANCE:DOTUSDT Binance 45m
BINANCE:ETHUSDT Binance 30m
BINANCE:LINKUSDT Binance 45m
BINANCE:DOGEUSDT Binance 1h
And many others..
What is this strategy based on?
It is a combination of various parameters, including
-RSI: The relative strength index ( RSI ) is a momentum indicator used in technical analysis that measures
the magnitude of recent price changes to evaluate overbought or oversold conditions in the price of a stock or other asset.
-MACD: Moving average convergence divergence ( MACD ) is a trend-following momentum indicator that shows
the relationship between two moving averages of a security’s price.
-ADX: ADX is used to quantify trend strength. ADX calculations are based on a moving average of price range expansion over a given period of time.
-DMI: DMI is a moving average of range expansion over a given period (the default is 14 days). The positive directional
movement indicator ( +DMI ) measures how strongly price moves upward; the negative directional movement indicator ( -DMI )
measures how strongly price moves downward. The two lines reflect the respective strength of the bulls versus the bears.
Included:
Different forms of Take profit, included:
Take profit on squeeze candles
Take profit based on Risk-Benefit (RR)
Take profit a pre-determined %.
Different forms of Stop Loss, including
ATR-based stop loss
Trail stop loss (with option to use a trigger)
Stop loss a pre-determined %.
For access you can send a message or consult in my social networks.
Links in my tradingview signature (below).
Examples:
The default configuration works very well for most pairs.
You just have to look for which time frame goes better with each one.
Recommended to try with 30m, 45m and 1 hour.

ETH Spot Volume DominanceSimple Indicator that shows you the relative volume ratio between ETH spot markets and derivatives markets.
The higher the ratio the more dominant spot markets are (which is generally considered bullish).
Markets included for spot:
Coinbase USD
Bitstamp USD
Bitfinex USD
Kraken USD
Binance USDT
Huobi USDT
Okex USDT
Poloniex USDT
Markets included for derivatives (only perps of course):
Binance USDT
Huobi USD
Okex USD
Bybit USD
Bitmex USD
FTX USD
Deribit USD
Kraken USD
This is free so just add it to your favourites.
Enjoy.

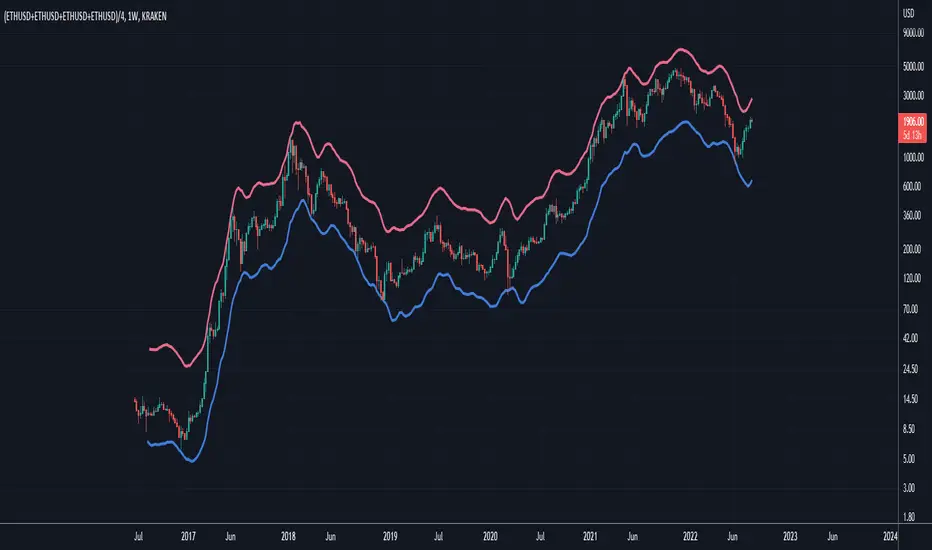
Ethereum: Confidence BandsPurpose of this Script
Similar to "Bitcoin: Confidence Bands", this script is designed to show regions of positive and negative overextension for Ethereum, where price is expected to either reverse long-term or at least shorter-term, using custom price loops tuned for the Ethereum case. Again, the idea is that one can be highly confident that Ethereum's price stays within the Confidence Bands, especially when looking at weekly closes. It might be wise to reduce exposure to Ethereum when price gets very near to the red band, and vice versa for an approach of the blue band. Of course this constitutes no financial advice, and one should always consider all available information for making trading decisions.
Settings
This indicator should only be used:
- with the default inputs (but of course feel free to play around a bit for testing purposes)
- on the weekly (W) time frame
- and for the following ticker setup, used to get well averaged Ethereum price data (ideally just copy this and paste it into the ticker field in the upper left area of the chart interface): (KRAKEN:ETHUSD+COINBASE:ETHUSD+BITFINEX:ETHUSD+POLONIEX:ETHUSD)/4
Otherwise the intended functionality cannot be guaranteed.
Access
For access please contact me via DM on TradingView or on Twitter (linked on my TradingView profile and in my signature).
Bollinger Bands Fibonacci Ratio Standard Deviation LINESHello Traders.
in this script, Bollinger bands are made based on a standard deviation with respect to Fibonacci ratios. I hope you can be satisfied. If you are satisfied with this script, please like and feel free to share your comments with me.
Teal Upper and Lower B-Bands = 1.0 Standard Deviation
Aqua Upper and Lower B-Bands = 1.618 Standard Deviation
Orange Upper and Lower B-Bands = 2.618 Standard Deviation
Red Upper and Lower B-Bands = 3.618 Standard Deviation
Purple Upper and Lower B-Bands = 4.236 Standard Deviation
you can use this indicator by clicking the button (Add to Favorite Scripts) and then add it to your chart from (Fx) section.
ETH Aggregated Spot VolumeAggregated volume of the most relevant ethereum spot markets, denominated in ETH.
There's also an option to select which markets you want to include or exclude.
Complete list:
Binance USDT
Binance BUSD
Coinbase USD
Coinbase EUR
Bitstamp USD
Bitstamp EUR
Kraken USD
Kraken EUR
Bitfinex USD
Bitfinex EUR
Gemini USD
Huobi USDT
Okex USDT
Bitflyer JPY
Bithumb KRW
FTX USD
Grayscale

Bitcoin Top Finder by DataDaterBitcoin Top Finder is an indicator that detects the absolute top of BTCUSD in each bull cycle (red line). It is also helpful in detecting bottoms of cycle (blue). It is based on cost of electricity and mining hash rate.
If you'd like access to this script, please send me a direct message.

Multi Time Frame Buy&Sell V4.0 [ALERTSETUP]Hi guys,this indicator Developed for Intraday and multi Time Frame Trading. Note: Invite only Script.Request to me Access permission to test this.
*** THIS IS STUDY VERSION ***
Time Frame : can use for 15 min / 30 min / 1h / 4h time
15 min configuration is best result for bitcoin and ethereum .
This can be used : Crypto Currency/ Bitcoins / ethereum ,Forex,currencies ,Index ,Commodity Gold / silver , Oil Market and in Equity / Futures
ETHUSDT Futures 15min
BTCUSDT Futures 15min:
GOLD /USD FOREX 15min:
HOW IT WORKS:
this indicator analyze EMA&SMA support and resistance then combine with pivot point and fibo levels is used to calculate the signals.and finally show entry label on
chart with target point and stop loss
HOW TO USE:
Creating a signal is as simple as adding the indicator called to your chart(buy or sell)label and background color change ( green=buy / red = sell)
green line is target and black line is stop loss.
in top of setting page you can see noise filter option . that can change it to get better result and reduce noise. in setting can set 3 target level and stoploss
NOT:all information show to info panel in chart.
strategy tester : enabled .All you can test this in live market in any segment.
NOT: can to change noise filter in setting setup until to get best result.
Choose any Date Month Year to Current Date and check the results below in the Strategy Tester.
REPAINT/NO REPAINT : No Repaint ,entery labal(buy or sell) and Background Color wont change. In the current candle position wait for the candle to close to see the
stability.
"Set alert": Select "Once per bar close" for your alert options.
There are 5 alerts:
- BUY
- SELL
- BUY OR SELL (for free TV users)
- take profit
- stop loss
To Get access - Send me a private chat message in tradingview.com to get access.Or request in comment section below.
Review and Feedback.Thank you!
Any issues report to me to Fix.Thank you!
Use the link below to obtain access to this indicator:

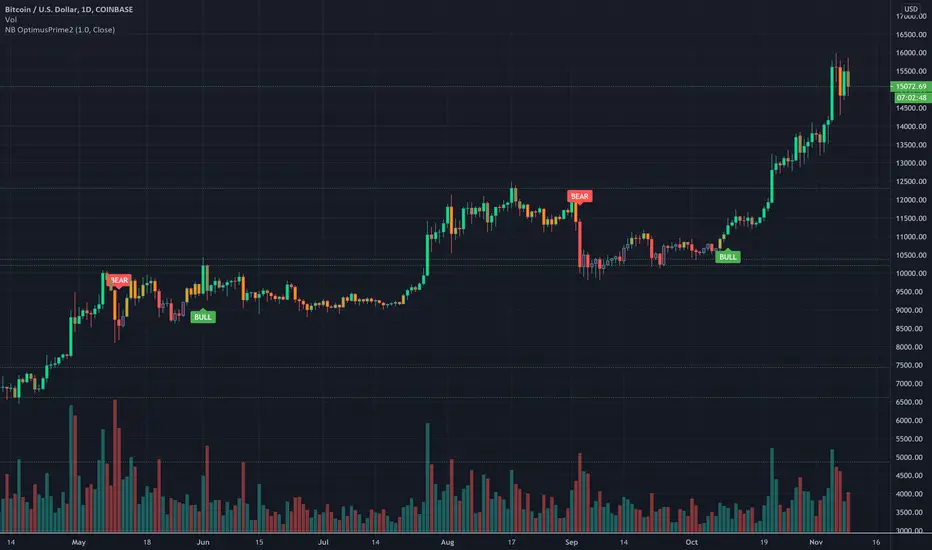
NB OptimusPrime2Hello Everyone,
Welcome to NB Optimus Prime 2.
This is an educational indicator that makes two colorful calls in your chart thus :
Red = Bear
Green = Bull
The calls are meant to indicate potential downtrends and uptrends respectively.
The signals are made based on aggregated Index prices and moving averages which are then smoothened out. Volume is used to gage momentum of the trend which is then shown by colors on the candle stick. This indicator is best used in combination with other traditional indicators i.e MACD , RSI and other tools that are available on TradingView.
Even though this indicator was designed with Cryptocurrency in mind, it can also be used for Stocks and Forex. I created this for my crypto community as a way to introduce them to trading with indicators.
It should be noted that this indicator should not be considered financial advice in any way or form. This is just an indicator. Please use it responsibly.
PM me to obtain access to this indicator and I will be happy to help you.
BTC & ETH Alert SystemWith Tradingview's free plan, only one alert is allowed. The purpose of this indicator is to allow for two alerts--one for BTC and one for ETH.
How to use the alert system:
1. Set the desired value for BTC and ETH that you want to be alerted for
2. Set an alert on the indicator by clicking the three ellipses and then "Add Alert"
3. Set the alert to go off if the value of the indicator is greater than 0.
The example is of BTC using an alert of $10,000 and an alert of ETH at $2,000 (untriggered)
The script can be easily modified to be used for different assets

ELLIPSE: Bidirectional Swing Trading Strategy (Alert Version)This is the alert version of our original script ELLIPSE: Ultimate Bidirectional Swing Trading Strategy.
This release has the same internal algorithm as the ELLIPSE Strategy script. But instead of showing back test results, this script provides the functionality to add alerts that can notify the user via email / pop-up / sms / app once a signal is given! You must manually add these alerts via TradingView. If you need help setting up these alerts, feel free to ask in the comment box or send us a dm.
***The script is invite-only, message us to get script access***
-------------------------------------------------------------------------------------------------
User Guidelines:
The trading strategy was designed and optimized for trading cryptocurrencies only ; furthermore it works best on established cryptocurrencies that have a clear historical trend such as:
BTCUSD
ETHUSD
LTCUSD
XRPUSD
ADAUSD
The trading strategy is based on swing trading methodology. The script must therefore be used on 4h candles only .
Use USD trading pairs only (e.g. use ETHUSD instead of the ETHBTC) since the individual trend is captured more effectively and therefore gives better results.
The trading strategy is bidirectional , both long and short entries are generated.
-------------------------------------------------------------------------------------------------
Indicators used in this strategy:
Ichimoku Cloud ; acts as the leading indicator.
Volume ; without strong volume , a market move is not valid.
MACD and Vortex ; both being used as confirmation indicators.
Choppiness index ; avoids trading in choppy markets.
Simple and Exponential Moving Averages ; prevents trading against the trend.
The trading strategy is easy to use, bidirectional, trend based and without repainting, meaning once a signal has been made it is permanent and that no future data is used in the decision making. It detects the trend and filters out market noise based on more than 10 technical indicators. ONLY when all indicators align with each other the algorithm prints a LONG or SHORT signal. The trading strategy provides high probability trading signals and minimizes risk! This script aims to capture the profit from short to medium trending moves and by doing so filters out non-substantial trends and avoids the associated risks with these trades.
-------------------------------------------------------------------------------------------------
Features:
NO Repaint once candle is closed.
Stop loss feature ; set your own stop loss to manage your risks.
Customizable Display for the Ichimoku cloud indicator display.
Bidirectional ; both long and short trading positions can be enabled.
Full backtest feature ; Easily generate your own backtest results for each asset (Strategy Version Script).
Alerts ; Get notified via email / pop-up / sms / app once a signal is given! (Alert Version Script).
-------------------------------------------------------------------------------------------------
Backtest results
Below are the back test results. Only well established cryptocurrencies are displayed with a clear historical trend.
Back test results: (long and short trades, signal to signal, order size: 100% of equity, commision fee 0.1%, period: start of chart)
Exchange-----Asset---------Timeframe---Percent Profitable----Profit Factor-----Total Trades----Max Drawdown---Average bars in trade-----Net Profit
Bínance------BTCUSDT---------4H-----------------54.4---------------3.37-------------------57----------------14.9---------------------38------------------1978
Bínance------ETHUSD----------4H-----------------50.9---------------3.48------------------- 57---------------26.8----------------------37------------------3953
Bínance------LTCUSD-----------4H-----------------61.0---------------3.15-------------------59----------------20.9---------------------33------------------3098
Bínance------XRPUSD----------4H-----------------43.1---------------2.44--------------------51---------------22.4----------------------26------------------1226
Bínance------ADAUSD----------4H-----------------57.5---------------3.47--------------------47---------------34.7----------------------35------------------1233
-------------------------------------------------------------------------------------------------
Reminder: Use this trading strategy at your own risk and trade responsibly. We are not responsible for any financial loss using this strategy.
***The script is invite-only, message us to get script access***

The MATRIX: Ultimate Crypto Position Strategy (Alert Version)Welcome back everyone,
It's been a while since our last post. In recent months we have worked on all kinds of projects, but more on that later. In the meantime, we also received a lot of positive feedback about our original 'The MATRIX: Ultimate Crypto Position Strategy' script.
One of the many requests was whether we could release an alert version.
However, since Pinescript does not provide the alert functionality in a strategy type script, it had to be converted to a study type script. Besides that, we have also added a stop-loss functionality. This release has the same internal algorithm as the original 'The MATRIX: Ultimate Crypto Position Strategy' script. But instead of showing back test results, this script provides the functionality to add alerts that can notify the user via email / pop-up / sms / app once a signal is given! You must manually add these alerts via TradingView. If you need help setting up these alerts, feel free to ask in the comment box or send us a dm.
***The script is invite-only, message us to get script access***
-------------------------------------------------------------------------------------------------
The MATRIX: Ultimate Crypto Position Strategy should be used as follows:
• The trading strategy was designed and optimized for trading cryptocurrencies only ; furthermore it works best on established high market cap cryptocurrencies that have a clear trend such as:
BTCUSD
ETHUSD
LTCUSD
XRMUSD
EOSUSD
ADAUSD
DASHUSD
ETCUSD
• The trading strategy is based on swing/position methodology. The script must therefore be used on daily timeframe candles only (1D).
• Use USD trading pairs only (e.g. use ETHUSD instead of the ETHBTC) since the individual trend is captured more effectively and therefore gives better results.
-------------------------------------------------------------------------------------------------
The MATRIX:Ultimate Crypto Position Strategy is based on the following indicators:
• Ichimoku Cloud ; acts as the leading indicator.
• Volume ; without strong volume , a market move is not valid.
• MACD and Vortex ; both being used as confirmation indicators.
• Choppiness index ; avoids trading in choppy markets.
• Bullish/ Bearish Regular Divergences in combination with RSI to spot tops and bottoms.
• Simple and Exponential Moving Averages ; prêvents trading against the trend.
The trading strategy is easy to use, trend based and without repainting, meaning once a signal has been made it is permanent and that no future data is used in the decision making. It detects the trend and filters out market noise based on more than 10 technical indicators. ONLY when all indicators align with each other the algorithm prints a BUY or SELL signal. The trading strategy provides high probability trading signals and minimizes risk! This script aims to capture the profit from longer term trending moves and by doing so filters out non-substantial trends and avoids the associated risks with these trades.
-------------------------------------------------------------------------------------------------
The MATRIX: Ultimate Crypto Position Strategy has the following features:
• ALERTS can be enabled which can notify the user through email/popup/app once a signal is given.
• Automatically generated Buy / Sell alerts in the form of a label.
• NO Repaint once candle is closed.
• SAFEGUARD ; custom built-in security prevẹnts trading when the price is out of equilibrium.
• Customizable Display for the Ichimoku cloud indicator display.
-------------------------------------------------------------------------------------------------
Reminder: Use this trading strategy at your own risk and trade responsibly. We are not responsible for any financial loss using this strategy.
***The script is invite-only, message us to get script access***

Truenomic's Universal BTC and ETH VolumeA simple indicator to display the total volume of BTC or ETH from different exchanges. The difference between this indicator and others is the ability to see the total volume in BTC or ETH (not USD) from all exchanges simultaneously, including derivative ones.
Spot Exchanges:
Binance;
Coinbase;
Kraken;
Gemini;
Bitfinex;
Bitstamp;
Derivatives Exchanges:
Bitmex;
Okex;
Deribit;
FTX;
Binance;
This list is relevant only at the time of publication, stay tuned for further indicator updates!

CONSOL SPOT ETHEREUM OBVConsolidated OBV for ETH Cross the below exchange volume also has built-in divergences.
BITSTAMP:ETHUSD
COINBASE:ETHUSD
COINBASE:ETHEUR
COINBASE:ETHUSDC
COINBASE:ETHGBP
BINANCE:ETHUSDT
BINANCE:ETHUSDC
BINANCE:ETHPAX
BITFINEX:ETHUSD
KRAKEN:ETHUSD
KRAKEN:ETHEUR