Event Marking [zidaniee]This is not a technical analysis indicator, but a visual tool designed to mark important global events using vertical lines on your chart.
By placing a single marker at the exact time an event occurred, you can compare how different assets reacted to that global event — before, during, and after it happened.
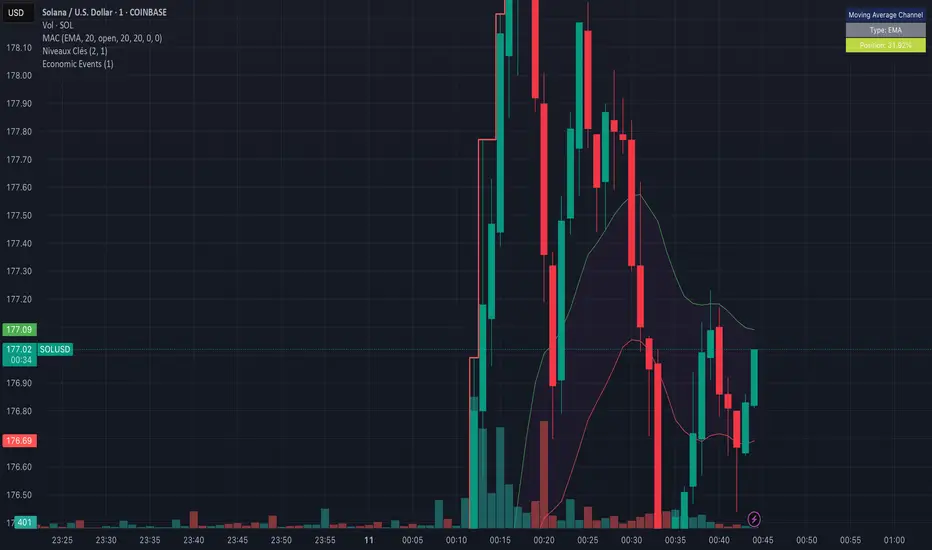
In the example provided, the marking corresponds to the moment when U.S. President Donald Trump announced a 100% tariff on goods from China, which was immediately reflected in market reactions worldwide.
The indicator includes full customization features for:
• Event label text
• Label size and position
• Line color, style, and width
Enjoy
Event

Economic Event DatesThis TradingView indicator ("Economic Event Dates") plots significant economic event dates directly on your chart, helping you stay informed about potential market-moving announcements. It includes pre-configured dates for:
* **FOMC Meetings:** Key policy meetings of the Federal Open Market Committee.
* **CPI Releases:** Consumer Price Index data releases, a key measure of inflation.
* **Bitcoin Halvings:** Programmatic reductions in Bitcoin's new supply issuance.
**Features:**
* **Customizable Dates:** Easily input and manage dates for FOMC, CPI, and Halving events for current and future years (2025, 2026, and beyond for Halvings).
* **Visual Cues:** Displays vertical lines on the chart at the precise time of each event.
* **Event Labels:** Shows clear labels (e.g., "FOMC", "CPI", "Halving") for each event line.
* **Color Coding:** Distinct colors for FOMC (blue), CPI (orange), and Halving (purple) events for quick identification.
* **Future Events Focus:** Option to display only upcoming events relative to the current real time.
* **Morning Alerts:** (Optional) Triggers an alert on the morning of a scheduled event, providing a timely reminder.
* **Customizable Appearance:** Adjust line width and toggle label visibility.
**How to Use:**
1. Add the indicator to your TradingView chart.
2. Review and update the input dates for FOMC, CPI, and Halving events in the indicator settings. The script includes placeholders and notes for future dates that may require verification from official sources (e.g., federalreserve.gov, bls.gov).
3. Customize colors, line width, label visibility, and alert preferences as needed.
4. Observe the vertical lines on your chart indicating upcoming economic events.
This tool is designed for traders and investors who want to incorporate awareness of major economic events into their market analysis. Remember to verify future event dates as they are officially announced.
Created by YouNesta
Function - Entropy Gini Indexfunction to retrieve Gini Impurity / Gini Index.
reference:
- victorzhou.com
- en.wikipedia.org

test - event distributiondisplays the distribution of the outcome of a event over the last event.
similar to this script:
