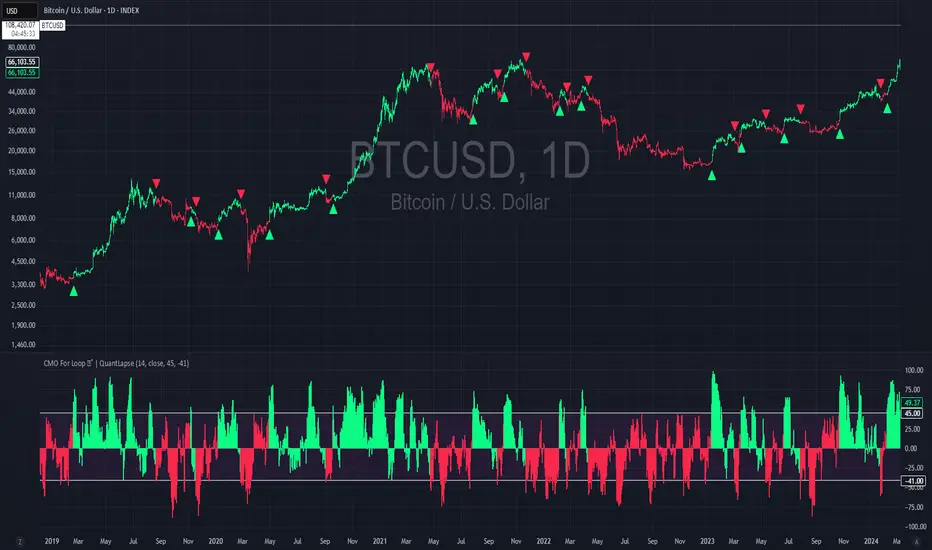
CMO For Loop | QuantLapseCMO For Loop Indicator
The CMO For Loop indicator, inspired by Alex Orekhov's, "Chande Momentum Oscillator," and indicator originally made by Tushar Chande, the CMO designed as a fast and responsive tool to capture quick price movements in financial markets. This oscillator leverages Momentum to measure price deviations, providing a concise yet powerful framework for identifying potential trade entry and exit points. What makes this
"enhanced" CMO indicator special is its ability to identify trending periods more accurately. By using thresholds, this allows the script to enter accurate long and short conditions extremely quickly.
Intended Uses:
Used to capture long-term trends:
Used to identify quick reversals:
Recommended Uses
Best suited for higher timeframes (8H+) to improve accuracy of signals.
Designed for strategies that require fast entries and exits.
Can also be applied to scalping approaches.
Not Recommended For
Should not be used as a mean reversion tool.
Should not be interpreted as a valuation indicator (overbought/oversold levels).
Key Features
Rapid Market Reaction
Built to prioritize speed over smoothing, making it ideal for traders who want to take advantage of quick price shifts in trending or highly volatile markets.
Flexible Thresholds
Users can customize the upper and lower CMO levels to trigger long or short conditions, allowing the indicator to adapt to different assets and trading styles.
Embracing the Noise
Signals may appear frequently, but this is intentional. The tool is optimized for traders who thrive on fast rotations, using the “noise” to catch short-lived yet impactful moves.
Clear Visual Feedback
Plots key oscillator levels and provides dynamic, color-coded candles and shapes that make it easy to identify bias and react quickly.
How It Works
Oscillator Calculation
The CMO (Chande Momentum Oscillator) is derived from comparing the source price’s deviations relative to its momentum. This approach emphasizes trend-driven price shifts.
Signal Triggers
When the oscillator rises above the upper threshold, a long bias is triggered and remains until the CMO drops below the lower threshold.
When the oscillator falls below the lower threshold, a short bias is triggered and remains until the CMO crosses back above the upper threshold.
No bias is active when the oscillator is between thresholds.
Visual Signals
Green candles = long bias
Red candles = short bias
Gray candles = neutral/no signal
Triangles mark points of change in signal direction.
Everget
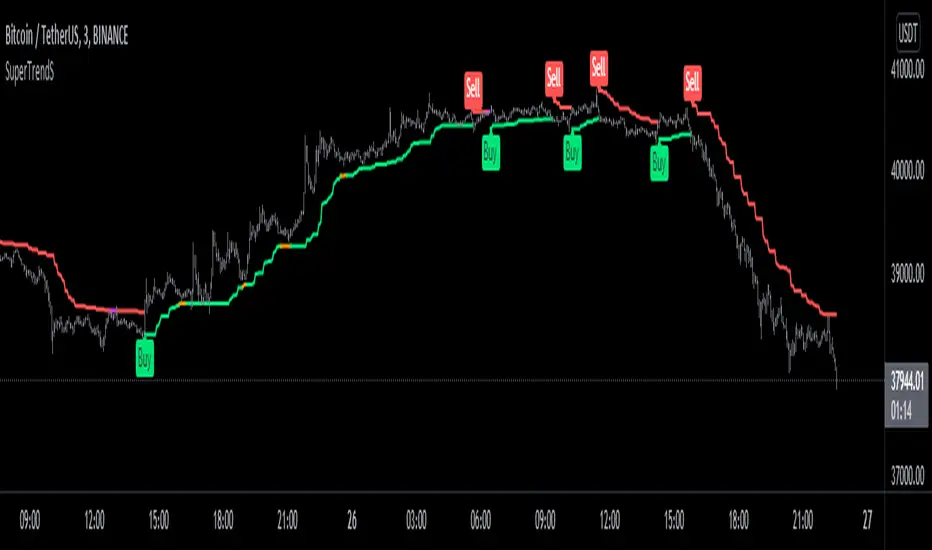
SuperTrendSHey! By using this script you can choose between the Regular SuperTrend and Pivot Point SuperTrend.
Pivot Point SuperTrend differs in calculation from the regular SuperTrend and as the name suggests, Pivot Points are used instead of ATR.
I made this script to make it easier to switch and compare between one another.
Also included Jurik RSX as a Momentum Indicator. SuperTrend changes color to purple when it's a bear trend and RSX is in an overbought state. And orange when it's a bull trend and RSX is in an oversold state. A reversal might be expected when color changes to purple & orange occur.
Special thanks to;
Kivanc Ozbilgic for SuperTrend
LonesomeTheBlue for Pivot Point SuperTrend
& everget for Jurik RSX
Enjoy!
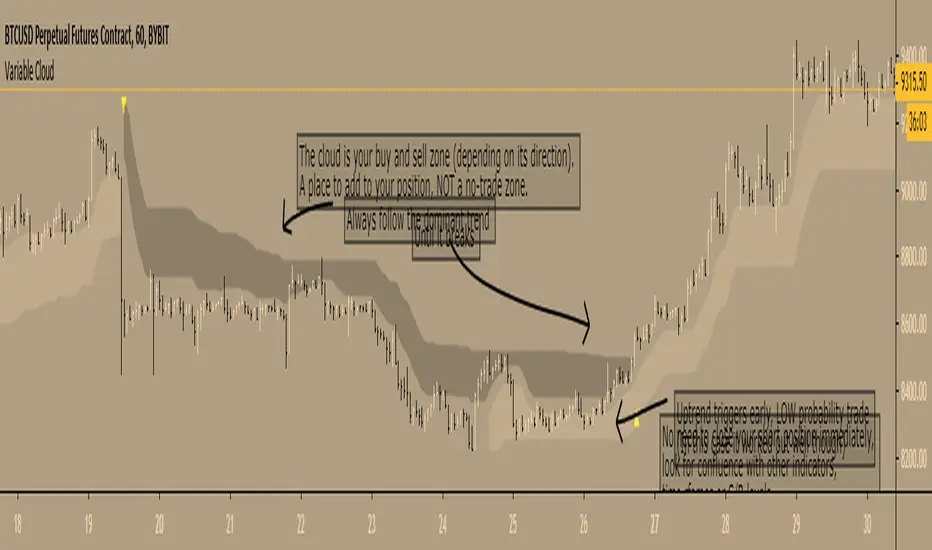
Variable Cloud - evoA Super Trend based on the high and low of a Moving Average, to get an easy view what the current trend is and where to buy and sell.
TIPS
- The 'Closing Source' option is the candle value that triggers the clouds. 'High/Low System' means that a downtrend is over when the candle LOW closes greater than the downtrend (dark cloud), an uptrend is over when the candle HIGH closes less than the uptrend (light cloud). The other options speak for themselves.
- Ideally place your stop loss outside the cloud, as you want to stay in the trend until it breaks to the opposite direction (but that's up to you of course).
- Reversal trades are low probability, you can see them as reversals or ranging before the market continues, I like to lower my risk on those set ups till it breaks the dominant trend.
Here are the scripts I used:
Everget's SuperTrend
LazyBear's VMA
Thanks LazyBear and Everget, I learn a lot from your scripts :)
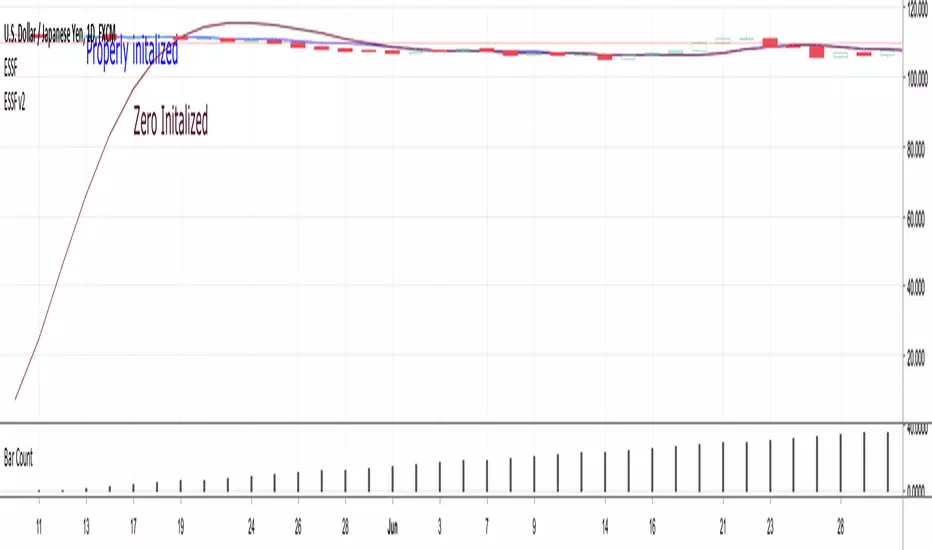
Ehler's Super Smoother 2 and 3 pole (properly initialized)John Ehlers' Super Smoother 2 and 3 pole - properly initialized
www.stockspotter.com
Failure to properly initialize early values of the super smoother will result in misleading values early in the output.
Because the SS is an IIR ( infinite impulse response) filter, this error can ring in the filter for a long time, but
is extremely evident in the first 2*len bars.
This is an implementation if the 2 and 3 pole SS filter, with special attention to initializing the early values.
It uses (src+scr)/2 per Ehlers but contains code to just use src if you prefer to calculate that outside
the function as everget does in his SS here:
there is code included to make that change.
Many thanks to everget for his terrific implementations of much of John Ehlers' work. It has been tremendously helpful to me.
Kendall Rank Correlation CoefficientKendall Rank Correlation Coefficient script.
This way to measure the ordinal association between two measured quantities described by Maurice Kendall (1938, Biometrika, 30 (1–2): 81–89, "A New Measure of Rank Correlation").
In this script I compare Kendall Coefficient and Pearson Coefficient (using built-in "correlation" function).

Interquartile Range BandsInterquartile Range Bands script.
This indicator was originally developed by Alex Orekhov at his home.
The idea based on the interquartile range en.wikipedia.org
If price breaks out from the bands then it is `outlier` price.
After breakouts price always returns to its median.
Watch squeeze/expansion periods.
Anyway use it as a supplement to the other indicators.
I will glad to get your feedback.
