Buy & Sell Order (Expo)
Buy/Sell Order (Expo) is a unique and important indicator that provides information about Buy & Sell order patterns. The indicator helps to identify real-time large Buy & Sell Orders that have a significant impact on the price. These buy and sell orders can be the start of a trend move or a sign of reversal.
The indicator is divided into a Sell-side (red zone) and a Buy-side (green zone) in order to highlight the different order flows. Greater candlesticks mean significant buy/sell orders! These are the ones we want to keep track of.
The price levels where a large Buy or Sell order occurs at should be considered as key levels. These key- levels are often re-tested in the future. Traders should keep track of them.
Real-Time
No Repainting
Works on any market and in any timeframe
HOW TO USE
Identify Large Buy / Sell Order
Identify potential trend move
Identify potential reversal
INDICATOR IN ACTION
1-hour chart
I hope you find this indicator useful , and please comment or contact me if you like the script or have any questions/suggestions for future improvements. Thanks!
I will continually work on this indicator, so please share your experience and feedback as it will enable me to make even better improvements. Thanks to everyone that has already contacted me regarding my scripts. Your feedback is valuable for future developments!
-----------------
Disclaimer
Copyright by Zeiierman.
The information contained in my scripts/indicators/ideas does not constitute financial advice or a solicitation to buy or sell any securities of any type. I will not accept liability for any loss or damage, including without limitation any loss of profit, which may arise directly or indirectly from the use of or reliance on such information.
All investments involve risk, and the past performance of a security, industry, sector, market, financial product, trading strategy, or individual’s trading does not guarantee future results or returns. Investors are fully responsible for any investment decisions they make. Such decisions should be based solely on an evaluation of their financial circumstances, investment objectives, risk tolerance, and liquidity needs.
My scripts/indicators/strategies/ideas are only for educational purposes!
ACCESS THE INDICATOR
• Contact me on TradingView or use the links below
EXPO

ATR Trend & ATR Top/Bottom (Zeiierman)█ Overview
ATR Trend & ATR Top/Bottom (Zeiierman) blends momentum, volatility, and adaptive trend analysis into a unified framework. It fuses a dynamic oscillator with ATR-based exhaustion detection to identify trend direction, impulses, and potential reversals within the same structure.
Rather than viewing volatility as noise, this tool interprets it as trend expansion, which represents directional conviction, while contraction signals absorption or exhaustion. By combining multi-phase smoothing, adaptive ATR scaling, and contextual trend filtering, the indicator delivers a complete picture of when a market is accelerating, stabilizing, or reversing.
It performs best once a trend has matured and volatility normalizes around a directional core, giving traders the confidence to participate in established moves while dynamically managing risk.
⚪ Why This One Is Unique
Traditional trend oscillators rely on fixed parameters that degrade across assets or timeframes. ATR Trend & ATR Top/Bottom instead employs adaptive weighting and volatility-normalized filtering that automatically aligns with the current market structure.
Its framework integrates three distinct components:
Adaptive Oscillator Core that reveals the internal rhythm of trend and momentum.
ATR Top/Bottom Layer that marks exhaustion and potential turning zones.
Trend Signal & Dynamic Trailing Stop Engine that highlights directional shifts, confirms alignment with the prevailing trend, and transforms trend data into a self-adjusting risk-management system.
█ Main Features
⚪ ATR Trend (The Main Oscillator)
The ATR Trend serves as the indicator’s primary oscillator, translating price and volatility dynamics into a smooth directional curve. When the oscillator line remains above its equilibrium, bullish momentum dominates; when it stays below, bearish momentum prevails. Color transitions reflect real-time trend bias, helping traders immediately recognize whether the market is strengthening or weakening.
This component forms the structural core of the tool, defining overall trend direction, momentum intensity, and transition zones.
It also visualizes trend expansion through the fast leading signal line. When this line crosses above the upper or below the lower boundary, it signals an expansive move within the active trend, often representing short-term overbought or oversold conditions, and can also indicate trend strength in the prevailing market direction.
⚪ ATR Top/Bottom
The ATR Top/Bottom layer highlights potential exhaustion zones within the trend. Green peaks reveal areas of buy-side saturation, suggesting a possible slowdown or reversal in bullish momentum, while red peaks mark sell-side extremes, often appearing before stabilization or renewed strength. These zones help traders identify when a move is becoming stretched or losing balance, offering valuable context for managing exits, scaling out, or anticipating reversals. However, these areas can extend for a prolonged period when price is in a strong, sustained trend, reflecting persistent directional pressure rather than immediate exhaustion.
⚪ Trend Channel Hits
The Trend Channel Hits feature visualizes moments when the price interacts with the projected internal trend channel boundaries of the prevailing trend.
Green arrows appear when the price touches the upper boundary of the trend channel. This can indicate two possible outcomes:
A potential breakout from a negative trend into a developing bullish trend, as price breaks above the upper boundary of the descending channel.
A take-profit zone within an established bullish trend, as price reaches the upper channel where mean reversion is likely to occur.
Red arrows appear when the price touches the lower boundary of the trend channel. This can indicate:
A potential breakout from a positive trend into a developing bearish trend, as price breaks below the lower boundary of the rising channel.
A take-profit opportunity within an established bearish trend, as price reaches the lower channel where mean reversion or short-term recovery is likely to occur.
These signals provide early visual confirmation of trend exhaustion, continuation, or structural breakout, helping traders refine entries, exits, and profit-taking within the broader market context.
█ How to Use
⚪ Trend Following
When the oscillator line remains above the mid-level, the market is in a bullish phase. When it stays below the mid-level, the trend is bearish. Periods where the oscillator holds close to its upper or lower limits indicate strong, sustained momentum in that direction. Watch for color changes or crossovers near the mid-level, as these often signal an upcoming shift in trend control.
Bullish Trend
Bearish Trend
⚪ Trend Signals
To help traders identify and participate in trend trades, the indicator includes pre-built Trend Signals that highlight optimal entry conditions within confirmed market trends. These signals are designed to activate only once the market shows established directional momentum, ensuring higher reliability and filtering out noise from short-term fluctuations.
In addition, the indicator includes built-in take-profit markers for each signal. These serve as suggested partial exit levels, helping traders systematically secure profits while allowing the remaining position to follow the trend with the dynamic trailing stop.
Before relying on the signals, always confirm that the market has been trending for a sustained period. This ensures that entries align with genuine long-term directional strength rather than temporary volatility.
Bullish Trend Signals
Bullish Trend Signals appear during an established uptrend when the indicator detects confirmed positive momentum and stable directional structure. These signals mark potential continuation points where buyers regain control after short-term pauses or pullbacks.
The objective is to follow the trend signals, manage trades with the dynamic trailing stop, and consider taking partial profits at the inbuilt take-profit levels plotted by the indicator.
This setup works best when the market is trending clearly upward and has demonstrated consistent buying strength over time.
Bearish Trend Signals
Bearish Trend Signals occur during a confirmed downtrend, indicating that selling momentum remains dominant and the trend structure is intact. They typically appear after short-term corrective rallies, signaling that sellers are reasserting control within the broader bearish environment.
As with bullish signals, the goal is to follow the trend signals and trailing stop to capture sustained downside movement, while using the inbuilt take-profit levels to lock in partial gains as the move progresses. This approach performs best when the market is in a clear, mature downtrend with persistent selling pressure and expanding downside momentum.
⚪ Trend Impulses
Impulses represent short bursts of directional acceleration within the active trend.
A surge above the upper band reflects bullish expansion.
A move below the lower band marks bearish acceleration.
These impulses often precede short consolidations before the trend resumes. Traders can use them to scale into strong phases or take partial profits at temporary extremes.
⚪ Reversals
Enable ATR Top/Bottom to monitor momentum peaks:
Red peaks show strong selling momentum. When these peaks start to fade, it can signal that selling pressure is weakening and a potential recovery may be forming.
Green peaks show strong buying momentum. As their size shrinks, it may signal that buying pressure is slowing, and a possible pullback or reversal could follow.
⚪ Extended Trends
For traders who want to visualize intense, extended trend phases, enable the ATR Top/Bottom feature and increase the Length setting to around 30, with Sensitivity set between 40 and 50. Consider reducing the ATR Trend Length to 50 to gain clearer signals of when a trend begins and ends.
This configuration extends the ATR Top/Bottom zones across the entire duration of a major trend, making it easier to identify sustained directional strength and long-lasting momentum phases.
█ How It Works
⚪ Adaptive Oscillator Engine
The oscillator interprets directional flow through a combination of momentum mapping and volatility weighting. It continuously re-centers its equilibrium to reflect evolving market structure, producing a stable yet responsive representation of underlying trend force.
Calculation: Applies multi-domain smoothing and adaptive normalization to align amplitude with volatility while maintaining directional coherence.
⚪ ATR Top/Bottom Detection
The exhaustion layer isolates high-magnitude deviations from the current volatility envelope, identifying potential top and bottom regions where expansion may stall.
Calculation: Uses proportional volatility thresholds and dynamic range modeling to highlight statistically elevated momentum extremes without over-reacting to noise.
-----------------
Disclaimer
The content provided in my scripts, indicators, ideas, algorithms, and systems is for educational and informational purposes only. It does not constitute financial advice, investment recommendations, or a solicitation to buy or sell any financial instruments. I will not accept liability for any loss or damage, including without limitation any loss of profit, which may arise directly or indirectly from the use of or reliance on such information.
All investments involve risk, and the past performance of a security, industry, sector, market, financial product, trading strategy, backtest, or individual's trading does not guarantee future results or returns. Investors are fully responsible for any investment decisions they make. Such decisions should be based solely on an evaluation of their financial circumstances, investment objectives, risk tolerance, and liquidity needs.
Paid script

Range & Trend (Zeiierman)█ Overview
Range & Trend (Zeiierman) is a trend-first mapping of price that fuses an adaptive Range & Trend Line, a Trend Buffer (noise gate), a volatility-aware Trend Tracker, and optional Range Levels & Candles to reveal where trend is establishing, compressing, or handing off to a ranged regime.
Execution is guided by graded Buy/Sell labels (Regular / Plus / Strong), structural HH/HL & LL/LH markers with optional Peak Profit readouts, and a multi-TF Timeframe Scanner for alignment.
⚪ Why This One Is Unique
Unlike single-source trend lines, this version layers two orthogonal stabilizers:
a Range & Trend core that adapts its band size to volatility and dispersion, and
a dynamic smoothing buffer that dampens insignificant fluctuations, ensuring only meaningful trend movements affect signal output.
Signals are graded (Regular / Plus / Strong) based on contextual conditions, allowing traders to gauge the conviction behind each trend event. Range Candles add regime context by coloring bars only when a statistically consistent range structure forms, highlighting potential consolidation or transitional market phases. A lightweight Timeframe Scanner completes the workflow, broadcasting alignment from intraday to daily without adding chart clutter.
█ Main features
⚪ Range & Trend Line – Signal Generator
Adaptive directional mapping forms the foundation of the system. It highlights the active trend through color transitions and generates graded Buy/Sell labels (Regular / Plus / Strong) to reflect the strength of confirmation. The line responds dynamically to volatility, revealing when momentum is expanding, stabilizing, or reversing.
Unlike typical reactive signal tools, this model isolates only the most strong and meaningful trend transitions — those with the structural weight to establish or extend a new long-term directional phase. Each signal represents a filtered, high-conviction shift rather than a short-term fluctuation.
⚪ Trend Buffer (Noise Gate)
A precision filter that smooths the core trend output and suppresses false flips caused by short-term noise. It enhances visual consistency and provides the confirmation layer used to promote Regular signals to Plus strength when agreement occurs between buffer and core.
⚪ Trend Tracker
A trailing validation line that tracks directional health and trend persistence. It advances only in the direction of the active move, creating an adaptive stop-like reference. Tracker alignment helps identify trend exhaustion and contributes to Strong-grade signal confirmation.
⚪ Range Levels & Candles
Contextual zones that identify periods of compression or balance. When a valid range forms, candles are shaded within it, distinguishing ranging environments from trending conditions. These zones help anticipate breakouts and define natural support and resistance areas.
⚪ Live Structure (HH/HL & LL/LH with Peak Profit)
Displays real-time structural evolution — Higher Highs/Lows during uptrends and Lower Highs/Lows during downtrends. The optional Peak Profit label shows performance since the last regime change, offering an immediate view of current trend efficiency.
⚪ Timeframe Scanner
A compact multi-timeframe alignment panel that visualizes bullish or bearish trend states across user-selected intervals. It provides fast confirmation of directional consensus, helping traders act only when the broader structure supports their chosen bias.
█ How to Use
⚪ Range & Trend Line – Signal Generator
The Range & Trend Line is the core signal engine — its color shifts mark confirmed directional changes. This is where the system produces the graded Buy/Sell signals shown as ▲ / ▼ labels. Each grade reflects how many internal layers agree at the moment of signal creation:
Regular (▲ / ▼) – Triggered by a confirmed flip in the Range & Trend core. It appears when the base trend direction changes and is the earliest signal of potential reversal.
Plus (▲ + / ▼ +) – Requires the Trend Buffer to confirm the same direction. This upgrade indicates stronger trend agreement and higher reliability.
Strong (▲ ++ / ▼ ++) – These are high-conviction continuation signals and typically occur after structural confirmation.
How to trade them: Regular signals provide early awareness; Plus signals suggest confirmation; Strong signals mark trend maturity or high-probability continuations. Always trade in the direction of the prevailing trend. Use the Trend Buffer or Live Structure to confirm the dominant directional bias before acting on a signal.
⚪ Support and Resistance
The Range & Trend Line and the Buffer Line can act as dynamic support and resistance zones. Price often reacts around these levels, confirming whether the current move is continuing or losing strength.
Look for confirmation or rejection signals near these lines. Reactions around them often mark key decision points within the active trend.
⚪ Range Levels & Candles
Highlights when price enters structured consolidation zones. Candle coloring activates only inside validated ranges, helping to identify areas that show the typical characteristics of a ranging market. These zones visually separate balanced conditions from active trends and provide context for potential transitions.
Watch how price reacts around the upper and lower range levels. Look for false or confirmed breakouts, and expect price to move between these boundaries until a clear breakout develops. Range edges can also serve as practical entry or stop zones.
█ How It Works
⚪ Range & Trend Core
The main engine that defines the chart’s directional trend line. It adapts to changing market conditions, showing a smooth and reliable view of trend strength and direction.
Calculation: Builds a range-adaptive structure whose width adjusts with current volatility. The core moves toward new highs or lows but limits pullbacks to avoid false shifts. Several smoothing methods work together to create a steady, low-lag trend path.
⚪ Trend Buffer (Noise Gate)
A stabilizing layer that keeps the main trend line steady when price noise increases. It improves visual clarity and helps confirm true direction before a trend update appears.
Calculation: Uses a feedback-based update that reacts more when movement is strong and less when noise dominates. This lets the buffer ignore minor fluctuations while staying responsive to real trend changes.
⚪ Trend Tracker
A support line that follows the main move and helps confirm when a trend remains intact. It also serves as a guide for managing active positions.
Calculation: Applies a one-way trailing system that only moves in the direction of the trend. The offset adjusts with volatility, keeping a consistent distance that tightens or widens with market energy.
⚪ Buy/Sell Signal Engine (Regular / Plus / Strong)
The signal system that classifies entries by strength and confirmation level. It reacts to real-time trend changes while filtering weak reversals.
Calculation: Detects state flips in the Range & Trend Core, checks for agreement with the buffer, and rates each signal by historical pattern support. Higher-grade signals appear only when several layers confirm continuation strength.
⚪ Range Levels & Candles
Identifies short-term balance zones and highlights candles within those areas. These zones show where price pauses before the next directional move.
Calculation: Finds upper and lower range limits based on recent highs and lows, confirming only when several bars form a stable zone. Candle colors and level lines extend slightly forward to show likely reaction areas.
⚪ Swing Points & Peak Profit
Marks key turning points and measures performance since the last reversal. It helps track the strength and duration of each movement.
Calculation: Keeps a short memory of recent pivots and updates only when a new high or low replaces the last one. The percent distance from the last flip to the current bar defines the live Peak Profit reading.
⚪ Timeframe Scanner & Alert Aggregator
Combines directional data from multiple timeframes into a single view. Alerts trigger only when all selected timeframes agree.
Calculation: Gathers the trend state from each timeframe, converts it to a simple up or down value, and compares the results. When every layer matches your chosen direction, one clear, high-confidence alert is sent.
-----------------
Disclaimer
The content provided in my scripts, indicators, ideas, algorithms, and systems is for educational and informational purposes only. It does not constitute financial advice, investment recommendations, or a solicitation to buy or sell any financial instruments. I will not accept liability for any loss or damage, including without limitation any loss of profit, which may arise directly or indirectly from the use of or reliance on such information.
All investments involve risk, and the past performance of a security, industry, sector, market, financial product, trading strategy, backtest, or individual's trading does not guarantee future results or returns. Investors are fully responsible for any investment decisions they make. Such decisions should be based solely on an evaluation of their financial circumstances, investment objectives, risk tolerance, and liquidity needs.
Paid script

Trend Average (Expo)
Trend Average (Expo) measures the overall trend strength and how strong the current price move/momentum is. The color of the average helps to identify the strength and momentum of the trend.
The user can enable Bar Color that coloring the candlesticks based on the trend strength.
The user can choose between different average calculations, such as SMA, WMA, HMA, to mention a few.
This indicator is for those that don't want to have the Trend Oscillator (Expo) but still want to keep track of the trend strength and direction. There is a minor difference in how the trend is calculated due to the nature of input variables.
HOW TO USE
Identify the trend strength and direction
Identify current momentum
INDICATOR IN ACTION
Daily chart
I hope you find this indicator useful , and please comment or contact me if you like the script or have any questions/suggestions for future improvements. Thanks!
I will continually work on this indicator, so please share your experience and feedback as it will enable me to make even better improvements. Thanks to everyone that has already contacted me regarding my scripts. Your feedback is valuable for future developments!
-----------------
Disclaimer
Copyright by Zeiierman.
The information contained in my scripts/indicators/ideas does not constitute financial advice or a solicitation to buy or sell any securities of any type. I will not accept liability for any loss or damage, including without limitation any loss of profit, which may arise directly or indirectly from the use of or reliance on such information.
All investments involve risk, and the past performance of a security, industry, sector, market, financial product, trading strategy, or individual’s trading does not guarantee future results or returns. Investors are fully responsible for any investment decisions they make. Such decisions should be based solely on an evaluation of their financial circumstances, investment objectives, risk tolerance, and liquidity needs.
My scripts/indicators/strategies/ideas are only for educational purposes!
ACCESS THE INDICATOR
• Contact me on TradingView or use the links below

Trend Oscillator (Expo)Trend Oscillator (Expo) measures the overall trend strength and how strong the current price move/momentum is. The indicator is leading since it can signal a possible trend change that is yet to start. The color of the histogram and its value helps to gauge the strength and momentum of the trend.
The user can enable Bar Color that coloring the candlesticks based on the trend strength.
The user can choose between different trend calculations, such as smoothed trend, volume-weighted trend, a non-lagging trend, to mentions a few.
DIVERGENCES
All types of oscillators produce divergences and so does Trend Oscillator (Expo). Divergences occur when the oscillator deviates from the trending price action. Bullish divergence is then when the trending price makes a lower low but the oscillator makes a higher low. Bearish divergence is then when the trending price makes a higher high but the oscillator makes a lower high.
HOW TO USE
Identify the trend strength and direction
Identify current momentum
Identify potential trend reversals
Identify Overbought and Oversold areas
INDICATOR IN ACTION
1 min chart
I hope you find this indicator useful , and please comment or contact me if you like the script or have any questions/suggestions for future improvements. Thanks!
I will continually work on this indicator, so please share your experience and feedback as it will enable me to make even better improvements. Thanks to everyone that has already contacted me regarding my scripts. Your feedback is valuable for future developments!
-----------------
Disclaimer
Copyright by Zeiierman.
The information contained in my scripts/indicators/ideas does not constitute financial advice or a solicitation to buy or sell any securities of any type. I will not accept liability for any loss or damage, including without limitation any loss of profit, which may arise directly or indirectly from the use of or reliance on such information.
All investments involve risk, and the past performance of a security, industry, sector, market, financial product, trading strategy, or individual’s trading does not guarantee future results or returns. Investors are fully responsible for any investment decisions they make. Such decisions should be based solely on an evaluation of their financial circumstances, investment objectives, risk tolerance, and liquidity needs.
My scripts/indicators/strategies/ideas are only for educational purposes!
ACCESS THE INDICATOR
• Contact me on TradingView or use the links below

Trend Algo (Zeiierman)█ Overview
Trend Algo (Zeiierman) converts raw price movement into a cohesive, volatility-aware trend map. Rather than static moving averages, it builds an adaptive trend core that responds to market state changes, then layers regime-sensitive clouds (Infinite Sky) and horizon-bounded channels (HorizonX), plus precise trend-change and continuation signals. The result is a clean framework for reading direction, timing pullbacks, and validating momentum.
The indicator visualizes the active trend line, adaptive clouds, and stateful signals to reveal transition zones, trend acceleration, and exhaustion. It suits intraday execution, swing confirmations, and structural regime assessment.
⚪ Why This One Is Unique
Unlike conventional trend tools, this version combines volatility-normalized trend estimation, AI-style regime clustering, and horizon-bounded support/resistance channels. Its framework uses multi-phase smoothing, adaptive width scaling, and state detection that aligns entries and continuations with current market inertia—reducing whipsaw while preserving responsiveness.
█ Main features
⚪ Dynamic Clouds
The Dynamic Trend Line provides a stabilized, noise-aware trajectory of price, color-coded by directional bias. Two cloud systems overlay the core trend:
Infinite Sky (AI) — a regime-aware cloud that distinguishes fast vs. slow trend states.
HorizonX — adaptive channels that operate as dynamic support/resistance and define trend boundaries.
⚪ Candle Coloring
The candle coloring is designed to highlight trend momentum peaks, allowing you to instantly recognize when the trend is accelerating or slowing down. This visual feedback makes it easier to interpret the strength and speed of directional moves directly on the chart, seamlessly complementing the Dynamic Trend Line and Cloud systems.
⚪ Trend Change Signals & Trend Continuation Signals
The main signals are the Trend Change Signals , designed to trigger when the current trend structure begins to shift its state. These signals give you an instant sense of when a potential trend reversal or directional change might occur.
To complement them, we’ve added Trend Continuation Signals , which only activate within an established trend. These signals confirm the current direction and indicate that the trend is gaining strength and preparing for another move in the same direction.
⚪ Trend Line
Two types of trend lines are integrated: Stability and Dynamic.
The Stability Line follows the current price action in a smooth, drift-like manner — staying closer to price to act as a faster support and resistance zone.
The Dynamic Line adapts to volatility, ensuring that continuous movements within the trend are taken into account. This helps traders stay aligned with the trend and capture extended moves during periods of higher market activity.
█ How to Use
⚪ Trend Changes
Trend Change Signals appear when the current trend structure begins to shift, signaling a potential reversal or directional transition. These signals help traders anticipate moments when momentum weakens or changes direction, offering early insight into possible turning points in the market. Combine Trend Change Signals with Candle Coloring or Cloud behavior to confirm entries and strengthen trend reversal validation.
⚪ Trend Continuations
Trend Continuation Signals trigger within an established trend, confirming that the current direction remains strong. They often appear after pullbacks or pauses, suggesting that the market is ready for another move in the same direction. These signals work best when paired with the Dynamic Trend Line, allowing traders to stay confidently aligned with powerful ongoing trends.
⚪ Support and Resistance
The Stability Trend Line acts as a reactive support and resistance guide, staying close to price and highlighting areas where market reactions are most likely to occur. It offers traders a clear view of short-term structure and helps identify potential bounce or rejection zones with precision.
The Dynamic Trend Line adapts to volatility, forming flexible support and resistance zones that expand during strong momentum and contract during quieter phases, keeping the visual structure balanced and responsive to changing market conditions.
HorizonX defines the outer adaptive boundaries of the trend. These dynamic channels operate as broader support and resistance frameworks, helping traders anticipate trend exhaustion or continuation zones beyond the immediate price action.
The Infinite Sky (AI) cloud adds a regime-aware layer that distinguishes fast and slow trend states, visually framing the strength of support or resistance regions as they evolve and allowing traders to read both momentum and structure in a single glance.
█ How It Works
⚪ Dynamic Trend Core
A volatility-normalized estimator generates the primary trajectory and color state, balancing stability vs. agility by adapting to dispersion and displacement.
Calculation: Multi-phase weighted smoothing with volatility-scaled adjustments and adaptive phase control to minimize lag while preserving curvature.
⚪ Infinite Sky (AI Regime Cloud)
Differentiates fast vs. slow trend states and paints a regime-aware cloud that guides timing and risk.
Calculation: Windowed return modeling (with optional consolidation), two-pole response filtering, and distribution-center clustering to classify regimes and modulate the envelope.
⚪ HorizonX Trend Channels
Defines dynamic support/resistance “horizons” that expand/contract with conditions and filter counter-trend noise when strong-trend mode is enabled.
Calculation: A volatility-aware core that evolves with changing price dynamics, maintaining precision across all market conditions.
⚪ Trend Line & Continuations
A fast reaction line confirms pullbacks and validates continuation only when aligned with prevailing bias and structure.
Calculation: Short-horizon smoothing with phase-managed weighting, slope/position gating, and context checks against regime and horizon levels.
⚪ Impulse Detection
Identifies statistically meaningful bursts that precede expansion or warn of exhaustion after extended runs.
Calculation: Nonlinear impulse-response mapping emphasizing second-order changes in directional energy while suppressing micro-noise.
⚪ Trend Bands
Upper/lower bands visualize the active envelope for timing adds, trims, or exits within trend.
Calculation: Percentile-guided banding blended with adaptive anchors to retain structural relevance through regime shifts.
⚪ Bar Color Integration
Bars can inherit trend/gradient context to make state shifts obvious at a glance.
Calculation: Algorithmic gradient model integrating directional momentum intensity to render bar coloration in sync with market flow.
-----------------
Disclaimer
The content provided in my scripts, indicators, ideas, algorithms, and systems is for educational and informational purposes only. It does not constitute financial advice, investment recommendations, or a solicitation to buy or sell any financial instruments. I will not accept liability for any loss or damage, including without limitation any loss of profit, which may arise directly or indirectly from the use of or reliance on such information.
All investments involve risk, and the past performance of a security, industry, sector, market, financial product, trading strategy, backtest, or individual's trading does not guarantee future results or returns. Investors are fully responsible for any investment decisions they make. Such decisions should be based solely on an evaluation of their financial circumstances, investment objectives, risk tolerance, and liquidity needs.
Paid script

Reversal Bands & Zones (Expo) "It has never been easier to find high probability trades"
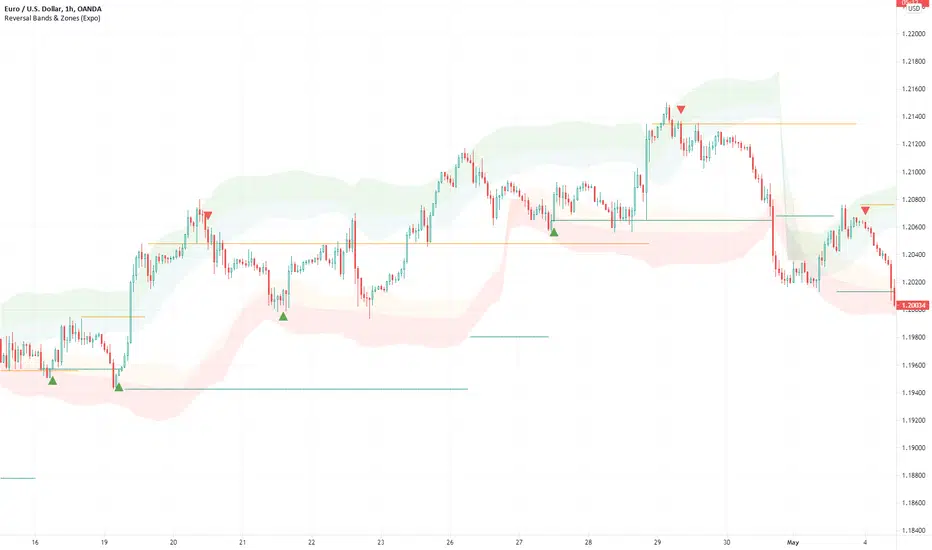
Reversal Bands & Zones (Expo) is an algorithm that analyzes the market in real-time and identifies reversal points, key market zones, and trends. The advanced and unique reversal bands act as support & resistance zones, and together with the trend tracking feature, it serves as a trend confirmation. The real-time market zones are displayed where there is a high probability of finding support/resistance. The algorithm does also map out key pivot levels based on the current market structure.
> Reversal points and key market zones have alerts.
Real-time
No repainting
Works on any market and in any timeframe
The indicator can be used standalone or as a part of your current trading strategy.
☖ Reversals
The algorithm identifies areas of potential turning points, these are displayed as Upper and Lower Reversal Cloud. When the price hits the cloud and bounces off there is a high probability that the price will reverse. If the price stays in the reversal cloud, there is a high probability that a trend is forming.
☖ Trends
Positive Trend: If the price is in or close to the upper green reversal band and above the trend- tracking line, we can be sure that the market is in a positive trend until the price crosses down from the reversal cloud and the trend tracking line.
NegativeTrend: If the price is in or close to the lower red reversal band and below the trend- tracking line, we can be sure that the market is in a negative trend until the price crosses up from the reversal cloud and the trend tracking line.
☖ Zones
"It hasn't been easier to display, in real-time, one of the most important and useful technical analysis, namely key support and resistance zones"
The algorithm analyzes the market structure in real-time and maps out key supply/resistance and demand/support zones. The user gets an instant understanding of the market structure. Support and resistance can be used to determine the range of a market, to trade reversals, bounces, or breakouts.
☖ Pivots
The indicator does also displays key pivot levels. Pivots can be used to determine the range of a market, to trade reversals, bounces, or breakouts.
HOW TO USE
- Use the indicator to identify reversals.
- Use the indicator to identify the range of the market.
- Use the indicator to identify key support/resistance zones.
- Use the indicator to identify trends.
INDICATOR IN ACTION
1-hour chart
I hope you find this indicator useful , and please comment or contact me if you like the script or have any questions/suggestions for future improvements. Thanks!
I will continually work on this indicator, so please share your experience and feedback as it will enable me to make even better improvements. Thanks to everyone that has already contacted me regarding my scripts. Your feedback is valuable for future developments!
-----------------
Disclaimer
Copyright by Zeiierman.
The information contained in my scripts/indicators/ideas does not constitute financial advice or a solicitation to buy or sell any securities of any type. I will not accept liability for any loss or damage, including without limitation any loss of profit, which may arise directly or indirectly from the use of or reliance on such information.
All investments involve risk, and the past performance of a security, industry, sector, market, financial product, trading strategy, or individual’s trading does not guarantee future results or returns. Investors are fully responsible for any investment decisions they make. Such decisions should be based solely on an evaluation of their financial circumstances, investment objectives, risk tolerance, and liquidity needs.
My scripts/indicators/ideas are only for educational purposes!
ACCESS THE INDICATOR
• Contact me on TradingView or use the links below
ATR + PSAR Trailing Stop (Expo)This ATR + PSAR Trailing Stop indicator is unique. It comes with new ways of calculating ATR and PSAR to enhance performance and accuracy as well as give clarity in trends. The indicator can be used standalone or as a part of your current trading strategy.
ATR + PSAR Trailing Stop (Expo) is a trailing stop indicator that combines ATR and PSAR to enhance the calculation of the trailing stop. This indicator works well in all types of markets, for example, in a trading range or in a trending market, etc.
The user can choose between the following ATR Settings:
Quick ATR
Adaptive ATR
Follow the price closely - ATR
Standard ATR
Trend ATR
The user can enable Trend ATR which displays the overall market structure. If the Trend ATR line is above the price we have a negative market structure, and if the Trend ATR line is below the price we have a positive market structure.
Real-time
No repainting
Works on any market and in any timeframe
HOW TO USE
- Use the ATR + PSAR Trailing Stop as a stop-loss.
- Use the indicator for taking a position when price crosses the ATR trailing line or taking a position when price crosses the PSAR circles.
- Use the indicator to identify the current market structure and trend.
The indicator can be used standalone or as a part of your current trading strategy.
INDICATOR IN ACTION
1-hour chart
I hope you find this indicator useful , and please comment or contact me if you like the script or have any questions/suggestions for future improvements. Thanks!
I will continually work on this indicator, so please share your experience and feedback as it will enable me to make even better improvements. Thanks to everyone that has already contacted me regarding my scripts. Your feedback is valuable for future developments!
-----------------
Disclaimer
Copyright by Zeiierman.
The information contained in my scripts/indicators/ideas does not constitute financial advice or a solicitation to buy or sell any securities of any type. I will not accept liability for any loss or damage, including without limitation any loss of profit, which may arise directly or indirectly from the use of or reliance on such information.
All investments involve risk, and the past performance of a security, industry, sector, market, financial product, trading strategy, or individual’s trading does not guarantee future results or returns. Investors are fully responsible for any investment decisions they make. Such decisions should be based solely on an evaluation of their financial circumstances, investment objectives, risk tolerance, and liquidity needs.
My scripts/indicators/ideas are only for educational purposes!
ACCESS THE INDICATOR
• Contact me on TradingView or use the links below
Rolling ATR Channel (Expo)Rolling ATR Channel (Expo) is a sophisticated indicator that identifies the underlying trend as well as identifies ATR based trading ranges. In a trending market, the price will be within the Upper or Lower band. If the market is in a trading range , the price will bounce between the upper and lower ATR zones, until the price breaks through and creates a new trend. The user will no longer have to guess in which state the market is in, the indicator displays it clearly.
So, the indicator displays real-time Range (ATR based) support and resistance zones as well as if the market is in a trend.
If you know the current market state, you have the ability to choose the most applicable market strategy.
Real-time
No repainting
Works on any market and in any timeframe
HOW TO USE
- Use the indicator to identify trading range support and resistance zones.
- Use the indicator to identify when the price breaks through the trading range.
- Use the indicator to identify if the market is in a trend.
INDICATOR IN ACTION
4 Hour chart
I hope you find this indicator useful , and please comment or contact me if you like the script or have any questions/suggestions for future improvements. Thanks!
I will continually work on this indicator, so please share your experience and feedback as it will enable me to make even better improvements. Thanks to everyone that has already contacted me regarding my scripts. Your feedback is valuable for future developments!
-----------------
Disclaimer
Copyright by Zeiierman.
The information contained in my scripts/indicators/ideas does not constitute financial advice or a solicitation to buy or sell any securities of any type. I will not accept liability for any loss or damage, including without limitation any loss of profit, which may arise directly or indirectly from the use of or reliance on such information.
All investments involve risk, and the past performance of a security, industry, sector, market, financial product, trading strategy, or individual’s trading does not guarantee future results or returns. Investors are fully responsible for any investment decisions they make. Such decisions should be based solely on an evaluation of their financial circumstances, investment objectives, risk tolerance, and liquidity needs.
My scripts/indicators/ideas are only for educational purposes!
-----------------
ACCESS THE INDICATOR
• Contact me on TradingView or use the links below

Supply & Demand Zones - ShortTerm (Expo) "It hasn't been easier to display, in real-time, one of the most important and useful technical analysis, namely supply/demand zones. This algorithm analyzes the market structure in real-time and maps out key supply and demand zones for you. "
Supply/Demand Zones - ShortTerm (Expo) analyze the short-term market structure in real-time and maps out key supply and demand zones. The user gets an instant understanding of the short-term market structure.
The indicator identifies short-term zones where demand overwhelms supply which is driving the price up, or where supply overwhelms demand which is driving the price down. It makes sense to buy at a demand zone and to sell at a supply zone, but keep in mind that fresh zones are more effective than retested ones. They can be used as entry zones for a continuing trend or as reversal zones for a changing trend.
--> The indicator displays up to 5 zones , which one of them (the blue one) can be customized. Labels with price levels can be enabled. Flexible source input- and zone settings.
-->The indicator can be used standalone or as a part of your current trading strategy.
Real-time
No repainting
Works on any market
HOW TO USE
1. Use the indicator to identify key short-term supply and demand zones.
2. Use the indicator to confirm the existence, or a continuation, of a trend or a trend reversal.
3. Use the indicator to identify potential breakouts.
INDICATOR IN ACTION
4-hour chart
I hope you find this indicator useful , and please comment or contact me if you like the script or have any questions/suggestions for future improvements. Thanks!
I will continually work on this indicator , so please share your experience and feedback as it will enable me to make even better improvements. Thanks to everyone that has already contacted me regarding my scripts. Your feedback is valuable for future developments!
ACCESS THE INDICATOR
• Contact me on TradingView or use the links below
-----------------
Disclaimer
Copyright by Zeiierman.
The information contained in my scripts/indicators/ideas does not constitute financial advice or a solicitation to buy or sell any securities of any type. I will not accept liability for any loss or damage, including without limitation any loss of profit, which may arise directly or indirectly from the use of or reliance on such information.
All investments involve risk, and the past performance of a security, industry, sector, market, financial product, trading strategy, or individual’s trading does not guarantee future results or returns. Investors are fully responsible for any investment decisions they make. Such decisions should be based solely on an evaluation of their financial circumstances, investment objectives, risk tolerance, and liquidity needs.
My scripts/indicators/ideas are only for educational purposes!
High & Low Of Custom Session - OpeningRange Breakout (Expo)High & Low Of Custom Session - OpeningRange Breakout (Expo) prints the high and the low of a custom session.
I use the indicator to trade the re-test of opening range (high/low) as well as breakouts from the opening range. The same logic can be applied to the session you have chosen.
HOW TO USE
1. Use the indicator to trade the re-tests of the session range.
2. Use the indicator to trade breakouts of session range.
INDICATOR IN ACTION
1-min chart
I hope you find this indicator useful , and please comment or contact me if you like the script or have any questions/suggestions for future improvements. Thanks!
I will continually work on this indicator, so please share your experience and feedback as it will enable me to make even better improvements. Thanks to everyone that has already contacted me regarding my scripts. Your feedback is valuable for future developments!
-----------------
Disclaimer
Copyright by Zeiierman.
The information contained in my scripts/indicators/ideas does not constitute financial advice or a solicitation to buy or sell any securities of any type. I will not accept liability for any loss or damage, including without limitation any loss of profit, which may arise directly or indirectly from the use of or reliance on such information.
All investments involve risk, and the past performance of a security, industry, sector, market, financial product, trading strategy, or individual’s trading does not guarantee future results or returns. Investors are fully responsible for any investment decisions they make. Such decisions should be based solely on an evaluation of their financial circumstances, investment objectives, risk tolerance, and liquidity needs.
My scripts/indicators/ideas are only for educational purposes!

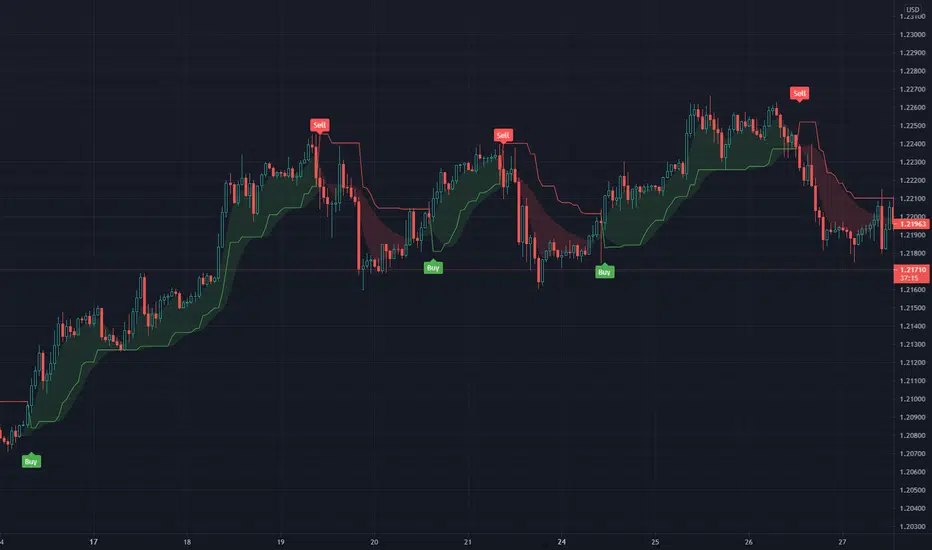
Momentum Oscillator [Dynamic & Flow] (Expo)Momentum Oscillator -Dynamic & Flow (Expo) is a fast-moving, sensitive oscillator that makes use of momentum in various ways. The indicator has two additional layers (Buy & Sell moves) and (Extremes) which makes it reacts quickly to price changes.
The indicator displays overbought and oversold areas as well as extreme areas and how aggressive buyers and sellers are. It does also displays potential reversal points or potential pullbacks.
The following momentum modes are displayed:
1. Where momentum begins
2. Where momentum is strong
3. Where momentum begins to stall
Where momentum begins to stall is displayed as a red and green color on the momentum line .
Where momentum begins (light green and light red color) and where it's strong (dark green and dark red color) is displayed as upper and lower lines. The darker these lines are the stronger is the momentum.
Potential reversal or pullback is displayed as a blue color on the signal line.
♢ The indicator has inbuilt suggested buy & sell- and stop-loss signals. These signals have flexible settings, so a fast, slow, and sensitive mode can be enabled.
DIVERGENCES
All types of momentum oscillators produce divergences and so does Momentum Oscillator Dynamic & Flow (Expo) . Divergences occur when the oscillator deviates from the trending price action. Bullish divergence is then when the trending price makes a lower low but the oscillator makes a higher low. Bearish divergence is then when the trending price makes a higher high but the oscillator makes a lower high.
HOW TO USE
1. Use the indicator to identify overbought/oversold areas, as well as extreme modes.
2. Use the indicator to display momentum in various ways.
3. Use the indicator to confirm the existence, or a continuation, of a trend.
4. Use the indicator to identify potential reversal points or potential pullbacks.
INDICATOR IN ACTION
4-hour chart
I hope you find this indicator useful , and please comment or contact me if you like the script or have any questions/suggestions for future improvements. Thanks!
I will continually work on this indicator, so please share your experience and feedback as it will enable me to make even better improvements. Thanks to everyone that has already contacted me regarding my scripts. Your feedback is valuable for future developments!
ACCESS THE INDICATOR
• Contact me on TradingView or use the links below
-----------------
Disclaimer
Copyright by Zeiierman.
The information contained in my scripts/indicators/ideas does not constitute financial advice or a solicitation to buy or sell any securities of any type. I will not accept liability for any loss or damage, including without limitation any loss of profit, which may arise directly or indirectly from the use of or reliance on such information.
All investments involve risk, and the past performance of a security, industry, sector, market, financial product, trading strategy, or individual’s trading does not guarantee future results or returns. Investors are fully responsible for any investment decisions they make. Such decisions should be based solely on an evaluation of their financial circumstances, investment objectives, risk tolerance, and liquidity needs.
My scripts/indicators/ideas are only for educational purposes!

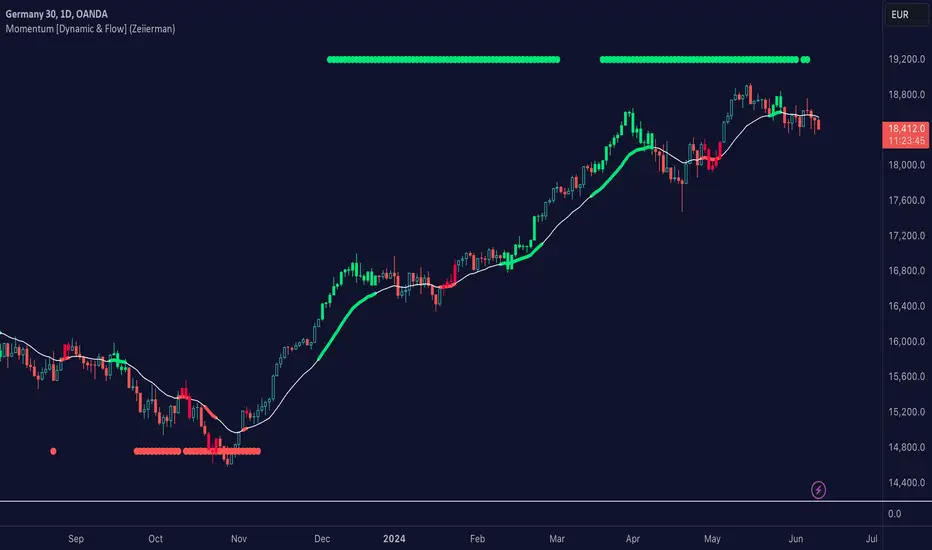
Momentum [Dynamic & Flow] (Expo)Momentum Dynamic & Flow (Expo) is a useful indicator that displays the momentum - as dynamic & flow, as well as where the momentum begins to stall.
♢ Momentum -Dynamic can be used to identify overbought and oversold areas.
♢ Momentum -Flow can be used to identify if the current trend has strong momentum.
♢ When momentum begins to stall it can be identifiable turning points, areas of congestion. However, it's not a sign that the trend is over, see it as "heads up" This is displayed with green and red colors on the moving average.
Momentum can be displayed at the top/bottom of the chart or above/below the bars. The user can also display momentum as BGcolor.
The indicator can be used standalone or as a part of your current trading strategy
HOW TO USE
1. Use the indicator to identify where the momentum stall.
2. Use the indicator to identify overbought/oversold areas with momentum -Dynamic.
3. Use the indicator to confirm the existence, or a continuation, of a trend with momentum -Flow.
INDICATOR IN ACTION
1-hour chart
4-hour chart
I hope you find this indicator useful , and please comment or contact me if you like the script or have any questions/suggestions for future improvements. Thanks!
I will continually work on this indicator, so please share your experience and feedback as it will enable me to make even better improvements. Thanks to everyone that has already contacted me regarding my scripts. Your feedback is valuable for future developments!
-----------------
Disclaimer
Copyright by Zeiierman.
The information contained in my scripts/indicators/ideas does not constitute financial advice or a solicitation to buy or sell any securities of any type. I will not accept liability for any loss or damage, including without limitation any loss of profit, which may arise directly or indirectly from the use of or reliance on such information.
All investments involve risk, and the past performance of a security, industry, sector, market, financial product, trading strategy, or individual’s trading does not guarantee future results or returns. Investors are fully responsible for any investment decisions they make. Such decisions should be based solely on an evaluation of their financial circumstances, investment objectives, risk tolerance, and liquidity needs.
My scripts/indicators/ideas are only for educational purposes!
Average High Traded Volume (Nodes) - Levels/Zones (Expo)Average High Traded Volume (Nodes) - (Expo) automatically identifies and displays High Traded Volume Nodes.
Levels/Zones are displayed where there has been a significant level of trading activity and when there has been both high supply and demand. These levels can leave clues for future price behavior and act as support/resistance zones.
The indicator can be used standalone or as a part of your current trading strategy.
Real-time
No repainting
Works on any market if volume data is provided
HOW TO USE
1. Use the indicator to identify High Traded Volume Nodes.
2. Use the indicator to identify support/resistance zones.
3. Use the indicator to confirm the existence, or a continuation, of a trend or a trend reversal.
INDICATOR IN ACTION
4-hour chart
I hope you find this indicator useful , and please comment or contact me if you like the script or have any questions/suggestions for future improvements. Thanks!
I will continually work on this indicator, so please share your experience and feedback as it will enable me to make even better improvements. Thanks to everyone that has already contacted me regarding my scripts. Your feedback is valuable for future developments!
ACCESS THE INDICATOR
• Contact me on TradingView or use the links below
-----------------
Disclaimer
Copyright by Zeiierman.
The information contained in my scripts/indicators/ideas does not constitute financial advice or a solicitation to buy or sell any securities of any type. I will not accept liability for any loss or damage, including without limitation any loss of profit, which may arise directly or indirectly from the use of or reliance on such information.
All investments involve risk, and the past performance of a security, industry, sector, market, financial product, trading strategy, or individual’s trading does not guarantee future results or returns. Investors are fully responsible for any investment decisions they make. Such decisions should be based solely on an evaluation of their financial circumstances, investment objectives, risk tolerance, and liquidity needs.
My scripts/indicators/ideas are only for educational purposes!

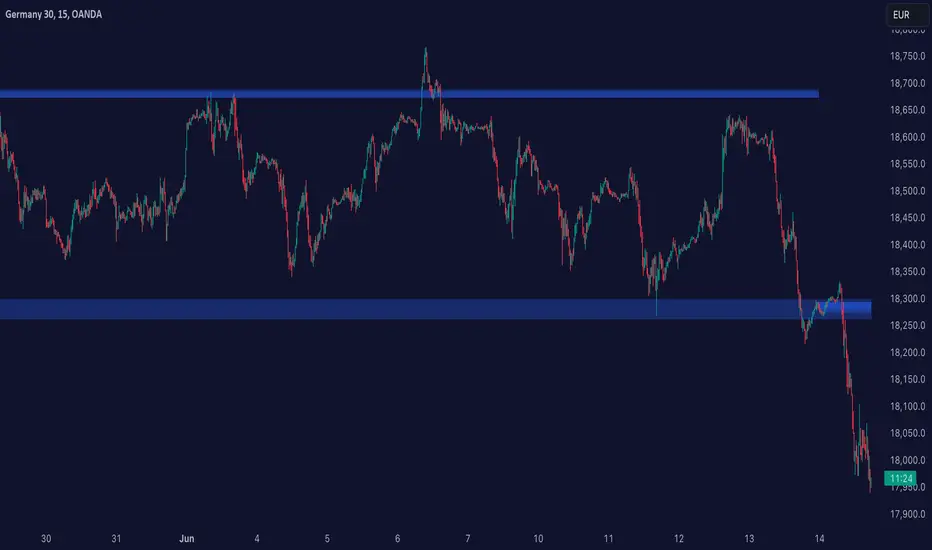
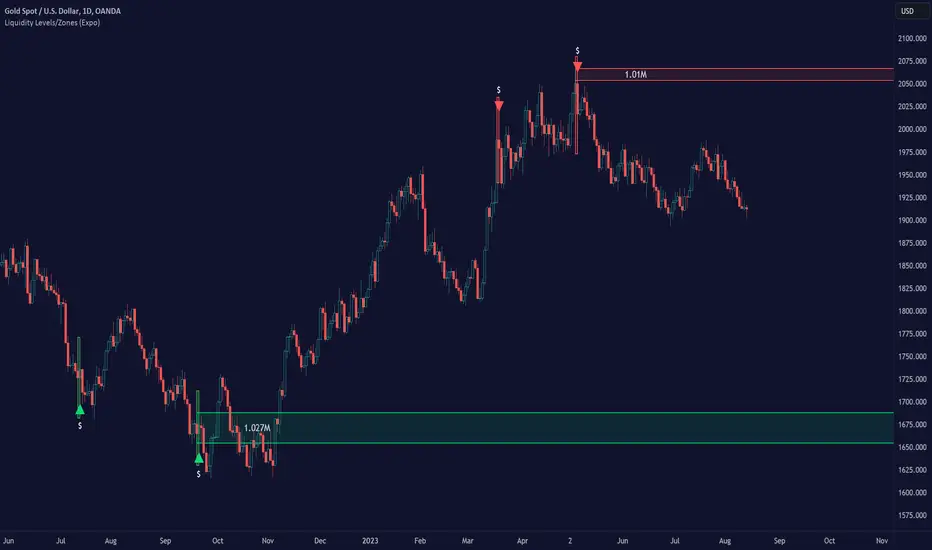
Liquidity Levels/Zones (Expo)Liquidity Levels/Zones (Expo) automatically identifies and displays key liquidity levels/zones.
Liquidity describes the extent to which an asset can be bought and sold quickly, without affecting the price. It is a measure of how many buyers and sellers are present, and whether transactions can take place easily.
Levels/Zones are displayed where there is a significant level of trading activity and when there is both high supply and demand for an asset, security, or contract. These levels can leave clues for future price behavior and act as support/resistance zones. The trading activity can confirm the existence, or a continuation, of a trend or a trend reversal.
The user can modify the settings so that short- term, medium-term, and long- term liquidity levels/zones are displayed.
The indicator can be used standalone or as a part of your current trading strategy.
Real-time
No repainting
Works on any market
HOW TO USE
1. Use the indicator to identify key liquidity levels/zones.
2. Use the indicator to identify high trading activity.
3. Use the indicator to confirm the existence, or a continuation, of a trend or a trend reversal.
INDICATOR IN ACTION
1-hour chart
I hope you find this indicator useful , and please comment or contact me if you like the script or have any questions/suggestions for future improvements. Thanks!
I will continually work on this indicator, so please share your experience and feedback as it will enable me to make even better improvements. Thanks to everyone that has already contacted me regarding my scripts. Your feedback is valuable for future developments!
ACCESS THE INDICATOR
• Contact me on TradingView or use the links below
-----------------
Disclaimer
Copyright by Zeiierman.
The information contained in my scripts/indicators/ideas does not constitute financial advice or a solicitation to buy or sell any securities of any type. I will not accept liability for any loss or damage, including without limitation any loss of profit, which may arise directly or indirectly from the use of or reliance on such information.
All investments involve risk, and the past performance of a security, industry, sector, market, financial product, trading strategy, or individual’s trading does not guarantee future results or returns. Investors are fully responsible for any investment decisions they make. Such decisions should be based solely on an evaluation of their financial circumstances, investment objectives, risk tolerance, and liquidity needs.
My scripts/indicators/ideas are only for educational purposes!
Auto Support/Resistance Levels (Expo)Auto Support/Resistance Levels (Expo) automatically identifies and displays key support and resistance levels.
The user can enable short- term, medium-term, and long- term Auto SR Levels.
The indicator can be used standalone or as a part of your current trading strategy.
Real-time
No repainting
Works on any market
HOW TO USE
1. Use the indicator to identify key Support and Resistance Levels
INDICATOR IN ACTION
Daily chart
I hope you find this indicator useful , and please comment or contact me if you like the script or have any questions/suggestions for future improvements. Thanks!
I will continually work on this indicator, so please share your experience and feedback as it will enable me to make even better improvements. Thanks to everyone that has already contacted me regarding my scripts. Your feedback is valuable for future developments!
ACCESS THE INDICATOR
• Contact me on TradingView or use the links below
-----------------
Disclaimer
Copyright by Zeiierman.
The information contained in my scripts/indicators/ideas does not constitute financial advice or a solicitation to buy or sell any securities of any type. I will not accept liability for any loss or damage, including without limitation any loss of profit, which may arise directly or indirectly from the use of or reliance on such information.
All investments involve risk, and the past performance of a security, industry, sector, market, financial product, trading strategy, or individual’s trading does not guarantee future results or returns. Investors are fully responsible for any investment decisions they make. Such decisions should be based solely on an evaluation of their financial circumstances, investment objectives, risk tolerance, and liquidity needs.
My scripts/indicators/ideas are only for educational purposes!

Trapped Traders - SR Levels/Zones (Expo) Trapped Traders - SR Levels/Zones (Expo) automatically identifies and displays support and resistance levels based on where Bulls & Bears can be trapped.
Levels are displayed where there is a high probability that market participants will be trapped and forced to exit their positions if the price breakouts from the SR level.
If the price doesn't breakouts from the SR level there's a chance that the market has topped or bottomed out.
The indicator can be used standalone or as a part of your current trading strategy.
Real-time
No repainting
Works on any market
HOW TO USE
1. Use the indicator to identify where Bulls and Bears can be trapped.
2. Use the indicator to identify potential breakouts in the trend direction.
3. Use the indicator to identify potential reversal points.
INDICATOR IN ACTION
Daily Chart
I hope you find this indicator useful , and please comment or contact me if you like the script or have any questions/suggestions for future improvements. Thanks!
I will continually work on this indicator, so please share your experience and feedback as it will enable me to make even better improvements. Thanks to everyone that has already contacted me regarding my scripts. Your feedback is valuable for future developments!
ACCESS THE INDICATOR
• Contact me on TradingView or use the links below
-----------------
Disclaimer
Copyright by Zeiierman.
The information contained in my scripts/indicators/ideas does not constitute financial advice or a solicitation to buy or sell any securities of any type. I will not accept liability for any loss or damage, including without limitation any loss of profit, which may arise directly or indirectly from the use of or reliance on such information.
All investments involve risk, and the past performance of a security, industry, sector, market, financial product, trading strategy, or individual’s trading does not guarantee future results or returns. Investors are fully responsible for any investment decisions they make. Such decisions should be based solely on an evaluation of their financial circumstances, investment objectives, risk tolerance, and liquidity needs.
My scripts/indicators/ideas are only for educational purposes!

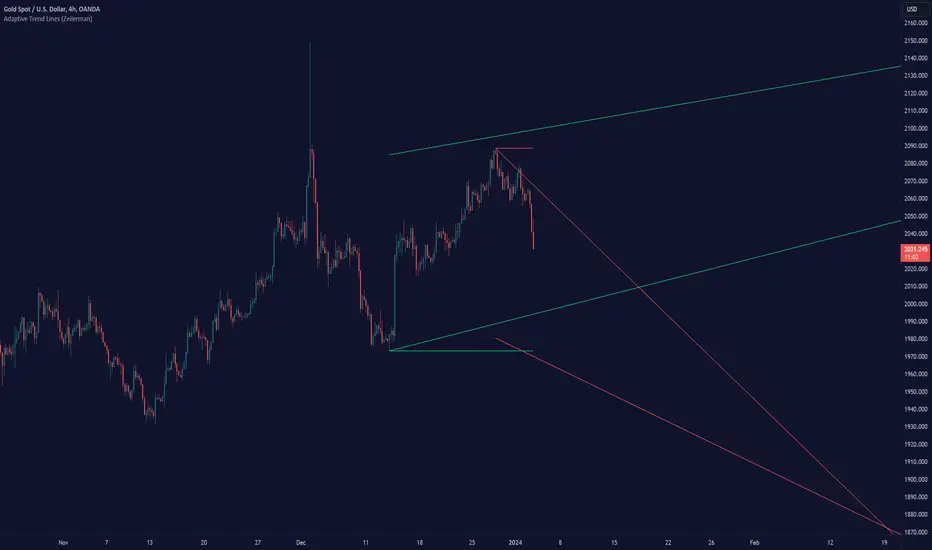
Adaptive Trend Lines (Expo)Adaptive Trend Lines (Expo) identifies the current trend direction within the selected lookback period. The idea behind the indicator is that the trend lines should self adjust to the constantly changing market. The indicator adjusts itself to the market by using tr (true range) and stdev (standard deviation) as dynamic variables.
The indicator displays positive- and negative trend channels.
HOW TO USE
1. Use the indicator to identify the trend direction.
I hope you find this indicator useful , and please comment or contact me if you like the script or have any questions/suggestions for future improvements. Thanks!
I will continually work on this indicator , so please share your experience and feedback as it will enable me to make even better improvements. Thanks to everyone that has already contacted me regarding my scripts. Your feedback is valuable for future developments!
-----------------
Disclaimer
Copyright by Zeiierman.
The information contained in my scripts/indicators/ideas does not constitute financial advice or a solicitation to buy or sell any securities of any type. I will not accept liability for any loss or damage, including without limitation any loss of profit, which may arise directly or indirectly from the use of or reliance on such information.
All investments involve risk, and the past performance of a security, industry, sector, market, financial product, trading strategy, or individual’s trading does not guarantee future results or returns. Investors are fully responsible for any investment decisions they make. Such decisions should be based solely on an evaluation of their financial circumstances, investment objectives, risk tolerance, and liquidity needs.
My scripts/indicators/ideas are only for educational purposes!
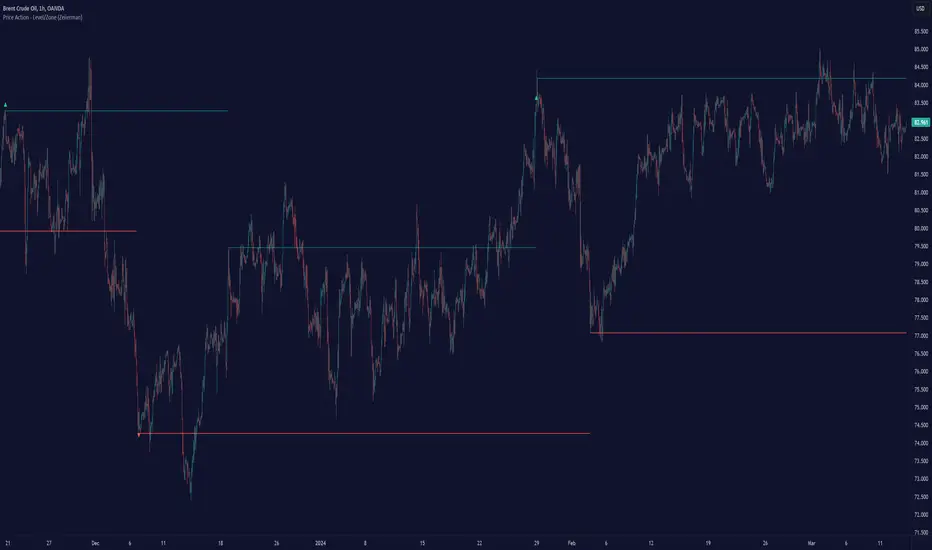
Price Action - Level/Zone (Expo)Price Action - Level/Zone (Expo) indicator identifies buying and selling pressure that has an impact on the price movement. This is visualized by a Zone, or Levels or with Barcolors depending on which settings are used.
Depending on the selected settings the indicator can identify buying and selling pressure which pushes the price further in the trend direction and it can show exhausted buyers/sellers which is seen in reversal points.
HOW TO USE
1. Use the indicator to identify buying and selling pressure.
2. Use the indicator to identify exhausted buyers and sellers.
3. Use the indicator to identify reversal points, pullbacks, or trend shifts.
4. Use the indicator to buy/short-sell breakouts of the zones.
5. Use the indicator to buy/short-sell when the price re-test the zones.
-> Try the indicator on Heikin Ashi Candles , but it works as good at any type of candlestick, bars, Renko, or line break.
INDICATOR IN ACTION
4 hour chart
4 hour chart
I hope you find this indicator useful , and please comment or contact me if you like the script or have any questions/suggestions for future improvements. Thanks!
I will continually work on this indicator, so please share your experience and feedback as it will enable me to make even better improvements. Thanks to everyone that has already contacted me regarding my scripts. Your feedback is valuable for future developments!
ACCESS THE INDICATOR
• Contact me on TradingView or use the links below
-----------------
Disclaimer
Copyright by Zeiierman.
The information contained in my scripts/indicators/ideas does not constitute financial advice or a solicitation to buy or sell any securities of any type. I will not accept liability for any loss or damage, including without limitation any loss of profit, which may arise directly or indirectly from the use of or reliance on such information.
All investments involve risk, and the past performance of a security, industry, sector, market, financial product, trading strategy, or individual’s trading does not guarantee future results or returns. Investors are fully responsible for any investment decisions they make. Such decisions should be based solely on an evaluation of their financial circumstances, investment objectives, risk tolerance, and liquidity needs.
My scripts/indicators/ideas are only for educational purposes!
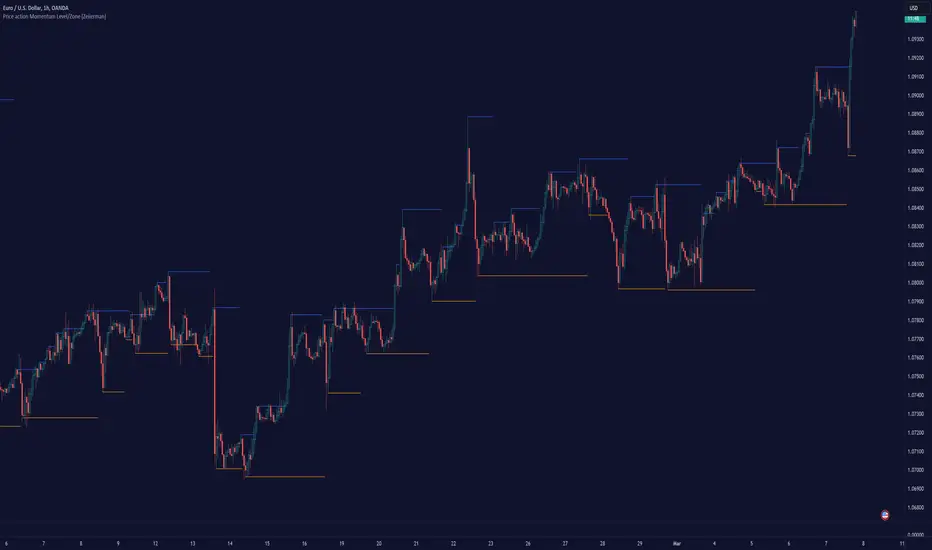
Price action Momentum Level/Zone (Expo) Price action Momentum Levels/Zones (Expo) indicator identifies relatively stronger Up and Down Momentum. This is visualized by a Zone, or Levels or with Barcolors depending on which settings are used.
When the market has relatively stronger momentum it can be a sign that the sellers or buyers are exhausted and the market has to pause, make a pullback, or make a trend shift.
HOW TO USE
1. Use the indicator to identify relatively stronger momentum.
2. Use the indicator to identify pullbacks or trend shifts.
3. Use the indicator to buy/short-sell breakouts of the zones.
4. Use the indicator to buy/short-sell when the price re-test the zones.
INDICATOR IN ACTION
4 hour chart
I hope you find this indicator useful , and please comment or contact me if you like the script or have any questions/suggestions for future improvements. Thanks!
I will continually work on this indicator, so please share your experience and feedback as it will enable me to make even better improvements. Thanks to everyone that has already contacted me regarding my scripts. Your feedback is valuable for future developments!
ACCESS THE INDICATOR
• Contact me on TradingView or use the links below
-----------------
Disclaimer
Copyright by Zeiierman.
The information contained in my scripts/indicators/ideas does not constitute financial advice or a solicitation to buy or sell any securities of any type. I will not accept liability for any loss or damage, including without limitation any loss of profit, which may arise directly or indirectly from the use of or reliance on such information.
All investments involve risk, and the past performance of a security, industry, sector, market, financial product, trading strategy, or individual’s trading does not guarantee future results or returns. Investors are fully responsible for any investment decisions they make. Such decisions should be based solely on an evaluation of their financial circumstances, investment objectives, risk tolerance, and liquidity needs.
My scripts/indicators/ideas are only for educational purposes!
Intelligent Price Action - Movement Down (Expo)Intelligent Price Action - Movement Down (Expo)
DESCRIPTION
Intelligent Price Action - Movement Down (Expo) identifies important down movements that have an impact on current price characteristics. The indicator is visualizing selling pressure! These price patterns are valuable insight when trading the market.
This indicator response faster to price movement and is more focused on detecting selling pressure rather than exhausted sellers.
• Selling pressure is seen in reversal points.
• Selling pressure can be seen when the sellers are exhausted.
• Selling pressure can be seen in negative breakouts.
HOW TO USE
1. Use the indicator to identify selling pressure.
2. Use the indicator to identify reversal points.
3. Use the indicator to identify exhausted sellers.
4. Use the indicator to identify breakouts.
Combine the indicator with ‘ Intellilligent Price Action - Movement Up (Expo) ’ or with my other Price Action indicators.
INDICATOR IN ACTION
EURUSD
EURUSD
BTCUSD
BTCUSD
GOLD
WALL STREET
WALL STREET
EURUSD
BTCUSD
BRENT
The indicator works with RENKO, HEIKIN ASHI and with KAGI charts as well.
I hope you find this indicator useful , and please comment or contact me if you like the script or have any questions/suggestions for future improvements. Thanks!
I will continue to work on this indicator, so please share your experience and feedback with me so that I can continuously improve it. Thanks to everyone that have contacted me regarding my scripts. Your feedback is valuable for future developments!
ACCESS THE INDICATOR
• Contact me on TradingView or use the links below
-----------------
Disclaimer
Copyright by Zeiierman.
The information contained in my scripts/indicators/ideas does not constitute financial advice or a solicitation to buy or sell any securities of any type. I will not accept liability for any loss or damage, including without limitation any loss of profit, which may arise directly or indirectly from use of or reliance on such information.
All investments involve risk, and the past performance of a security, industry, sector, market, financial product, trading strategy, or individual’s trading does not guarantee future results or returns. Investors are fully responsible for any investment decisions they make. Such decisions should be based solely on an evaluation of their financial circumstances, investment objectives, risk tolerance, and liquidity needs.
My scripts/indicators/ideas are only for educational purposes!

Intelligent Price Action - Positive Close (Expo)Intelligent Price Action - Positive Close (Expo)
DESCRIPTION
Intelligent Price Action - Positive Close (Expo) identifies important positive closes that have an impact on current price characteristics. The indicator is visualizing buying pressure! These price patterns are valuable insight when trading the market.
• Buying pressure is seen in reversal points.
• Buying pressure can be seen when the buyers are exhausted.
• Buying pressure can be seen in positive breakouts.
HOW TO USE
1. Use the indicator to identify buying pressure.
2. Use the indicator to identify reversal points.
3. Use the indicator to identify exhausted buyers.
4. Use the indicator to identify breakouts.
Combine the indicator with ‘I ntellilligent Price Action - Negative Close (Expo) ’ or with my other Price Action indicators.
INDICATOR IN ACTION
EURUSD
EURUSD
BTCUSD
BRENT
WALL STREET
WALL STREET
WALL STREET
BTCUSD
BTCUSD
EURUSD
EURUSD
The indicator works with RENKO, HEIKIN ASHI and with KAGI charts as well.
I hope you find this indicator useful , and please comment or contact me if you like the script or have any questions/suggestions for future improvements. Thanks!
I will continue to work on this indicator, so please share your experience and feedback with me so that I can continuously improve it. Thanks to everyone that have contacted me regarding my scripts. Your feedback is valuable for future developments!
ACCESS THE INDICATOR
• Contact me on TradingView or use the links below
-----------------
Disclaimer
Copyright by Zeiierman.
The information contained in my scripts/indicators/ideas does not constitute financial advice or a solicitation to buy or sell any securities of any type. I will not accept liability for any loss or damage, including without limitation any loss of profit, which may arise directly or indirectly from use of or reliance on such information.
All investments involve risk, and the past performance of a security, industry, sector, market, financial product, trading strategy, or individual’s trading does not guarantee future results or returns. Investors are fully responsible for any investment decisions they make. Such decisions should be based solely on an evaluation of their financial circumstances, investment objectives, risk tolerance, and liquidity needs.
My scripts/indicators/ideas are only for educational purposes!

Trend Scalper (Expo)Trend Scalper (Expo)
DESCRIPTION
Trend Scalper (Expo) is a Scalping strategy based on RSI, Stochastic and moving averages techniques. The idea is to visualize scalping opportunities in trends.
The trend is determined by the color of the moving average called ‘TrendHolder’ The ‘Trendholer’ consists of 3 colors, green, red and orange. Green is a positive trend, red is a negative trend and orange is a neutral or no trend.
Scalping opportunities are visualized by the circles and the triangles. The circles are based on RSI calculation. The triangles are based on Stochastic calculation.
- If there is a green circle and a green triangle and ‘Trendholder’ is orange or green, Enter Long!
- If there is a red circle and a red triangle and ‘Trendholder’ is orange or red, Enter Short!
Combine the indicator with HEIKIN ASHI candlesticks.
HOW TO USE
1. Use the indicator to find scalping opportunities in trends.
I NDICATOR IN ACTION
BTCUSD
EURUSD
GOLD
The indicator works with RENKO, HEIKIN ASHI and with KAGI charts as well.
I hope you find this indicator useful, and please comment or contact me if you like the script or have any questions/suggestions for future improvements. Thanks!
I will continue to work on this indicator, so please share your experience and feedback with me so that I can continuously improve it. Thanks to everyone that have contacted me regarding my scripts. Y our feedback is valuable for future developments!
ACCESS THE INDICATOR
• Contact me on TradingView or use the links below
-----------------
Disclaimer
Copyright by Zeiierman.
The information contained in my scripts/indicators/ideas does not constitute financial advice or a solicitation to buy or sell any securities of any type. I will not accept liability for any loss or damage, including without limitation any loss of profit, which may arise directly or indirectly from use of or reliance on such information.
All investments involve risk, and the past performance of a security, industry, sector, market, financial product, trading strategy, or individual’s trading does not guarantee future results or returns. Investors are fully responsible for any investment decisions they make. Such decisions should be based solely on an evaluation of their financial circumstances, investment objectives, risk tolerance, and liquidity needs.
My scripts/indicators/ideas are only for educational purposes!
