Phantom Trend IndicatorOverview
The Phantom Trend Indicator (PTI) is a streamlined tool for identifying trend direction and strength. It blends zigzag-based trend detection with a volume profile to display a histogram showing price distance from the Point of Control (POC). Six distinct colors highlight trend states, with background highlights for extreme price zones. Ideal for stocks, forex, crypto, and futures across any timeframe.
Features:
Trend Detection: Uses zigzag fractals to identify uptrends and downtrends.
Histogram Colors: Six colors for trend strength (low, high, extreme for up/down trends) or neutral (gray).
Dynamic Levels: Plots POC, Value Area Low (VAL), and High (VAH) via volume profile.
Background Colors: Highlights overbought (above VAH) or oversold (below VAL) zones.
Alerts: Signals new trends.
How It Works:
Trends: Zigzag fractals define trend ranges, with price position setting histogram colors (low, high, or extreme).
Histogram: Shows price deviation from POC.
Background: Colors extreme zones outside VAL/VAH.
This indicator builds on traditional trend detectors and volume profiles by integrating them into a single, cohesive tool. Unlike standard momentum indicators that rely on moving averages, PTI uses zigzag fractals for more responsive trend identification, reducing lag in volatile markets. Compared to basic volume profile scripts, it adds trend-based color coding and background alerts for extremes, providing clearer visual cues for overbought/oversold conditions. The six distinct colors indicate trend strength, and customizable thresholds allow fine-tuning for different assets and timeframes, enhancing adaptability. Traders benefit from combined momentum and liquidity insights, helping spot reversals or continuations more reliably—making PTI a valuable, standalone addition for both novice and experienced users.
Settings
Trend Detector: Toggle alerts, adjust zigzag sensitivity, and set thresholds for low-to-high and extreme color transitions.
Dynamic Levels: Configure volume profile period, multiplier, accuracy, value area percent, and ATR-based channel width.
Visuals: Customize POC, VAL, VAH, and area fill colors.
Read Histogram: Uptrend colors show early, strong, or overextended moves; downtrend colors indicate early, weakening, or oversold conditions; gray for consolidation.
Background: Monitor for overbought/oversold color-coded signals.
Tune: Adjust zigzag or period settings for your timeframe/asset.
Tips
Shorten period for intraday, extend for swing trading.
Pair with other indicators for confirmation.
Notes:
Requires sufficient chart data for volume profile.
Test settings for low-volatility assets.
For informational use only, not financial advice. Test thoroughly, and happy trading!
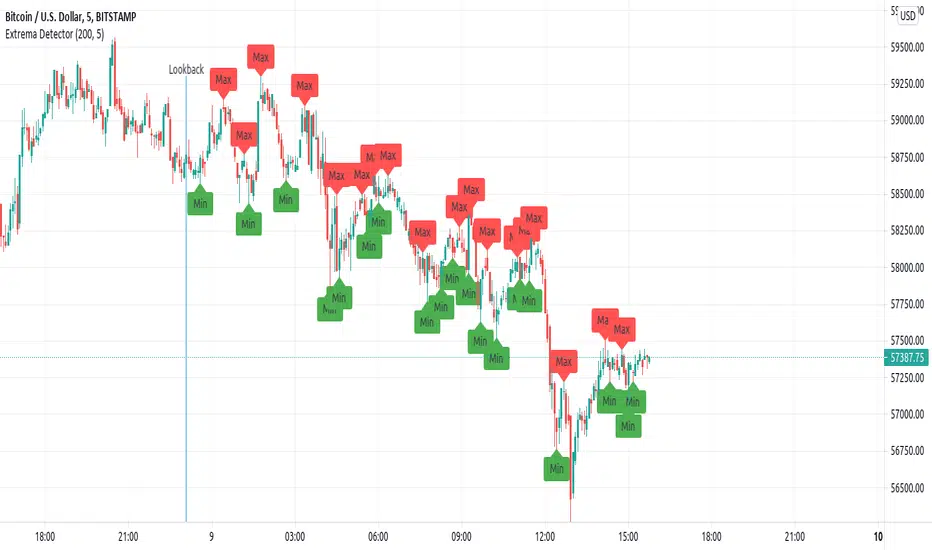
Extremevalues

Extrema DetectorDetermines local maximums and minimums points in the chart.
Parameters:
lookback : number of candlesticks to look.
extrema_finder_sensivity : If lower, more extreme points will be found (may over-find).
Brief algorithm description:
Computes a Simple Moving Average (length= extrema_finder_sensivity ), and searches for its local extremes.
Given some SMA extreme, it looks the previous extrema_finder_sensivity candlesticks to find the highest (or lowest value).
Notes:
Is a lagged indicator: determining if the current candlestick have reach a maximum can be delayed to, at most extrema_finder_sensivity -further candlesticks.
ATR Volatility Spectrum
This indicator estimates price volatility and it is based on ATR only.
The advantage of this indicator is that it can be used with any pair, any time frame.
The fluctuations of a short period ATR with respect to a gently ATR with high period
are calculated.
The only parameters are the periods of the reference ATR and fast ATR, which could be
safely let untouched and modified by experts.
RED areas depict low volatility
GREEN areas depict high volatility.
When the clouds are outside the region delimited by the aqua lines we have
extreme conditions:
Extremely low volatility = red cloud outside the aqua bands
Extremely high volatility = green cloud outside the aqua bands
Vitelot/yanez/Vts December 2018.
Hitting the like button is free act of gratitude
