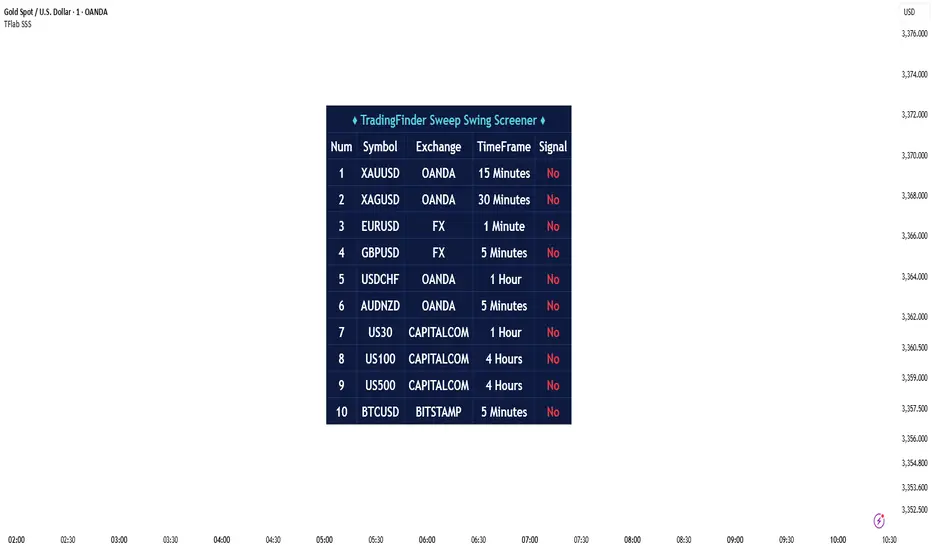
Sweep Swing Screener [TradingFinder]🔵 Introduction
Understanding how liquidity forms and how price reacts around key structural levels is essential for identifying precise, low-risk entry points. The Sweep Swing Screener is a specialized tool developed to continuously monitor market activity and detect liquidity sweeps, reaction zones, and valid confirmation candles across various trading instruments and timeframes.
This tool can be applied both to scan multiple symbols at once and to analyze all timeframes of a specific asset for potential reversal points. It begins by identifying a clear swing point, whether a swing high or a swing low, and then outlines a reaction zone between that level and either the highest or lowest value of the swing candle's open or close.
If the price revisits this zone, performs a liquidity grab, and prints an indecision candle like a doji or a narrow-bodied bar that closes within the zone, this may indicate a rejection of the level and the failure of a breakout attempt. At that moment, depending on the context, the screener may identify a bullish or bearish reversal and generate a corresponding Long or Short signal.
By emphasizing accurate entry timing, alignment with institutional order flow, and avoidance of common traps, this approach highlights market areas where liquidity engineering, reversal probability, and price inefficiency come together. As a result, the Sweep Swing Screener becomes a valuable part of any trader’s toolkit, particularly for those who rely on price action and liquidity logic to drive their decisions. It allows traders to focus on clean, actionable setups without getting lost in noise or misleading breakouts.
🔵 How to Use
The Sweep Swing Screener is designed to track market structure in real time and alert users when conditions for a potential reversal are present. Its methodology combines liquidity behavior with swing analysis and candle confirmation, all within predefined reaction zones.
To better understand this logic, consider a basic market flow where a swing high or low forms, followed by a return to that level. If the price sweeps the previous extreme and forms a confirming candle within the reaction zone, a signal is issued.
🟣 Long Signal
To identify a long setup, the screener looks for a valid swing low, often a level below which sell-side liquidity is likely to be clustered. Once found, it defines a reaction zone from the swing low to the lowest point between the candle’s open and close.
If the price returns to this area and creates a lower wick that extends beneath the swing low, the tool checks whether the price manages to close back inside the range, rejecting the breakdown. This indicates absorption of selling pressure and failure to sustain the move lower.
The screener then waits for a confirmation candle to appear. Typically, this is a doji or other small-bodied candle that closes inside the zone. If these conditions are met, the screener records a Long signal for that asset and, if enabled, sends a notification to alert the user.
🟣 Short Signal
For bearish setups, the screener begins by identifying a valid swing high, which usually marks a level where buy-side liquidity is concentrated. It then creates a reaction zone from the swing high to the highest point between the candle’s open and close.
When price returns to this level, sweeps above the swing high, and then fails to close higher, it may signal the presence of a bull trap and early exhaustion in the upward move.
A confirmation candle, usually a doji or a rejection bar that closes back within the zone, is then required. Once that occurs, the screener marks the asset with a Short signal and optionally sends a real-time alert to the user.
This type of setup helps highlight potential institutional sell zones, offering insight into where price is likely to reverse following a liquidity event.
🔵 Settings
🟣 Logical settings
Swing period : You can set the swing detection period.
Max Swing Back Method : It is in two modes "All" and "Custom". If it is in "All" mode, it will check all swings, and if it is in "Custom" mode, it will check the swings to the extent you determine.
Max Swing Back : You can set the number of swings that will go back for checking.
Maximum Distance Between Swing and Signal : The maximum number of candles allowed between the swing point and the potential signal. The default value is 50, ensuring that only recent and relevant price reactions are considered valid.
🟣 Display Settings
Table Size : Lets you adjust the table’s visual size with options such as: auto, tiny, small, normal, large, huge.
Table Position : Sets the screen location of the table. Choose from 9 possible positions, combining vertical (top, middle, bottom) and horizontal (left, center, right) alignments.
🟣 Symbol Settings
Each of the 10 symbol slots comes with a full set of customizable parameters :
Symbol : Define or select the asset (e.g., XAUUSD, BTCUSD, EURUSD, etc.).
Timeframe : Set your desired timeframe for each symbol (e.g., 15, 60, 240, 1D).
🟣 Alert Settings
Alert : Enables alerts for SSS.
Message Frequency : Determines the frequency of alerts. Options include 'All' (every function call), 'Once Per Bar' (first call within the bar), and 'Once Per Bar Close' (final script execution of the real-time bar). Default is 'Once per Bar'.
Show Alert Time by Time Zone : Configures the time zone for alert messages. Default is 'UTC'.
🔵 Conclusion
The Sweep Swing Screener provides a systematic method for identifying potential reversal zones by combining price structure, liquidity behavior, and candle-based confirmation. In markets that are often noisy and full of failed breakouts, focusing on these three elements helps clarify directional bias and supports more confident decision-making.
With the ability to scan multiple symbols and timeframes efficiently, this tool allows traders to stay focused on high-quality setups without the need to manually sift through dozens of charts. The inclusion of optional alerts further enhances its utility by offering timely updates when criteria are met.
By moving away from reactive strategies and toward structural anticipation, this screener supports traders who align their methods with institutional logic and the mechanics of smart money.
Fakebreakout
True Breakout Pattern [TradingFinder] Breakout Signal Indicator🔵 Introduction
In many market conditions, what initially appears to be a decisive breakout often turns out to be nothing more than a false breakout or fake breakout. Price breaks through a key swing level or an important support and resistance zone, only to quickly return to its previous range.
These failed breakouts, which are often the result of liquidity traps or market manipulation, serve more as a warning sign of structural weakness than confirmation of a new trend.
This indicator is designed around the concept of the fake breakout.
The logic is simple but precise : when price breaks a swing level and returns to that level within a maximum of five candles, the move is considered a false breakout. At this point, a Fibonacci retracement is applied to the recent price swing to evaluate the pullback area.
If price, within ten candles after the return to the breakout level, enters the Fibonacci zone between 0.618 and 1.0, the setup becomes valid for a potential entry. This area is identified as a long entry zone, with the stop loss placed just beyond the 1.0 level and the take profit defined based on the desired risk-to-reward ratio.
By combining accurate detection of false breakouts, analysis of price reaction to swing levels, and alignment with Fibonacci retracement logic, this framework allows traders to identify opportunities often missed by others. In a market where failed breakouts are a common and recurring phenomenon, this indicator aims to transform these traps into measurable trading opportunities.
Long Setup :
Short Setup :
🔵 How to Use
This indicator operates based on the recognition of false breakouts from structural levels in the market, specifically swing levels, and combines that with Fibonacci retracement analysis.
In this strategy, trades are only considered when price returns to the broken level within a defined time window and reacts appropriately inside a predefined Fibonacci range. Depending on the direction of the initial breakout, the system outlines two scenarios for long and short setups.
🟣 Long Setup
In the long setup, price initially breaks below a support level or swing low. If the price returns to the broken level within a maximum of five candles, the move is identified as a fake breakout.
At this stage, a Fibonacci retracement is drawn from the recent high to the low. If price, within ten candles of returning to the level, moves into the 0.618 to 1.0 Fibonacci zone, the conditions for a long entry are met.
The stop loss is placed slightly below the 1.0 level, while the take profit is set based on the trader’s preferred risk-reward ratio. This setup aims to capture deeply discounted entries at low risk, aligned with smart money reversals.
🟣 Short Setup
In the short setup, the price breaks above a resistance level or swing high. If the price returns to that level within five candles, the move is again treated as a false breakout. Fibonacci is then drawn from the recent low to the high to observe the retracement area.
Should price enter the 0.618 to 1.0 Fibonacci range within ten candles of returning, a short entry is considered valid. In this case, the stop loss is placed just above the 1.0 level, and the take profit is adjusted based on the intended risk-reward target. This method allows traders to identify high-probability short setups by focusing on failed breakouts and deep pullbacks.
🔵 Settings
🟣 Logical settings
Swing period : You can set the swing detection period.
Valid After Trigger Bars : Limits how many candles after a fake breakout the entry zone remains valid.
Max Swing Back Method : It is in two modes "All" and "Custom". If it is in "All" mode, it will check all swings, and if it is in "Custom" mode, it will check the swings to the extent you determine.
Max Swing Back : You can set the number of swings that will go back for checking.
🟣 Display settings
Displaying or not displaying swings and setting the color of labels and lines.
🟣 Alert Settings
Alert False Breakout : Enables alerts for Breakout.
Message Frequency : Determines the frequency of alerts. Options include 'All' (every function call), 'Once Per Bar' (first call within the bar), and 'Once Per Bar Close' (final script execution of the real-time bar). Default is 'Once per Bar'.
Show Alert Time by Time Zone : Configures the time zone for alert messages. Default is 'UTC'.
🔵 Conclusion
A sound understanding of the false breakout phenomenon and its relationship to structural price behavior is essential for technical traders aiming to improve precision and consistency. Many poor trading decisions stem from misinterpreting failed breakouts and entering too early into weak signals.
A structured approach, grounded in the analysis of swing levels and validated through specific price action and timing rules, can turn these misleading moves into valuable trade opportunities.
This indicator, by combining fake breakout detection with time filters and Fibonacci-based retracement zones, helps traders only engage with the market when multiple confirming factors are in alignment. The result is a strategy that emphasizes probability, risk control, and clarity in decision-making, offering a solid edge in navigating today’s volatile markets.

ICT Setup 04 [TradingFinder] SFP Sweep Liquidity Fake CHoCH/BOS🔵 Introduction
In smart money and ICT based trading, liquidity is never random. Some of the most meaningful market moves begin with a liquidity sweep where price intentionally hunts a previous swing high or swing low to trigger stop loss orders and absorb volume.
This manipulation is often followed by a sharp reversal from a reaction zone, creating ideal conditions for a high probability entry. This indicator is built to detect exactly that. It identifies a valid swing point and defines a reaction zone where price is likely to react.
For short setups, the zone lies between the swing high and the maximum of the candle’s open or close. For long setups, it’s drawn from the swing low to the minimum of the open or close.
When price returns to this zone and forms a qualified confirmation candle typically a doji or a small bodied candle that closes inside the zone while sweeping the liquidity this is a potential sign of reversal.
The candle must show both the sweep and the inability to hold above or below the key level, signaling a fake breakout or failed move. By combining elements of liquidity hunt, reaction zone rejection, and candle based entry confirmation, this tool highlights sniper entry points used by smart money to trap retail traders and reverse the trend. It helps filter out noise and enhances timing, making it ideal for trading in alignment with institutional order flow.
Long Position :
Short Position :
🔵 How to Use
This indicator is designed to highlight precise moments where price sweeps liquidity and reacts within a high probability reversal zone. By identifying clean swing highs and lows and defining a smart reaction zone around them, it filters out weak fakeouts and focuses only on setups with strong institutional footprints.
The tool works best when combined with market structure analysis and is suitable for both scalping and intraday trading. Below is a breakdown of how to interpret the signals for long and short positions based on the visual setups provided.
🟣 Long Setup
In a long setup, the indicator first detects a valid swing low where liquidity has likely accumulated below. A reaction zone is then drawn between the swing low and the minimum of the open or close of the swing candle.
When price returns to this zone, it must sweep the previous low and form a precise confirmation candle, such as a doji or a small bodied candle, that closes inside the zone. This candle must also reject the lower level, showing failure to continue downward.
As shown in the chart, once the liquidity grab is complete and the confirmation candle forms, a clean long signal is issued, indicating a potential bullish reversal backed by smart money behavior.
🟣 Short Setup
In a short setup, the indicator identifies a swing high where buy-side liquidity is resting. It then constructs a reaction zone between the high and the maximum of the open or close of the swing candle. Price must return to this zone, sweep the swing high, and form a bearish confirmation candle inside the zone.
A classic example is a doji or rejection candle that traps breakout buyers and fails to hold above the previous high. In the provided chart, the price aggressively hunts the liquidity above the swing high, but the close within the reaction zone signals exhaustion, prompting a short signal with high reversal probability.
These setups represent moments where price action, liquidity behavior, and candle structure align to offer strong entries. By focusing on clean sweeps and reactive confirmations, the indicator helps traders stay on the side of smart money and avoid common breakout traps.
🔵 Settings
🟣 Logical settings
Swing period : You can set the swing detection period.
Max Swing Back Method : It is in two modes "All" and "Custom". If it is in "All" mode, it will check all swings, and if it is in "Custom" mode, it will check the swings to the extent you determine.
Max Swing Back : You can set the number of swings that will go back for checking.
Maximum Distance Between Swing and Signal :The maximum number of candles allowed between the swing point and the potential signal. The default value is 50, ensuring that only recent and relevant price reactions are considered valid.
🟣 Display settings
Displaying or not displaying swings and setting the color of labels and lines.
🟣 Alert Settings
Alert SFP : Enables alerts for Swing Failure Pattern.
Message Frequency : Determines the frequency of alerts. Options include 'All' (every function call), 'Once Per Bar' (first call within the bar), and 'Once Per Bar Close' (final script execution of the real-time bar). Default is 'Once per Bar'.
Show Alert Time by Time Zone : Configures the time zone for alert messages. Default is 'UTC'.
🔵 Conclusion
This indicator is built for traders who rely on liquidity driven setups and smart money principles. By combining swing structure analysis with precision reaction zones and strict entry confirmation, it isolates the exact moments where price sweeps liquidity and fails to continue. These are high value points where institutional activity often reveals itself, and retail traps unfold.
Unlike generic breakout tools, this script focuses on quality over quantity by requiring both a sweep of a swing high or low and a confirmed rejection candle that closes inside a predefined zone. With customizable swing depth, proximity filters, visual highlights, and alert functions, it offers a complete framework for identifying and acting on fake breakouts with confidence. Whether you trade forex, crypto, or indices, this tool enhances your ability to align with true order flow and take entries where liquidity is most likely to shift.

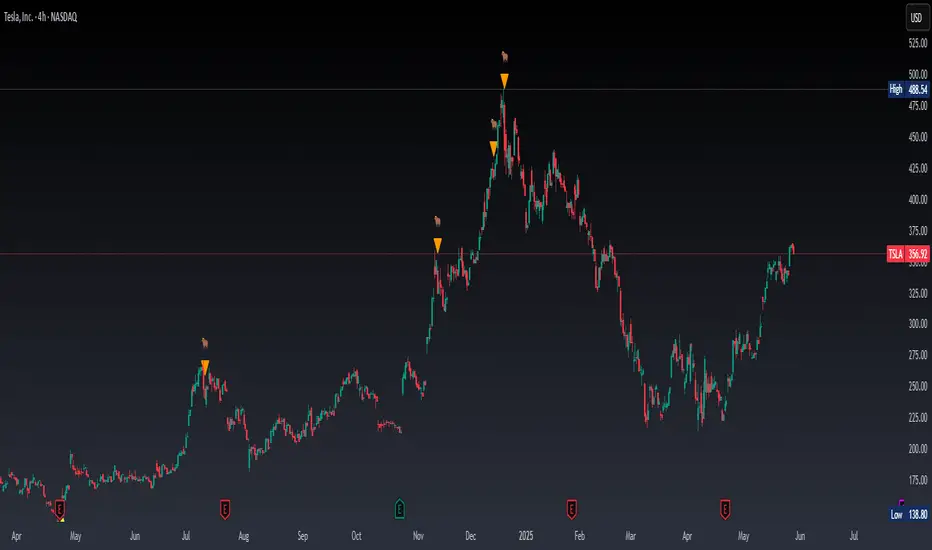
Real Time Swing Trap DetectorThe Real Time Swing Trap Detector is a minimalist, pro-grade tool for instantly spotting classic “bull traps” and “bear traps” on any chart.
This indicator identifies swing traps in real time by tracking significant swing highs and lows, then watching for fast, false breakouts (bull traps) and breakdowns (bear traps) within a user-defined window.
How it works:
Detects when price breaks a major swing high/low (using configurable lookback).
If price quickly reclaims the broken level within X bars (trap window), a trap is confirmed and a subtle icon (🐂 for bull, 🐻 for bear) is displayed on the chart—no labels, no clutter.
You can enable/disable alerts for bull/bear traps individually or together, and receive notifications the moment a trap is detected.
Use cases:
Spot and avoid classic market “fakeouts” that trap breakout traders.
Confirm SMC/ICT “Judas swing” setups, or filter for high-probability reversals.
Works on all timeframes and assets: stocks, crypto, forex, indices.
Inputs:
Swing Lookback Bars: How far back to define swing points (default: 50)
Major Swing Filter: Additional filter for only the most significant highs/lows (default: 200)
Trap Bars (Look Ahead): Window in which a trap must be confirmed (default: 10)
Enable Bull/Bear Trap Alerts: Toggle real-time alerts for each trap type.
Visuals:
🐻 icon below bar for bear trap (short squeeze/reversal)
🐂 icon above bar for bull trap (long squeeze/reversal)
How to set up alerts:
Add the indicator to your chart, open TradingView’s Alerts panel, and choose “Bear Trap Alert,” “Bull Trap Alert,” or “Any Trap Alert” for instant notifications.
False Breakouts [TradingFinder] Fake Breakouts Failure🔵 Introduction
Technical indicators are essential tools for analysts and traders in financial markets, helping them predict price movements and make better trading decisions. One of the key concepts in technical analysis that should be carefully considered is the "False Breakout."
This phenomenon occurs when a price temporarily breaks through a significant support or resistance level but fails to hold and quickly returns to its previous range. Understanding this concept and applying it in trading can reduce risks and increase profitability.
🟣 What is a False Breakout?
A Fake Breakout, as the name suggests, refers to a breakout that appears to occur but fails to sustain, leading the price to quickly revert back to its previous range. This situation often happens when inexperienced or non-professional traders, under psychological pressure and eager to enter the market quickly, initiate trades.
This creates opportunities for professional traders to take advantage of these short-term fluctuations and execute successful trades.
🟣 The Importance of Recognizing False Breakouts
Recognizing False Breakouts is crucial for any trader aiming for success in financial markets. False Breakouts typically occur when the market approaches a critical support or resistance level.
In these situations, many traders are waiting to see if the price will break through this level. However, when the price quickly returns to its previous range, it indicates weakness in the movement and the inability to sustain the breakout.
🟣 How to identify False Breakouts?
To identify Fake Breakouts, it is important to carefully analyze price charts and look for signs of a quick price reversal after breaking a key level.
Here are some chart patterns that may help you identify a False Breakout :
1. Pin Bar Pattern : The Pin Bar is a candlestick pattern that indicates a price reversal. This pattern usually appears near support and resistance levels, showing that the price attempted to break through a key level but failed and reversed.
2. Fakey Pattern : This pattern, which consists of several candlesticks, indicates a False Breakout and a quick price return to the previous range. It usually appears near key levels and can signal a trend reversal.
3. Using Multiple Timeframes : One way to identify False Breakouts is by using charts of different timeframes. Sometimes, a breakout on a one-hour chart may be a False Breakout on a daily chart. Analyzing charts across multiple timeframes can help you accurately identify this phenomenon.
🔵 How to Use
Once you identify a False Breakout, you can use it as a trading signal. For this, it is best to look for trading opportunities in the opposite direction of the False Breakout. In other words, if a False Breakout occurs at a resistance level, you might consider selling opportunities, and if it happens at a support level, you might look for buying opportunities.
Here are some key points for trading based on False Breakouts :
1. Patience and Discipline : Patience and discipline are crucial when trading with False Breakouts. Wait for the False Breakout to clearly form before entering a trade.
2. Use Stop Loss : Setting an appropriate stop loss is vital when trading based on False Breakouts. Typically, the stop loss can be placed near the level where the False Breakout occurred.
3. Seek Confirmations : Before entering a trade, look for additional confirmations. These can include other analyses or technical indicators that show the price is likely to return to its previous level.
🔵 Settings
🟣 Logical settings
Swing period : You can set the swing detection period.
Max Swing Back Method : It is in two modes "All" and "Custom". If it is in "All" mode, it will check all swings, and if it is in "Custom" mode, it will check the swings to the extent you determine.
Max Swing Bac k: You can set the number of swings that will go back for checking.
🟣 Display settings
Displaying or not displaying swings and setting the color of labels and lines.
🟣 Alert Settings
Alert False Breakout : Enables alerts for Breakout.
Message Frequency : Determines the frequency of alerts. Options include 'All' (every function call), 'Once Per Bar' (first call within the bar), and 'Once Per Bar Close' (final script execution of the real-time bar). Default is 'Once per Bar'.
Show Alert Time by Time Zone : Configures the time zone for alert messages. Default is 'UTC'.
🔵Conclusion
False Breakouts, as a key concept in technical analysis, are powerful tools for identifying sudden price changes and using them in trading. Understanding this phenomenon and applying it can help traders perform better in financial markets and avoid potential losses.
To benefit from False Breakouts, traders need to carefully analyze charts and use the appropriate analytical tools. By leveraging this strategy, traders can achieve lower-risk and higher-reward trades.

Wunder False Breakout1. The basic concept for this strategy is to use false breakout logic based on price levels.
2. We will enter a trade when the price exhibits a false breakout, where it initially breaks a level but then reverses direction.
3. The main concept of this strategy is to capitalize on false breakouts of price levels. The strategy involves building levels based on the highs and lows over a certain period. When these price levels appear to break out but then reverse, we use these false breakouts as entry points. You can adjust the period to find setups that suit your trading pair and timeframe.
4. A function for calculating risk on the portfolio (your deposit) has been added to the Wunder False Breakout. When this option is enabled, you get a calculation of the entry amount in dollars relative to your Stop Loss. In the settings, you can select the risk percentage on your portfolio. The loss will be calculated from the amount that will be displayed on the chart.
5. For example, if your deposit is $1000 and you set the risk to 1%, with a Stop Loss of 5%, the entry volume will be $200. The loss at SL will be $10. 10$, which is your 1% risk or 1% of the deposit.
Important! The risk per trade must be less than the Stop Loss value. If the risk is greater than SL, then you should use leverage.
The amount of funds entering the trade is calculated in dollars. This option was created if you want to send the dollar amount from Tradingview to the exchange. However, putting your volume in dollars you get the incorrect net profit and drawdown indication in the backtest results, as TradingView calculates the backtest volume in contracts.
To display the correct net profit and drawdown values in Tradingview Backtest results, use the ”Volume in contract” option.

Fake BreakoutThis indicator detect fake breakout on previous day high/low and option previous swing high and low
Rule Detect Fake Breakout On Previous Day High/Low Or Swing high low Fake Breakout -
1) Detect previous day high/low or swing high/low
2)
A) If price revisit on previous day high/swing high look for upside breakout after input
number of candle (1-5) price came back to previous high and breakout happen downside
it show sell because its fake breakout of previous day high or swing high
B) If price revisit on previous day low/swing low look for downside breakout after input
number of candle (1-5) price came back to previous low and breakout upside of previous
day low it show Buy because its fake breakout of previous day low or swing low
Disclaimer -Traders can use this script as a starting point for further customization or as a reference for developing their own trading strategies. It's important to note that past performance is not indicative of future results, and thorough testing and validation are recommended before deploying any trading strategy.

Fake breakHi Traders,
I've developed an indicator which can detect fake-breaks on the chart.
In the following you'll find the definition of the fake break candles and also you will find how to recognize it on the chart with practical examples.
What is the fake break pattern?
Sometimes support and resistance lines broke with a full body and strong candles that gives us the idea of sharp movements on the chart but suddenly the next candle returns all the path of the previous candle. in this case we can say fake break is happening on the chart.
This indicator detect fake break patterns based on two criteria:
1. It uses AverageTrueRange indicator to measure the strength of the pattern.
2. The returning candle should engulf minimum 75% of the break candle.
This indicator plot 2 terms in the name of "FB-D" and "FB-U" that are abbreviations of the "Fake Break Down" and "Fake Break Up".
You can also set alerts to get notified when fake breakout happens on the chart.
Notice: This pattern is only acceptable in valid support and resistance zones and you can not rely on it everywhere on the chart (specially in the middle of the waves).
Notice: The source code of this indicator is open and you are allowed to use it on your scripts by mentioning the name of author.
Disclaimer: This is not a financial advice or any signal to buy or sell, the goal of developing such an indicator is to use for educational purposes.

Volume Status by BobRivera990This indicator is a tool that shows a relative view of the trading volume and classifies the volume into 5 different levels and makes it easy to compare it in different periods.
It is also specifically designed for detecting failed (fake) breakouts.
How it works?
This tool uses something similar to Bollinger Bands , but with more bands.
I used two standard deviations (positive and negative) on either side of a simple moving average ( SMA ) of the trading volume .
I also used twice the standard deviation (negative and positive) on either side of the SMA to create more bands.
The classification is made as follows:
Usage:
This indicator is a tool to compare the volume , relatively and in different periods. It is also a good tool for detecting failed (fake) breakouts.
Fake Breakouts Occurs when a support or resistance is broken but the market does not accept and support these price changes. This lack of support will cause trading volume to decrease during or after the breakout.
So, if the indicator shows Low-Volume or Minor-Volume status at the time of the breakout or right after that, it may be a fake breakout.
The truth is you cannot avoid false breakouts completely as long as you trade breakouts but you can minimize the risk and the loss.
Thank you all for forming this unique community.
Parameters:
" Volume SMA Length " => The length of the simple moving average of the Volume

Matze BreakoutShows 2 different states of breakout:
Arrow = unusual volume, raising volume, positiv rate of change, standard deviation breakout
Bolt = very unusual volume, very high standard deviation breakout

FakeoutsWhat are Fakeouts?
As the name suggests, Fakeouts are breakouts that failed to continue beyond a level, resulting in a ‘false’ breakout. Traders who take long trades on breakout of the resistance level anticipate price to keep going up. A fake breakout (also known as ' Bull Trap ') happens when price reverses and starts falling instead of continuing to go up. Similarly, traders who take short trades on the breakdown of the support level anticipate price to keep going down. A fake breakdown (also known as ' Bear Trap ') happens when price reverses and starts rising instead of continuing to go down.
At present, the Fakeouts script is meant for identifying fake breakdowns. These are situations where price falls below the support line, but then reverses and starts rising. This will help users to go LONG on such fake breakdowns.
The script identifies breakdowns of the last 40 to 120 candles. The price must close above the high of the breakdown candle within 7 candles of the breakdown to be called a 'fake breakdown'. Users can also set alerts for such fake breakdowns on their chosen scrips. The script works on all timeframes.
The fake breakouts will be added soon to the script.
