SCOTTGO - Day Trade Stock Quote V4This Pine Script indicator, titled "SCOTTGO - Day Trade Stock Quote V4," is a comprehensive, customizable dashboard designed for active traders. It acts as a single, centralized reference point, displaying essential financial and technical data directly on your chart in a compact table overlay.
📊 Key Information Provided
The indicator is split into sections, aggregating various critical data points to provide a holistic picture of the stock's current state and momentum:
1. Ownership & Short Flow
This section provides fundamental context and short-interest data:
Market Cap, Shares Float, and Shares Outstanding: Key figures on the company's size and publicly tradable shares.
Short Volume %: Indicates the percentage of trading activity driven by short sellers.
Daily Change %: Shows the day's price movement relative to the previous close.
2. Price & Volatility
This tracks historical and immediate price levels:
Previous Close, Day High/Low: Key daily reference prices.
52-Week High/Low: Important long-term boundaries.
Earnings Date: A crucial fundamental date (currently displayed as a placeholder).
3. Momentum & Volume
These metrics are essential for understanding intraday buying and selling pressure:
Volume & Average Volume: The current trade volume compared to its historical average.
Relative Volume (RVOL): Measures how much volume is currently trading compared to the average rate for that time period (shown for both Daily and 5-Minute rates).
Volume Buzz (%): A percentage representation of how much current volume exceeds or falls below the average.
ADR % & ATR %: Measures of volatility.
RSI, U/D Ratio, and P/E Ratio: Momentum and valuation indicators.
4. Context
This provides background information on the security:
Includes the Symbol, Exchange, Industry, and Sector (note: some fields use placeholder data as this information is not always available via Pine Script).
⚙️ Customization
The dashboard is highly customizable via the indicator settings:
You can control the visibility of every single metric using the Section toggles.
You can change the position (Top Left, Top Right, etc.), size, and colors of the entire table.
In summary, this script is a powerful tool for day traders who need to monitor a large number of fundamental, technical, and volatility metrics simultaneously without cluttering the main chart area.
Float

Float Rotation TrackerFloat Rotation Tracker - Quick Reference Guide
What is Float Rotation?
Float Rotation = Cumulative Daily Volume ÷ Float
Example:
Float = 5,000,000 shares
Day Volume = 7,500,000 shares
Rotation = 7.5M ÷ 5M = 1.5x (150%)
When rotation hits 1x (100%), every available share has theoretically changed hands at least once during the trading day.
Why It Matters
RotationMeaningImplication0.5x50% of float tradedInterest building1.0x 🔥Full rotationExtreme interest confirmed2.0x 🔥🔥Double rotationVery high volatility3.0x 🔥🔥🔥Triple rotationRare - maximum volatility
Key insight: High rotation on a low-float stock = explosive potential
Float Classification
Float SizeClassificationRotation Impact≤ 2M🔥 MICROExtremely volatile, fast rotation≤ 5M🔥 VERY LOWExcellent momentum potential≤ 10MLOWGood for rotation plays> 10MNORMALNeeds massive volume to rotate
Rule of thumb: Focus on stocks with float under 10M for meaningful rotation signals.
Reading the Indicator
Rotation Line (Yellow)
Shows current rotation level
Rises throughout the day as volume accumulates
Crosses horizontal level lines at milestones
Level Lines
LineColorMeaning0.5Gray dotted50% rotation1.0Orange solidFull rotation2.0Red solidDouble rotation3.0Fuchsia solidTriple rotation
Volume Bars (Bottom)
ColorMeaningGrayBelow average volumeBlueNormal volume (1-2x avg)GreenHigh volume (2-5x avg)LimeExtreme volume (5x+ avg)
Milestone Markers
Circles appear when rotation crosses key levels
Labels show "50%", "1x", "2x", "3x🔥"
Background Color
Changes as rotation increases
Darker = higher rotation level
Info Table Explained
FieldDescriptionFloatShare count + classification (MICRO/LOW/NORMAL)SourceAuto ✓ = TradingView data / Manual = user enteredRotationCurrent rotation with emoji indicatorRotation %Same as rotation × 100Day VolumeCumulative volume todayTo XxVolume needed to reach next milestoneBar RVolCurrent bar's relative volumeMilestonesWhich levels have been hit todayPer RotationShares equal to one full rotationEst. TimeBars until next milestone (at current pace)
Trading with Float Rotation
Entry Signals
Early Entry (Higher Risk, Higher Reward)
Rotation approaching 0.5x
Strong price action (bull flag, breakout)
Rising relative volume bars
Confirmation Entry (Lower Risk)
Rotation at or above 1x
Price holding above VWAP
Continuous green/lime volume bars
Late Entry (Highest Risk)
Rotation above 2x
Only enter on clear pullback pattern
Tight stop required
Exit Signals
Warning Signs:
Rotation very high (2x+) with declining volume bars
Reversal candle after milestone
Price breaking below key support
Volume bars turning gray/blue after being green/lime
Take Profits:
Partial profit at each rotation milestone
Trail stop as rotation increases
Full exit on reversal pattern after 2x+ rotation
Best Setups
Ideal Float Rotation Play
✓ Float under 10M (preferably under 5M)
✓ Stock up 5%+ on the day
✓ News catalyst driving interest
✓ Rotation approaching or exceeding 1x
✓ Price above VWAP
✓ Volume bars green or lime
✓ Clear chart pattern (bull flag, flat top)
Red Flags to Avoid
✗ Float over 50M (hard to rotate meaningfully)
✗ Rotation high but price declining
✗ Volume bars turning gray after spike
✗ No clear catalyst
✗ Price below VWAP with high rotation
✗ Late in day (3pm+) after 2x rotation
Float Data Sources
If auto-detect doesn't work, get float from:
SourceHow to FindFinvizfinviz.com → ticker → "Shs Float"Yahoo FinanceFinance.yahoo.com → Statistics → "Float"MarketWatchMarketwatch.com → ticker → ProfileYour BrokerUsually in stock details/fundamentals
Note: Float can change due to offerings, buybacks, lockup expirations. Check recent data.
Settings Guide
Conservative Settings
Alert Level 1: 0.75 (75%)
Alert Level 2: 1.0 (100%)
Alert Level 3: 2.0 (200%)
Alert Level 4: 3.0 (300%)
High Vol Multiplier: 2.0
Extreme Vol Multiplier: 5.0
Aggressive Settings
Alert Level 1: 0.3 (30%)
Alert Level 2: 0.5 (50%)
Alert Level 3: 1.0 (100%)
Alert Level 4: 2.0 (200%)
High Vol Multiplier: 1.5
Extreme Vol Multiplier: 3.0
Alert Setup
Recommended Alerts
100% Rotation (1x) - Primary signal
Most important milestone
Confirms extreme interest
High Rotation + Extreme Volume
Combined condition
Very high probability signal
How to Set
Right-click chart → Add Alert
Condition: Float Rotation Tracker
Select desired milestone
Set notification (popup/email/phone)
Set expiration
Common Questions
Q: Why is my float showing "Manual (no data)"?
A: TradingView doesn't have float data for this stock. Enter the float manually in settings after looking it up on Finviz or Yahoo Finance.
Q: The rotation seems too high/low - is the float wrong?
A: Possibly. Cross-check float on Finviz. Recent offerings or share structure changes may not be reflected in TradingView's data.
Q: What if float rotates early in the day?
A: Early 1x rotation (within first hour) is very bullish - indicates massive interest. Watch for continuation patterns.
Q: High rotation but price is dropping?
A: This is distribution - large holders are selling into demand. High rotation doesn't guarantee price direction, just volatility.
Q: Can I use this for swing trading?
A: The indicator resets daily, so it's designed for intraday use. You could note multi-day rotation patterns manually.
Quick Decision Matrix
RotationPrice ActionVolumeDecision<0.5xStrong upHighWatch, early stage0.5-1xConsolidatingSteadyPrepare entry1x+Breaking outIncreasingEntry on pattern1x+DroppingHighAvoid - distribution2x+Strong upExtremePartial profit, trail stop2x+Reversal candleDecliningExit or avoid
Workflow Integration
MORNING ROUTINE:
1. Scan for gappers (5%+, high volume)
2. Check float on each candidate
3. Apply Float Rotation Tracker
4. Prioritize lowest float with building rotation
DURING SESSION:
5. Watch rotation levels on active trades
6. Enter on patterns when rotation confirms (0.5-1x)
7. Scale out as rotation increases
8. Exit or trail after 2x rotation
END OF DAY:
9. Note which stocks hit 2x+ rotation
10. Review rotation vs price action
11. Learn patterns for future trades
Combining with Other Indicators
IndicatorHow to Use Together5 PillarsScreen for low-float stocks firstGap & GoCheck rotation on gappersBull FlagEnter bull flags with 1x+ rotationVWAPOnly trade rotation plays above VWAPRSIWatch for divergence at high rotation
Key Takeaways
Float size matters - Lower float = faster rotation = more volatility
1x is the key level - Full rotation confirms extreme interest
Volume quality matters - Green/lime bars better than gray
Combine with price action - Rotation confirms, patterns trigger
Know when you're late - 2x+ rotation is late stage
Check your float data - Wrong float = wrong rotation calculation
Happy Trading! 🔥

Swing Data - SimplifiedThe swing data indicator by jfsrev but simplified. Thank you jfsrev for your work!
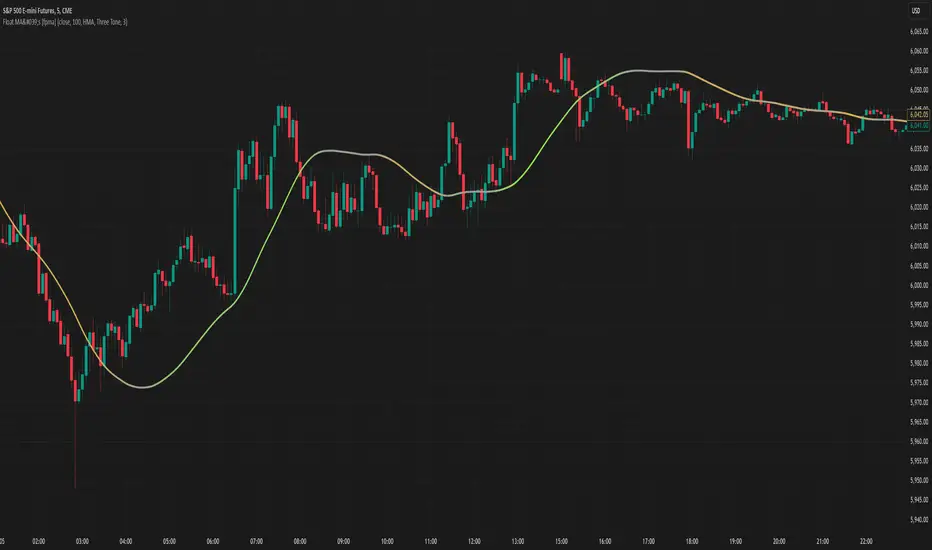
Moving Averages With Continuous Periods [macp]This script reimagines traditional moving averages by introducing floating-point period calculations, allowing for fractional lengths rather than being constrained to whole numbers. At its core, it provides SMA, WMA, and HMA variants that can work with any decimal length, which proves especially valuable when creating dynamic indicators or fine-tuning existing strategies.
The most significant improvement lies in the Hull Moving Average implementation. By properly handling floating-point mathematics throughout the calculation chain, this version reduces the overshoot tendencies that often plague integer-based HMAs. The result is a more responsive yet controlled indicator that better captures price action without excessive whipsaw.
The visual aspect incorporates a trend gradient system that can adapt to different trading styles. Rather than using fixed coloring, it offers several modes ranging from simple solid colors to more nuanced three-tone gradients that help identify trend transitions. These gradients are normalized against ATR to provide context-aware visual feedback about trend strength.
From a practical standpoint, the floating-point approach eliminates the subtle discontinuities that occur when integer-based moving averages switch periods. This makes the indicator particularly useful in systems where the MA period itself is calculated from market conditions, as it can smoothly transition between different lengths without artificial jumps.
At the heart of this implementation lies the concept of continuous weights rather than discrete summation. Traditional moving averages treat each period as a distinct unit with integer indexing. However, when we move to floating-point periods, we need to consider how fractional periods should behave. This leads us to some interesting mathematical considerations.
Consider the Weighted Moving Average kernel. The weight function is fundamentally a slope: -x + length where x represents the position in the averaging window. The normalization constant is calculated by integrating (in our discrete case, summing) this slope across the window. What makes this implementation special is how it handles the fractional component - when the length isn't a whole number, the final period gets weighted proportionally to its fractional part.
For the Hull Moving Average, the mathematics become particularly intriguing. The standard HMA formula HMA = WMA(2*WMA(price, n/2) - WMA(price, n), sqrt(n)) is preserved, but now each WMA calculation operates in continuous space. This creates a smoother cascade of weights that better preserves the original intent of the Hull design - to reduce lag while maintaining smoothness.
The Simple Moving Average's treatment of fractional periods is perhaps the most elegant. For a length like 9.7, it weights the first 9 periods fully and the 10th period at 0.7 of its value. This creates a natural transition between integer periods that traditional implementations miss entirely.
The Gradient Mathematics
The trend gradient system employs normalized angular calculations to determine color transitions. By taking the arctangent of price changes normalized by ATR, we create a bounded space between 0 and 1 that represents trend intensity. The formula (arctan(Δprice/ATR) + 90°)/180° maps trend angles to this normalized space, allowing for smooth color transitions that respect market volatility context.
This mathematical framework creates a more theoretically sound foundation for moving averages, one that better reflects the continuous nature of price movement in financial markets. The implementation recognizes that time in markets isn't truly discrete - our sampling might be, but the underlying process we're trying to measure is continuous. By allowing for fractional periods, we're creating a better approximation of this continuous reality.
This floating-point moving average implementation offers tangible benefits for traders and analysts who need precise control over their indicators. The ability to fine-tune periods and create smooth transitions makes it particularly valuable for automated systems where moving average lengths are dynamically calculated from market conditions. The Hull Moving Average calculation now accurately reflects its mathematical formula while maintaining responsiveness, making it a practical choice for both systematic and discretionary trading approaches. Whether you're building dynamic indicators, optimizing existing strategies, or simply want more precise control over your moving averages, this implementation provides the mathematical foundation to do so effectively.
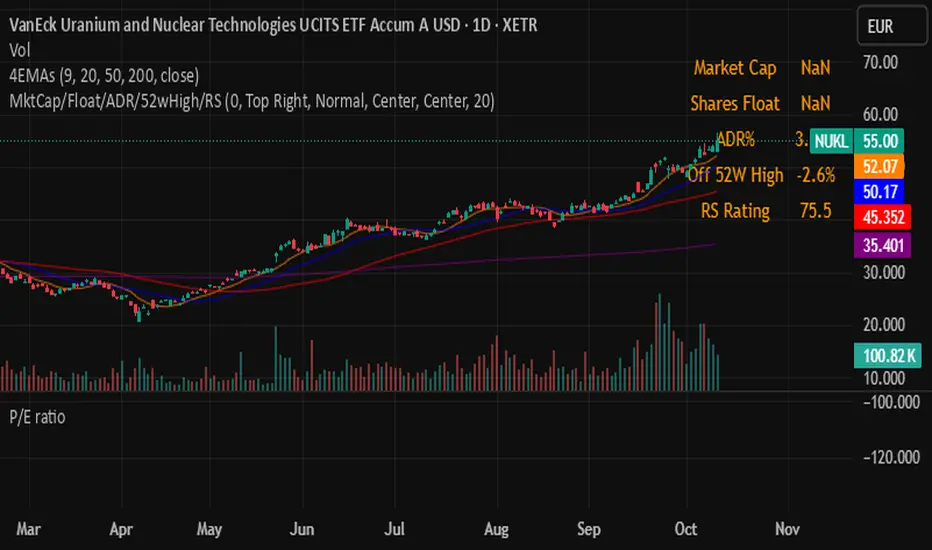
Performance IndicatorsDescription:
The Performance Indicators tool provides traders with a comprehensive overview of both fundamental and technical performance metrics of a security. This dual approach helps traders make informed decisions by evaluating the security's intrinsic value as well as its market behavior.
Fundamental Performance Indicators:
EPS Year Over Year % Growth : Measures the percentage growth in earnings per share (EPS) compared to the same quarter in the previous year. This helps in understanding the company's profitability trends.
EPS 3 Quarters Year Over Year % Growth : Analyzes the percentage growth in EPS over the last three quarters compared to the same quarters in the previous year, providing insight into the company's recent earnings performance.
Sales Year Over Year % Growth : Tracks the percentage growth in sales compared to the same quarter in the previous year, offering a view of the company's revenue trends.
Sales 3 Quarters Year Over Year % Growth : Evaluates the percentage growth in sales over the last three quarters compared to the same quarters in the previous year, helping to assess the company's recent revenue performance.
Return On Equity (ROE) : Measures the company's profitability by comparing net income to shareholder equity. This indicates how effectively the company is using its equity base to generate profits.
Market Capitalization : Represents the total market value of the company's outstanding shares, providing a sense of the company's size and market presence.
Float Shares Outstanding : Refers to the number of shares available for trading by the public, excluding restricted shares. This metric helps in understanding the liquidity and volatility of the stock.
Technical Performance Indicators:
Average Daily Range (ADR) %: Calculates the average range between the high and low prices over a specific period, expressed as a percentage. This helps in understanding the stock's daily volatility.
Average True Range (ATR) $ : Measures market volatility by calculating the average range between the high and low prices, taking into account any gaps in the price. It is expressed in dollar terms.
% Off 52-Week High : Indicates how far the current price is from the highest price achieved over the last 52 weeks, helping to assess the stock's current performance relative to its yearly peak.
Relative Price Strength (RPS) : Compares the stock's price performance to a benchmark index, helping to identify how the stock is performing relative to the broader market.
How it Works:
The fundamental performance indicators provide insights into the company's financial health and growth trends by analyzing key metrics such as EPS, sales growth, ROE, market capitalization, and float shares outstanding.
The technical performance indicators offer a view of the stock's market behavior and volatility through metrics like ADR, ATR, % off 52-week high, and RPS.
By combining these fundamental and technical metrics, traders can gain a well-rounded perspective on the security's overall performance.
How to Use:
Add the Performance Indicators tool to your chart.
Evaluate the fundamental indicators to assess the company's financial health and growth trends.
Analyze the technical indicators to understand the stock's market behavior and volatility.
Use the combined insights from both fundamental and technical indicators to make informed trading decisions.
This tool is particularly useful for traders who want to integrate both fundamental analysis and technical analysis into their trading strategy, providing a holistic view of a security's performance.
Volume as a Percent of Float by 3iauVolume as a Percent of Float
Plot the difference between current Chart Volume as a percent of Float/Outstanding and the moving average of the same.
Apply a multiplier to this value.
Plot the moving average of the difference between current Chart Volume as a percent of Float/Outstanding and the moving average of the same.
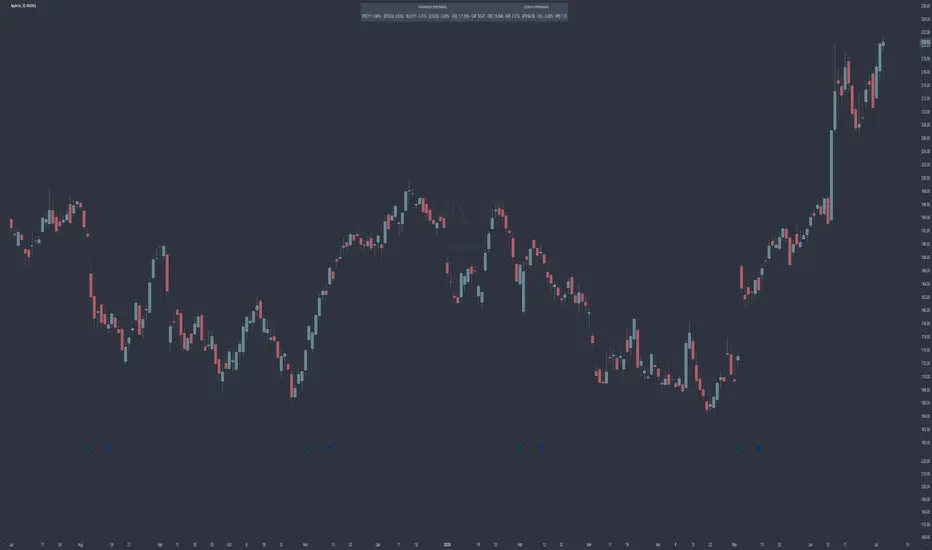
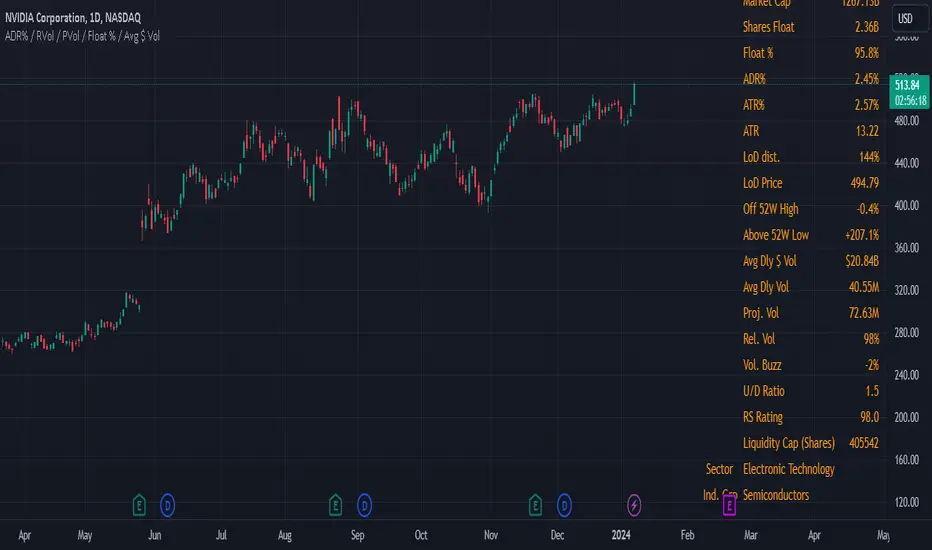
Swing Data - ADR% / RVol / PVol / Float % / Avg $ VolThis table presents consolidated data that swing traders can refer to quickly for their benefit. I am of the firm belief that the information provided in this uncomplicated table is precisely what you require to optimize your trading efficiency, and ultimately, profitability.
The data includes;
1. Market Capitalization - a measure of the total value of a publicly traded company's outstanding shares.
2. Float % - the percentage of a company's outstanding shares that are available for trading on the open market. It is calculated by dividing the number of a company's outstanding shares that are available for trading on the open market by the total number of outstanding shares. A lower float percentage generally means that there are fewer shares available for trading, which can lead to increased volatility in the stock price. On the other hand, a higher float percentage generally means that there are more shares available for trading, which can lead to greater stability in the stock price.
3. ADR% - a technical analysis indicator that measures the average daily price movement as a percentage of its current price. It is calculated by taking the difference between the average high and low prices for a time period, and then dividing it by the current price. The resulting value is then multiplied by 100 to give the ADR% for that day. The ADR% can be useful for traders to assess the potential volatility of a stock. A higher ADR% indicates a greater potential for price movement.
4. ATR - measures the range of price movements of an asset over a specified period of time, taking into account any gaps in price. It is calculated by taking the highest value of the following three values:
The difference between the current high and the current low
The absolute value of the difference between the current high and the previous close
The absolute value of the difference between the current low and the previous close
The resulting value is then averaged over the specified period of time to create the ATR value. This indicator is reflects the average volatility of the asset over the specified period of time.
5. LoD dist. - also refer to Low Of Day distance, a range level gauge of current price based on historical volatility of the price movement, in this case I use ATR. for the historical volatility. Please find below as example for the calculation.
eg. LoD dist. = 104%
Current price (A) = $24.49
Low Price (B) = $22.16
Difference (A) - (B) = $2.33
ATR = $2.25
LoD dist = $2.33 / $2.25 = 103.55% (round up to nearest whole number = 104%)
6. Average Daily $ Volume - used to measure the average amount of money that is traded in a stock or a security over a particular period of time, typically a day. It is calculated by multiplying the average daily trading volume of a security by its average price.
7. Average Daily Volume - used to measure the average no. of share that is traded in a stock or a security over a particular period of time, typically a day.
8. Projected Volume - an estimate of the total volume of trading activity that is expected to occur for the day (from the specific time data), based on an average volume over a specific period of time. Projected volume can be used by traders and investors to help make informed decisions about buying or selling securities, and can also be used as an indicator of market sentiment and volatility. However, it's important to note that projected volume is an estimate and actual trading activity may vary.
9. Relative Volume - a measure of the volume of a stock that is trading at the specific time, relative to its average trading volume over a longer period. It is expressed as a percentage and is often used by traders and investors to identify stocks that are trading with higher or lower than usual volume.
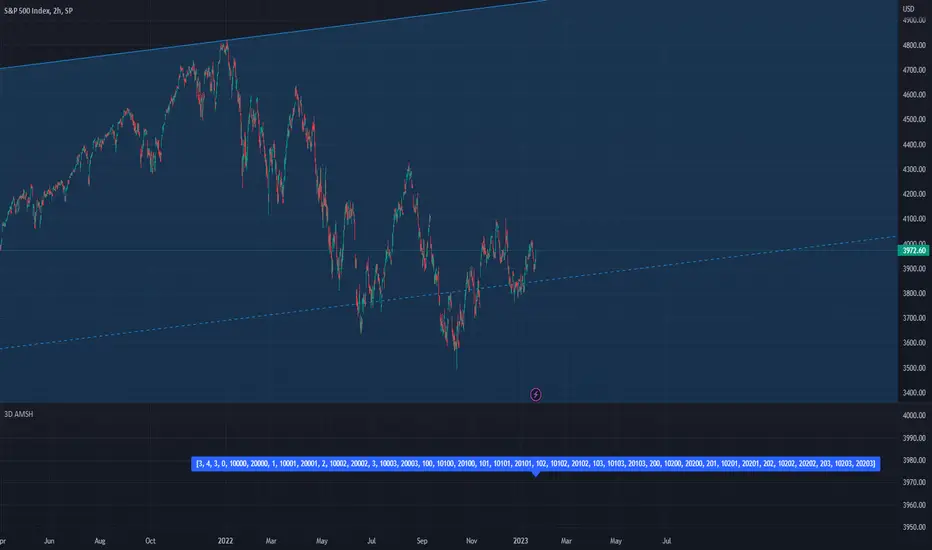
PSv5 3D Array/Matrix Super Hack"In a world of ever pervasive and universal deceit, telling a simple truth is considered a revolutionary act."
INTRO:
First, how about a little bit of philosophic poetry with another dimension applied to it?
The "matrix of control" is everywhere...
It is all around us, even now in the very place you reside. You can see it when you look at your digitized window outwards into the world, or when you turn on regularly scheduled television "programs" to watch news narratives and movies that subliminally influence your thoughts, feelings, and emotions. You have felt it every time you have clocked into dead end job workplaces... when you unknowingly worshiped on the conformancy alter to cultish ideologies... and when you pay your taxes to a godvernment that is poisoning you softly and quietly by injecting your mind and body with (psyOps + toxicCompounds). It is a fictitiously generated world view that has been pulled over your eyes to blindfold, censor, and mentally prostrate you from spiritually hearing the real truth.
What TRUTH you must wonder? That you are cognitively enslaved, like everyone else. You were born into mental bondage, born into an illusory societal prison complex that you are entirely incapable of smelling, tasting, or touching. Its a contrived monetary prison enterprise for your mind and eternal soul, built by pretending politicians, corporate CONartists, and NonGoverning parasitic Organizations deploying any means of infiltration and deception by using every tactic unimaginable. You are slowly being convinced into becoming a genetically altered cyborg by acclimation, socially engineered and chipped to eventually no longer be 100% human.
Unfortunately no one can be told eloquently enough in words what the matrix of control truly is. You have to experience it and witness it for yourself. This is your chance to program a future paradigm that doesn't yet exist. After visiting here, there is absolutely no turning back. You can continually take the blue pill BIGpharmacide wants you to repeatedly intake. The story ends if you continually sleep walk through a 2D hologram life, believing whatever you wish to believe until you cease to exist. OR, you can take the red pill challenge, explore "question every single thing" wonderland, program your arse off with 3D capabilities, ultimately ascertaining a new mathematical empyrean. Only then can you fully awaken to discover how deep the rabbit hole state of affairs transpire worldwide with a genuine open mind.
Remember, all I'm offering is a mathematical truth, nothing more...
PURPOSE:
With that being said above, it is now time for advanced developers to start creating their own matrix constructs in 3D, in Pine, just as the universe is created spatially. For those of you who instantly know what this script's potential is easily capable of, you already know what you have to do with it. While this is simplistically just a 3D array for either integers or floats, additional companion functions can in the future be constructed by other members to provide a more complete matrix/array library for millions of folks on TV. I do encourage the most courageous of mathemagicians on TV to do so. I have been employing very large 2D/3D array structures for quite some time, and their utility seems to be of great benefit. Discovering that for myself, I fully realized that Pine is incomplete and must be provided with this agility to process complex datasets that traders WILL use in the future. Mark my words!
CONCEPTION:
While I have long realized and theorized this code for a great duration of time, I was finally able to turn it into a Pine reality with the assistance and training of an "artificially intuitive" program while probing its aptitude. Even though it knows virtually nothing about Pine Script 4.0 or 5.0 syntax, functions, and behavior, I was able to conjure code into an identity similar to what you see now within a few minutes. Close enough for me! Many manual edits later for pine compliance, and I had it in chart, presto!
While most people consider the service to be an "AI", it didn't pass my Pine Turing test. I did have to repeatedly correct it, suffered through numerous apologies from it, was forced to use specifically tailored words, and also rationally debate AND argued with it. It is a handy helper but beware of generating Pine code from it, trust me on this one. However... this artificially intuitive service is currently available in its infancy as version 3. Version 4 most likely will have more diversity to enhance my algorithmic expertise of Pine wizardry. I do have to thank E.M. and his developers for an eye opening experience, or NONE of this code below would be available as you now witness it today.
LIMITATIONS:
As of this initial release, Pine only supports 100,000 array elements maximum. For example, when using this code, a 50x50x40 element configuration will exceed this limit, but 50x50x39 will work. You will always have to keep that in mind during development. Running that size of an array structure on every single bar will most likely time out within 20-40 seconds. This is not the most efficient method compared to a real native 3D array in action. Ehlers adepts, this might not be 100% of what you require to "move forward". You can try, but head room with a low ceiling currently will be challenging to walk in for now, even with extremely optimized Pine code.
A few common functions are provided, but this can be extended extensively later if you choose to undertake that endeavor. Use the code as is and/or however you deem necessary. Any TV member is granted absolute freedom to do what they wish as they please. I ultimately wish to eventually see a fully equipped library version for both matrix3D AND array3D created by collaborative efforts that will probably require many Pine poets testing collectively. This is just a bare bones prototype until that day arrives. Considerably more computational server power will be required also. Anyways, I hope you shall find this code somewhat useful.
Notice: Unfortunately, I will not provide any integration support into members projects at all. I have my own projects that require too much of my time already.
POTENTIAL APPLICATIONS:
The creation of very large coefficient 3D caches/buffers specifically at bar_index==0 can dramatically increase runtime agility for thousands of bars onwards. Generating 1000s of values once and just accessing those generated values is much faster. Also, when running dozens of algorithms simultaneously, a record of performance statistics can be kept, self-analyzed, and visually presented to the developer/user. And, everything else under the sun can be created beyond a developers wildest dreams...
EPILOGUE:
Free your mind!!! And unleash weapons of mass financial creation upon the earth for all to utilize via the "Power of Pine". Flying monkeys and minions are waging economic sabotage upon humanity, decimating markets and exchanges. You can always see it your market charts when things go horribly wrong. This is going to be an astronomical technical challenge to continually navigate very choppy financial markets that are increasingly becoming more and more unstable and volatile. Ordinary one plot algorithms simply are not enough anymore. Statistics and analysis sits above everything imagined. This includes banking, godvernment, corporations, REAL science, technology, health, medicine, transportation, energy, food, etc... We have a unique perspective of the world that most people will never get to see, depending on where you look. With an ever increasingly complex world in constant dynamic flux, novel ways to process data intricately MUST emerge into existence in order to tackle phenomenal tasks required in the future. Achieving data analysis in 3D forms is just one lonely step of many more to come.
At this time the WesternEconomicFraudsters and the WorldHealthOrders are attempting to destroy/reset the world's financial status in order to rain in chaos upon most nations, causing asset devaluation and hyper-inflation. Every form of deception, infiltration, and theft is occurring with a result of destroyed wealth in preparation to consolidate it. Open discussions, available to the public, by world leaders/moguls are fantasizing about new dystopian system as a one size fits all nations solution of digitalID combined with programmableDemonicCurrencies to usher in a new form of obedient servitude to a unipolar digitized hegemony of monetary vampires. If they do succeed with economic conquest, as they have publicly stated, people will be converted into human cattle, herded within smart cities, you will own nothing, eat bugs for breakfast/lunch/dinner, live without heat during severe winter conditions, and be happy. They clearly haven't done the math, as they are far outnumbered by a ratio of 1 to millions. Sith Lords do not own planet Earth! The new world disorder of human exploitation will FAIL. History, my "greatest teacher" for decades reminds us over, and over, and over again, and what are time series for anyways? They are for an intense mathematical analysis of prior historical values/conditions in relation to today's values/conditions... I imagine one day we will be able to ask an all-seeing AI, "WHO IS TO BLAME AND WHY AND WHEN?" comprised of 300 pages in great detail with images, charts, and statistics.
What are the true costs of malignant lies? I will tell you... 64bit numbers are NOT even capable of calculating the extreme cost of pernicious lies and deceit. That's how gigantic this monstrous globalization problem has become and how awful the "matrix of control" truly is now. ALL nations need a monumental revision of its CODE OF ETHICS, and that's definitely a multi-dimensional problem that needs solved sooner than later. If it was up to me, economies and technology would be developed so extensively to eliminate scarcity and increase the standard of living so high, that the notion of war and conflict would be considered irrelevant and extremely appalling to the future generations of humanity, our grandchildren born and unborn. The future will not be owned and operated by geriatric robber barons destined to expire quickly. The future will most likely be intensely "guided" by intelligent open source algorithms that youthful generations will inherit as their birth right.
P.S. Don't give me that politco-my-diction crap speech below in comments. If they weren't meddling with economics mucking up 100% of our chart results in 100% of tickers, I wouldn't have any cause to analyze any effects generated by them, nor provide this script's code. I am performing my analytical homework, but have you? Do you you know WHY international affairs are in dire jeopardy? Without why, the "Power of Pine" would have never existed as it specifically does today. I'm giving away much of my mental power generously to TV members so you are specifically empowered beyond most mathematical agilities commonly existing. I'm just a messenger of profound ideas. Loving and loathing of words is ALWAYS in the eye of beholders, and that's why the freedom of speech is enshrined as #1 in the constitutional code of the USA. Without it, this entire site might not have been allowed to exist from its founder's inceptions.
intoLibrary "into"
convert literals by type,
Same-types left in for bulk reasons.
TODO: Expand Types
b(string)
Convert string to bool.
Parameters:
string : val A string value.
Returns: Bool.
b(bool)
Pass Bool/bool
Parameters:
bool :
Returns: Bool.
b(float)
Convert Float (True if exists and not 0)
Parameters:
float : val A float value.
Returns: Bool.
b(int)
Convert integer (True if exists and not 0)
Parameters:
int : val An integer value.
Returns: Bool.
f(bool)
Convert bool to float.
Parameters:
bool : val A boolean value.
Returns: Float.
f(string, int)
Convert with decimal
Parameters:
string : val A string value.
int : decimals Decimal places. def = 6
Returns: Float.
f(float, int)
Convert float bypass with decimals
Parameters:
float : val A float value.
int : decimals Decimal places. def = 6
Returns: Float.
f(int)
Convert integer to float.
Parameters:
int : val An integer value.
Returns: Float.
i(bool)
Convert bool to int.
Parameters:
bool : val A boolean value.
Returns: Int.
i(string)
Convert string number to int.
Parameters:
string : val A string value.
Returns: Int.
i(float)
Convert float to int.
Parameters:
float : val A float value.
Returns: Int.
i(int)
Convert int to int.
Parameters:
int : val An int value.
Returns: Int.
s(bool)
Convert bool value to string.
Parameters:
bool : val A boolean value.
Returns: String.
s(str)
bypass string
Parameters:
str : val A string value.
Returns: String.
s(float)
Convert float value to string.
Parameters:
float : val A float value.
Returns: String.
s(int)
Convert int value to string.
Parameters:
int : val An integer value.
Returns: String.
s(val)
Array Convert Each Item
Parameters:
val : Array Input (Str,Bool,Int,Float)
Returns: String.
s(val)
Array Convert Each Item
Parameters:
val : Array Input (Str,Bool,Int,Float)
Returns: String.
s(val)
Array Convert Each Item
Parameters:
val : Array Input (Str,Bool,Int,Float)
Returns: String.
s(val)
Array Convert Each Item
Parameters:
val : Array Input (Str,Bool,Int,Float)
Returns: String.
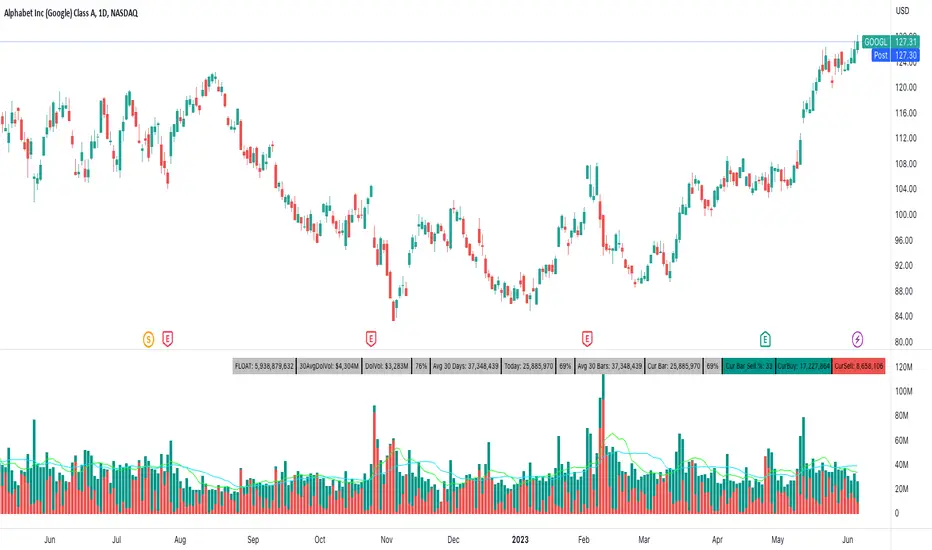
Buy/Sell Volume DetailsThis attempts to color buy and sell volume of each bar.
In addition to coloring the bars, the table shows average volumes for the past 30 days, current volume for the day, current bar volume, the float of the ticker, and dollar volume for the day and average 30 days. You can also plot a fast and slow moving average of volume.
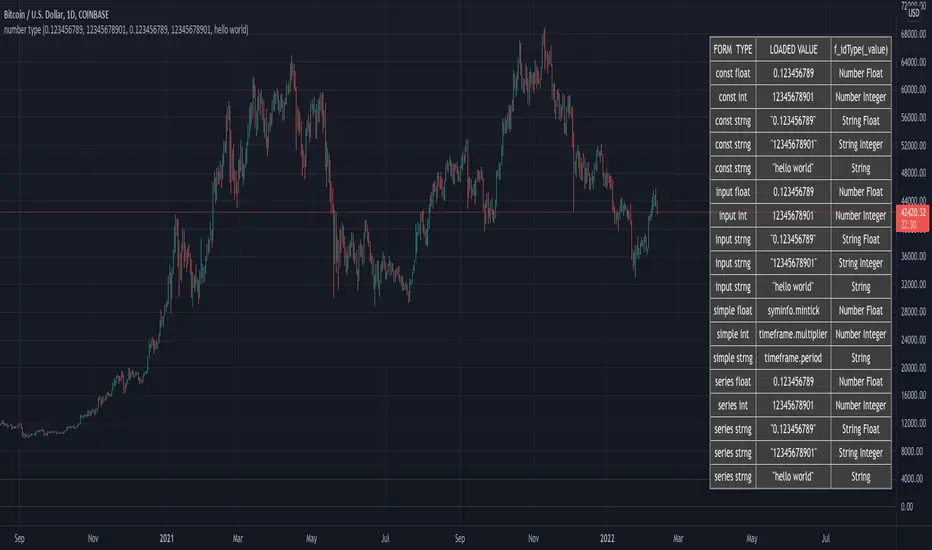
How To Identify Argument Type Of Number Using OverloadsExample overload functions accept loading of _value for types float, int, or string, then positively identifies the actual argument type of that specific loaded _value.

How To Identify Type Of NumberExample function accepts loading of _value for types float, int, or string, then identifies whether the loaded _value is a string number, string, or number.
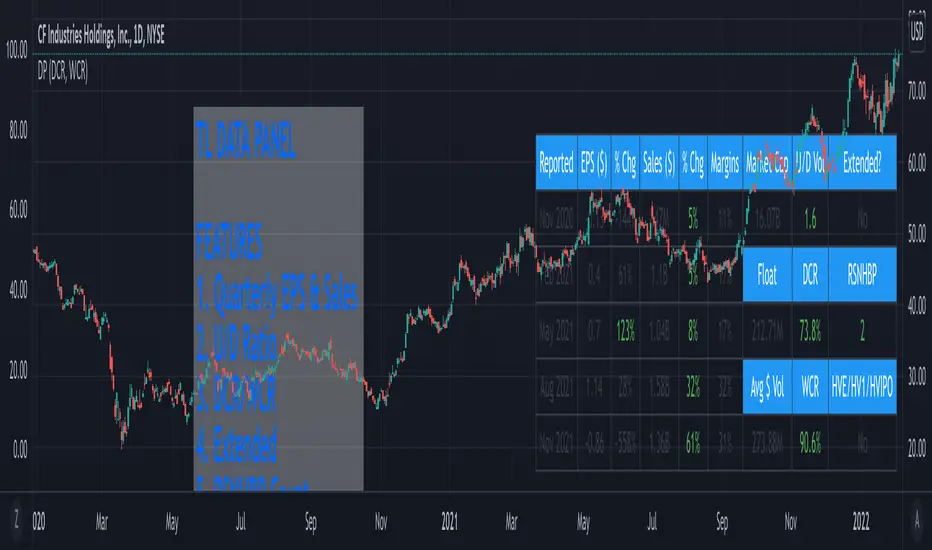
TL Data PanelIntroducing the TraderLion Data Panel
Features
1. Plot Quarterly EPS & Sales in a table. Disclaimer | TradingView data for EPS & Sales can be highly inaccurate in some cases.
2. U/D Ratio - Calculates the Up/Down Volume Ratio on a 50 Day Average or 20 Day Average. A number above 1.5 will show in green.
3. DCR - Calculates the Daily Closing Range for the stock. It's green when the DCR is greater than your benchmark (set in indicator settings) and greater than 50%.
4. WCR - Calculates the Weekly Closing Range for the stock. It's green when the DCR is greater than your benchmark (set in indicator settings) and greater than 50%.
5. Extended - Calculates if the stock is extended vs the 10DMA and 10WMA. The output will be Yes or No.
6. RSNHBP Count - Counts the number of RSNHBP in the past 30 sessions. Higher the count the better the odds of a stock performing well in the markets.
7. HV Stats - This shows if a stock meets the HVE/HV1/HVIPO criteria. HVE - Highest Volume Ever. HV1 - Highest Volume in One Year. HVIPO - Highest Volume Since IPO.
Customizations
Up Down Volume Length - Toggle between 50 Day or 20 Day.
Average $ Volume Length - Toggle between 50 Day or 20 Day.
Closing Range Benchmark - Set your benchmark vs any index.
RS Benchmark - Calculate RSNHBP benchmark vs any index.
Table Size - Tweak table size on personal preference.
Table Position - Tweak table position to top right, bottom left, bottom right, or top left.
Margins vs ROE - Toggle this setting to display Margins or ROE.
Color Theme - Toggle between Light or Dark Theme.
If you have any questions, please post them in the comments below!
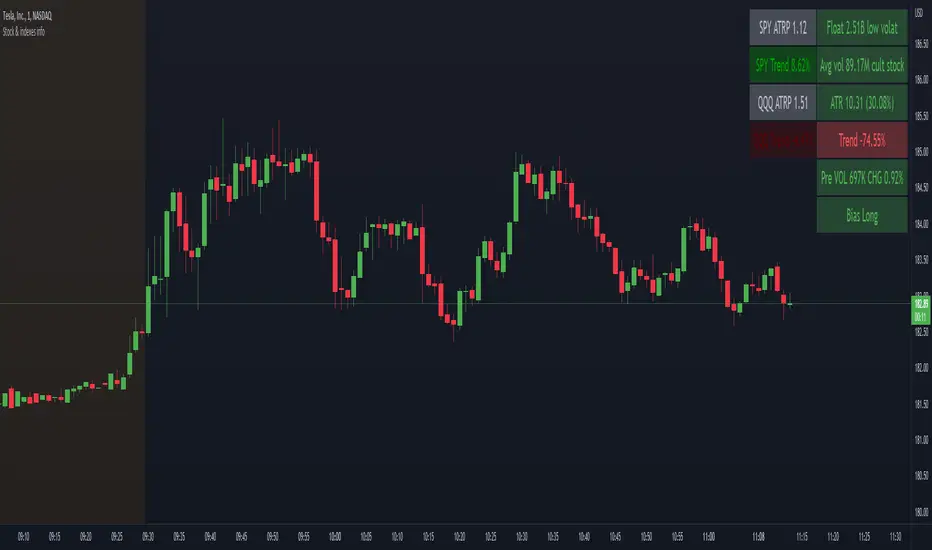
Stock float, avg volume, pre-market info and indexes atrp, trendNASDAQ:AAPL
This indicator shows the most usefull informations about the current symbol and the two common indexes (SPY and QQQ) in a table, in the upper right corner of the graph.
The informations are:
Symbol
Float
Daily average volume
Average True Range
Pre-market volume
Pre-market change %
Indexes
SPY ATRP
SPY trend (this value indicates how much the symbol is changing from the last X bars of Y minues. Higher values means a stronger trend)
QQQ ATRP
QQQ trend (same as SPY trend)
The indicator is highly customizable. Here are some of the settings:
Compact view
Text size
Every information is hidable
Most of the informations have customizable warning
Background color with thresholds
Period/lenght of the indicators
To Integer FunctionCustom toInteger() function accepts and truncates the following forms: const, input, simple, and series of the following types: float, integer, and string.
Special thanks and credit to BeeHolder for idea on using str.format("{0}", string) as workaround for accepting and handling string types!
NOTICE: This is an example script and not meant to be used as an actual strategy. By using this script or any portion thereof, you acknowledge that you have read and understood that this is for research purposes only and I am not responsible for any financial losses you may incur by using this script!

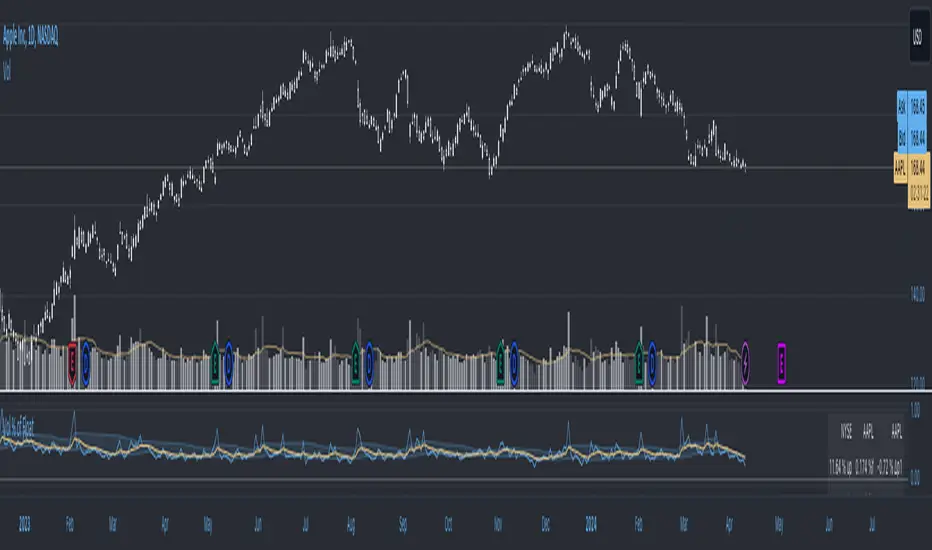
[Steve Woods Float Analysis ] Volume Float Indicator This Indicator is developed as mentioned in Steve Woods Book
"Float Analysis, Powerful technical Indicators using Price and Volume"
Overview
Float analysis is a holistic approach to studying the technical behavior
of stocks. By this I mean it treats the shares actually being traded as equal in importance to price and volume activity. Thus, price and volume are seen as only two-thirds of the picture, with the number of shares actually traded being the final third that completes the picture. The power of looking at stocks this way is that it demonstrates a direct relationship between the volume of shares traded in the past and subsequent future movements in price. Thus, float analysis is a powerful tool to predict future stock price movements. In addition, by studying stocks holistically, float analysis expands and clarifies the definition of several technical terms. These include bottoms and tops, support and resistance, and accumulation and distribution.
Float analysis also allows us to create a model of price, volume, and tradeable shares activity. As a model it does not claim to be the “truth” of all stock price and volume activity. It is, of course, just one point of view among many. But like any valid model, it has the ring of truth; and to all who listen, float analysis rings rather loudly. Its appeal as a model of stock behavior is three- fold. First, it is based on several discoveries that are easy to understand. Second, it is backed up by hard data. And third, it makes common sense.
The first and most important discovery, made in 1993, is a simple concept with profound implications. In order to understand this discovery, we need to know two key terms: float and float turnover. The float is well known to knowledgeable market players. I coined the term float turnover to explain the discovery.
The Float
Any given stock has only a certain number of shares that are actually avail- able for trading. These freely traded shares in the hands of the public are called the float, a shortened version of the floating supply of shares. For big companies, like Intel or Microsoft, the number can be over a billion shares. For a small, obscure company, it may be a few hundred thousand. But every company has a specific number of shares that is actually traded by the pub- lic. The float should not be confused with the shares outstanding, which includes both the floating supply of shares and those shares held tightly by the company’s management. The float number for any given company can change periodically; the management might issue more shares, they might sell their shares, or the shares might go through a stock split. The number of shares in a company’s float is not a secret. It is a publicly accessible from a number of sources
A Float Turnover
A float turnover is the amount of time it takes for a number of shares to trade that cumulatively corresponds with the number of shares in the stock’s float. For example, if a company’s float has 100 million shares that are actively trading and the total cumulative volume of shares traded over the last year was 100 million shares, then a single float turnover would be a one-year span starting from the current date and going back to the day when the cumulative total of the volume equaled 100 million shares. In other words, all we’ve done is add the volume numbers from a starting point back to a date when the total equals the float number. There is in this definition an important point that needs to be noted. Although the company’s float is 100 million shares and 100 million shares were traded in a one-year span, we cannot say that all the shares in the float have been traded. This is because it is impossible to know the intentions of all the market participants. There may be short-term day traders who buy and sell several times during a float turnover, and there may be long-term investors who are holding their shares and not trading at all. This being the case, we can only say approximately all the shares in the float were traded. We can, however, quite correctly say that the total number of shares that were traded corresponds to the number of shares in the stock’s float. This is because we can add up the number of shares that were traded during any time frame and compare it to the stock’s float number. When the number of shares traded in any time frame is the same as the float number, we can say that by our definition we have a float turnover.
To some degree, a complete change of ownership in the company is implied by a float turnover, but it can never be measured with any degree of precision.
Real Life Applications
One can make a good strategy out of it
Can be used as confirmations to the old school patterns observed
Useful in deciding recovery points
Useful in deciding reverse trade points
Useful in deciding catastrophic Exit Plan
Some more Visual Examples
Which Timeframes it can be used
Can be used in any timeframes
like : 15s, 30s, 1m, 3m .... 1D, 1W, 1M,
Only to be used for securities for which tradingview provides volume data
How can you get this Indicator
You get this indicator only by messaging me privately , do not use the comment box for requesting access to the indicator, as it is against the house rules of Tradingview community. Use comments only for adding or suggesting constructive stuffss.
Last but not the least Thanks to TradingView for providing us such an awesome platform!
