Frequency Momentum Oscillator [QuantAlgo]🟢 Overview
The Frequency Momentum Oscillator applies Fourier-based spectral analysis principles to price action to identify regime shifts and directional momentum. It calculates Fourier coefficients for selected harmonic frequencies on detrended price data, then measures the distribution of power across low, mid, and high frequency bands to distinguish between persistent directional trends and transient market noise. This approach provides traders with a quantitative framework for assessing whether current price action represents meaningful momentum or merely random fluctuations, enabling more informed entry and exit decisions across various asset classes and timeframes.
🟢 How It Works
The calculation process removes the dominant trend from price data by subtracting a simple moving average, isolating cyclical components for frequency analysis:
detrendedPrice = close - ta.sma(close , frequencyPeriod)
The detrended price series undergoes frequency decomposition through Fourier coefficient calculation across the first 8 harmonics. For each harmonic frequency, the algorithm computes sine and cosine components across the lookback window, then derives power as the sum of squared coefficients:
for k = 1 to 8
cosSum = 0.0
sinSum = 0.0
for n = 0 to frequencyPeriod - 1
angle = 2 * math.pi * k * n / frequencyPeriod
cosSum := cosSum + detrendedPrice * math.cos(angle)
sinSum := sinSum + detrendedPrice * math.sin(angle)
power = (cosSum * cosSum + sinSum * sinSum) / frequencyPeriod
Power measurements are aggregated into three frequency bands: low frequencies (harmonics 1-2) capturing persistent cycles, mid frequencies (harmonics 3-4), and high frequencies (harmonics 5-8) representing noise. Each band's power normalizes against total spectral power to create percentage distributions:
lowFreqNorm = totalPower > 0 ? (lowFreqPower / totalPower) * 100 : 33.33
highFreqNorm = totalPower > 0 ? (highFreqPower / totalPower) * 100 : 33.33
The normalized frequency components undergo exponential smoothing before calculating spectral balance as the difference between low and high frequency power:
smoothLow = ta.ema(lowFreqNorm, smoothingPeriod)
smoothHigh = ta.ema(highFreqNorm, smoothingPeriod)
spectralBalance = smoothLow - smoothHigh
Spectral balance combines with price momentum through directional multiplication, producing a composite signal that integrates frequency characteristics with price direction:
momentum = ta.change(close , frequencyPeriod/2)
compositeSignal = spectralBalance * math.sign(momentum)
finalSignal = ta.ema(compositeSignal, smoothingPeriod)
The final signal oscillates around zero, with positive values indicating low-frequency dominance coupled with upward momentum (trending up), and negative values indicating either high-frequency dominance (choppy market) or downward momentum (trending down).
🟢 How to Use This Indicator
→ Long/Short Signals: the indicator generates long signals when the smoothed composite signal crosses above zero (indicating low-frequency directional strength dominates) and short signals when it crosses below zero (indicating bearish momentum persistence).
→ Upper and Lower Reference Lines: the +25 and -25 reference lines serve as threshold markers for momentum strength. Readings beyond these levels indicate strong directional conviction, while oscillations between them suggest consolidation or weakening momentum. These references help traders distinguish between strong trending regimes and choppy transitional periods.
→ Preconfigured Presets: three optimized configurations are available with Default (32, 3) offering balanced responsiveness, Fast Response (24, 2) designed for scalping and intraday trading, and Smooth Trend (40, 5) calibrated for swing trading and position trading with enhanced noise filtration.
→ Built-in Alerts: the indicator includes three alert conditions for automated monitoring - Long Signal (momentum shifts bullish), Short Signal (momentum shifts bearish), and Signal Change (any directional transition). These alerts enable traders to receive real-time notifications without continuous chart monitoring.
→ Color Customization: four visual themes (Classic green/red, Aqua blue/orange, Cosmic aqua/purple, Custom) allow chart customization for different display environments and personal preferences.
Fourier

Adaptive Fourier Transform Supertrend [QuantAlgo]Discover a brand new way to analyze trend with Adaptive Fourier Transform Supertrend by QuantAlgo , an innovative technical indicator that combines the power of Fourier analysis with dynamic Supertrend methodology. In essence, it utilizes the frequency domain mathematics and the adaptive volatility control technique to transform complex wave patterns into clear and high probability signals—ideal for both sophisticated traders seeking mathematical precision and investors who appreciate robust trend confirmation!
🟢 Core Architecture
At its core, this indicator employs an adaptive Fourier Transform framework with dynamic volatility-controlled Supertrend bands. It utilizes multiple harmonic components that let you fine-tune how market frequencies influence trend detection. By combining wave analysis with adaptive volatility bands, the indicator creates a sophisticated yet clear framework for trend identification that dynamically adjusts to changing market conditions.
🟢 Technical Foundation
The indicator builds on three innovative components:
Fourier Wave Analysis: Decomposes price action into primary and harmonic components for precise trend detection
Adaptive Volatility Control: Dynamically adjusts Supertrend bands using combined ATR and standard deviation
Harmonic Integration: Merges multiple frequency components with decreasing weights for comprehensive trend analysis
🟢 Key Features & Signals
The Adaptive Fourier Transform Supertrend transforms complex wave calculations into clear visual signals with:
Dynamic trend bands that adapt to market volatility
Sophisticated cloud-fill visualization system
Strategic L/S markers at key trend reversals
Customizable bar coloring based on trend direction
Comprehensive alert system for trend shifts
🟢 Practical Usage Tips
Here's how you can get the most out of the Adaptive Fourier Transform Supertrend :
1/ Setup:
Add the indicator to your favorites, then apply it to your chart ⭐️
Start with close price as your base source
Use standard Fourier period (14) for balanced wave detection
Begin with default harmonic weight (0.5) for balanced sensitivity
Start with standard Supertrend multiplier (2.0) for reliable band width
2/ Signal Interpretation:
Monitor trend band crossovers for potential signals
Watch for convergence of price with Fourier trend
Use L/S markers for trade entry points
Monitor bar colors for trend confirmation
Configure alerts for significant trend reversals
🟢 Pro Tips
Fine-tune Fourier parameters for optimal sensitivity:
→ Lower Base Period (8-12) for more reactive analysis
→ Higher Base Period (15-30) to filter out noise
→ Adjust Harmonic Weight (0.3-0.7) to control shorter trend influence
Customize Supertrend settings:
→ Lower multiplier (1.5-2.0) for tighter bands
→ Higher multiplier (2.0-3.0) for wider bands
→ Adjust ATR length based on market volatility
Strategy Enhancement:
→ Compare signals across multiple timeframes
→ Combine with volume analysis
→ Use with support/resistance levels
→ Integrate with other momentum indicators

Fourier For Loop [BackQuant]Fourier For Loop
PLEASE Read the following, as understanding an indicator's functionality is essential before integrating it into a trading strategy. Knowing the core logic behind each tool allows for a sound and strategic approach to trading.
Introducing BackQuant's Fourier For Loop (FFL) — a cutting-edge trading indicator that combines Fourier transforms with a for-loop scoring mechanism. This innovative approach leverages mathematical precision to extract trends and reversals in the market, helping traders make informed decisions. Let's break down the components, rationale, and potential use-cases of this indicator.
Understanding Fourier Transform in Trading
The Fourier Transform decomposes price movements into their frequency components, allowing for a detailed analysis of cyclical behavior in the market. By transforming the price data from the time domain into the frequency domain, this indicator identifies underlying patterns that traditional methods may overlook.
In this script, Fourier transforms are applied to the specified calculation source (defaulted to HLC3). The transformation yields magnitude values that can be used to score market movements over a defined range. This scoring process helps uncover long and short signals based on relative strength and trend direction.
Why Use Fourier Transforms?
Fourier Transforms excel in identifying recurring cycles and smoothing noisy data, making them ideal for fast-paced markets where price movements may be erratic. They also provide a unique perspective on market volatility, offering traders additional insights beyond standard indicators.
Calculation Logic: For-Loop Scoring Mechanism
The For Loop Scoring mechanism compares the magnitude of each transformed point in the series, summing the results to generate a score. This score forms the backbone of the signal generation system.
Long Signals: Generated when the score surpasses the defined long threshold (default set at 40). This indicates a strong bullish trend, signaling potential upward momentum.
Short Signals: Triggered when the score crosses under the short threshold (default set at -10). This suggests a bearish trend or potential downside risk.'
Thresholds & Customization
The indicator offers customizable settings to fit various trading styles:
Calculation Periods: Control how many periods the Fourier transform covers.
Long/Short Thresholds: Adjust the sensitivity of the signals to match different timeframes or risk preferences.
Visualization Options: Traders can visualize the thresholds, change the color of bars based on trend direction, and even color the background for enhanced clarity.
Trading Applications
This Fourier For Loop indicator is designed to be versatile across various market conditions and timeframes. Some of its key use-cases include:
Cycle Detection: Fourier transforms help identify recurring patterns or cycles, giving traders a head-start on market direction.
Trend Following: The for-loop scoring system helps confirm the strength of trends, allowing traders to enter positions with greater confidence.
Risk Management: With clearly defined long and short signals, traders can manage their positions effectively, minimizing exposure to false signals.
Final Note
Incorporating this indicator into your trading strategy adds a layer of mathematical precision to traditional technical analysis. Be sure to adjust the calculation start/end points and thresholds to match your specific trading style, and remember that no indicator guarantees success. Always backtest thoroughly and integrate the Fourier For Loop into a balanced trading system.
Thus following all of the key points here are some sample backtests on the 1D Chart
Disclaimer: Backtests are based off past results, and are not indicative of the future .
INDEX:BTCUSD
INDEX:ETHUSD
BINANCE:SOLUSD

GannLSVZO Indicator [Algo Alert]The Volume Zone oscillator breaks up volume activity into positive and negative categories. It is positive when the current closing price is greater than the prior closing price and negative when it's lower than the prior closing price. The resulting curve plots through relative percentage levels that yield a series of buy and sell signals, depending on level and indicator direction.
The Gann Laplace Smoothed Volume Zone Oscillator GannLSVZO is a refined version of the Volume Zone Oscillator, enhanced by the implementation of the upgraded Discrete Fourier Transform, the Laplace Stieltjes Transform. Its primary function is to streamline price data and diminish market noise, thus offering a clearer and more precise reflection of price trends.
By combining the Laplace with Gann Swing Entries and Exits (orange X) and with Ehler's white noise histogram, users gain a comprehensive perspective on volume-related market conditions.
HOW TO USE THE INDICATOR:
The default period is 2 but can be adjusted after backtesting. (I suggest 5 VZO length and NoiceR max length 8 as-well)
The VZO points to a positive trend when it is rising above the 0% level, and a negative trend when it is falling below the 0% level. 0% level can be adjusted in setting by adjusting VzoDifference. Oscillations rising below 0% level or falling above 0% level result in a natural trend.
ORIGINALITY & USFULLNESS:
Personal combination of Gann swings and Laplace Stieltjes Transform of a price which results in less noise Volume Zone Oscillator.
The Laplace Stieltjes Transform is a mathematical technique that transforms discrete data from the time domain into its corresponding representation in the frequency domain. This process involves breaking down a signal into its individual frequency components, thereby exposing the amplitude and phase characteristics inherent in each frequency element.
This indicator utilizes the concept of Ehler's Universal Oscillator and displays a histogram, offering critical insights into the prevailing levels of market noise. The Ehler's Universal Oscillator is grounded in a statistical model that captures the erratic and unpredictable nature of market movements. Through the application of this principle, the histogram aids traders in pinpointing times when market volatility is either rising or subsiding.
The Gann swings and the Gan swing strategy is developed by meomeo105, this Gann high and low algorithm forms the basis of the EMA modification.
DETAILED DESCRIPTION:
My detailed description of the indicator and use cases which I find very valuable.
What is oscillator?
Oscillators are chart indicators that can assist a trader in determining overbought or oversold conditions in ranging (non-trending) markets.
What is volume zone oscillator?
Price Zone Oscillator measures if the most recent closing price is above or below the preceding closing price.
Volume Zone Oscillator is Volume multiplied by the 1 or -1 depending on the difference of the preceding 2 close prices and smoothed with Exponential moving Average.
What does this mean?
If the VZO is above 0 and VZO is rising. We have a bullish trend. Most likely.
If the VZO is below 0 and VZO is falling. We have a bearish trend. Most likely.
Rising means that VZO on close is higher than the previous day.
Falling means that VZO on close is lower than the previous day.
What if VZO is falling above 0 line?
It means we have a high probability of a bearish trend.
Thus the indicator returns 0 and Strategy closes all it's positions when falling above 0 (or rising bellow 0) and we combine higher and lower timeframes to gauge the trend.
What is approximation and smoothing?
They are mathematical concepts for making a discrete set of numbers a
continuous curved line.
Laplace Stieltjes Transform approximation of a close price are taken from aprox library.
Key Features:
You can tailor the Indicator/Strategy to your preferences with adjustable parameters such as VZO length, noise reduction settings, and smoothing length.
Volume Zone Oscillator (VZO) shows market sentiment with the VZO, enhanced with Exponential Moving Average (EMA) smoothing for clearer trend identification.
Noise Reduction leverages Euler's White noise capabilities for effective noise reduction in the VZO, providing a cleaner and more accurate representation of market dynamics.
Choose between the traditional Fast Laplace Stieltjes Transform (FLT) and the innovative Double Discrete Fourier Transform (DTF32) soothed price series to suit your analytical needs.
Use dynamic calculation of Laplace coefficient or the static one. You may modify those inputs and Strategy entries with Gann swings.
I suggest using "Close all" input False when fine-tuning Inputs for 1 TimeFrame. When you export data to Excel/Numbers/GSheets I suggest using "Close all" input as True, except for the lowest TimeFrame. I suggest using 100% equity as your default quantity for fine-tune purposes. I have to mention that 100% equity may lead to unrealistic backtesting results. Be avare. When backtesting for trading purposes use Contracts or USDT.

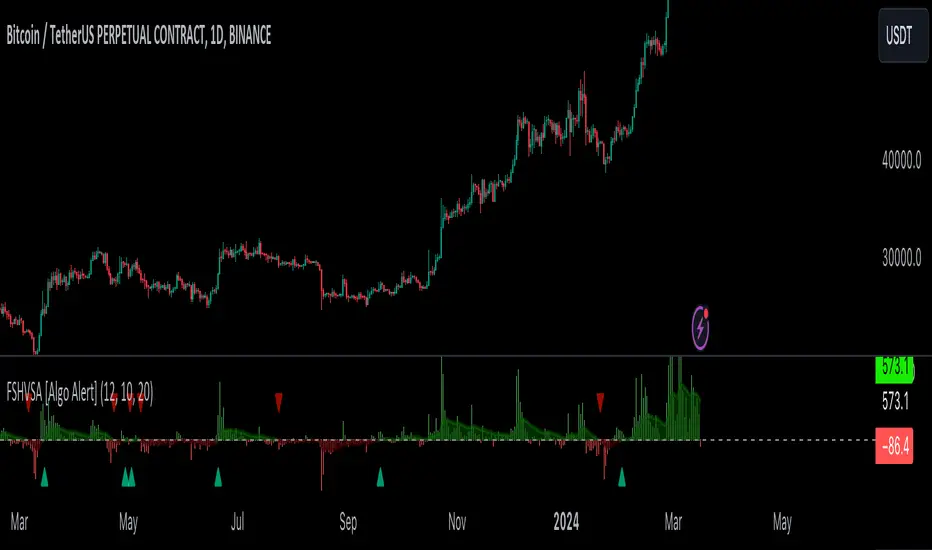
Gann + Laplace Smoothed Hybrid Volume Spread Analysis Indicator
This Indicator stands apart by integrating the principles of the upgraded Discrete Fourier Transform (DFT), the Laplace Stieltjes Transform and volume spread analysis, enhanced with a layer of Fourier smoothing to distill market noise and highlight trend directions with unprecedented clarity.
The length of EMA and Strategy Entries are modified with the Gann swings.
This smoothing process allows traders to discern the true underlying patterns in volume and price action, stripped of the distractions of short-term fluctuations and noise.
The core functionality of the GannLSHVSA revolves around the innovative combination of volume change analysis, spread determination (calculated from the open and close price difference), and the strategic use of the EMA (default 10) to fine-tune the analysis of spread by incorporating volume changes.
Trend direction is validated through a moving average (MA) of the histogram, which acts analogously to the Volume MA found in traditional volume indicators. This MA serves as a pivotal reference point, enabling traders to confidently engage with the market when the histogram's movement concurs with the trend direction, particularly when it crosses the Trend MA line, signalling optimal entry points.
It returns 0 when MA of the histogram and EMA of the Price Spread are not align.
WHAT IS GannLSHVSA INDICATOR:
The GannLSHVSA plots a positive trend when a positive Volume smoothed Spread and EMA of Volume smoothed price is above 0, and a negative when negative Volume smoothed Spread and EMA of Volume smoothed price is below 0. When this conditions are not met it plots 0.
ORIGINALITY & USEFULNESS:
The GannLSHVSA Strategy is unique because it applies upgraded DFT, the Laplace Stieltjes Transform for data smoothing, effectively filtering out the minor fluctuations and leaving traders with a clear picture of the market's true movements. The DFT's ability to break down market signals into constituent frequencies offers a granular view of market dynamics, highlighting the amplitude and phase of each frequency component. This, combined with the strategic application of Ehler's Universal Oscillator principles via a histogram, furnishes traders with a nuanced understanding of market volatility and noise levels, thereby facilitating more informed trading decisions. The Gann swing strategy is developed by meomeo105, this Gann high and low algorithm forms the basis of the EMA modification.
DETAILED DESCRIPTION:
My detailed description of the indicator and use cases which I find very valuable.
What is the meaning of price spread?
In finance, a spread refers to the difference between two prices, rates, or yields. One of the most common types is the bid-ask spread, which refers to the gap between the bid (from buyers) and the ask (from sellers) prices of a security or asset.
We are going to use Open-Close spread.
What is Volume spread analysis?
Volume spread analysis (VSA) is a method of technical analysis that compares the volume per candle, range spread, and closing price to determine price direction.
What does this mean?
We need to have a positive Volume Price Spread and a positive Moving average of Volume price spread for a positive trend. OR via versa a negative Volume Price Spread and a negative Moving average of Volume price spread for a negative trend.
What if we have a positive Volume Price Spread and a negative Moving average of Volume Price Spread?
It results in a neutral, not trending price action.
Thus the Indicator/Strategy returns 0 and Closes all long and short positions.
I suggest using "Close all" input False when fine-tuning Inputs for 1 TimeFrame. When you export data to Excel/Numbers/GSheets I suggest using "Close all" input as True, except for the lowest TimeFrame. I suggest using 100% equity as your default quantity for fine-tune purposes. I have to mention that 100% equity may lead to unrealistic backtesting results. Be avare. When backtesting for trading purposes use Contracts or USDT.
6 days ago
Release Notes

Gann + Laplace Smoothed Hybrid Volume Spread AnalysisThe Gann + Laplace Smoothed Hybrid Volume Spread Analysis ( GannLSHVSA ) Strategy/Indicator is an trading tool designed to fuse volume analysis with trend detection, offering traders a view of market dynamics.
This Strategy/Indicator stands apart by integrating the principles of the upgraded Discrete Fourier Transform (DFT), the Laplace Stieltjes Transform and volume spread analysis, enhanced with a layer of Fourier smoothing to distill market noise and highlight trend directions with unprecedented clarity.
The length of EMA and Strategy Entries are modified with the Gann swings .
This smoothing process allows traders to discern the true underlying patterns in volume and price action, stripped of the distractions of short-term fluctuations and noise.
The core functionality of the GannLSHVSA revolves around the innovative combination of volume change analysis, spread determination (calculated from the open and close price difference), and the strategic use of the EMA (default 10) to fine-tune the analysis of spread by incorporating volume changes.
Trend direction is validated through a moving average (MA) of the histogram, which acts analogously to the Volume MA found in traditional volume indicators. This MA serves as a pivotal reference point, enabling traders to confidently engage with the market when the histogram's movement concurs with the trend direction, particularly when it crosses the Trend MA line, signalling optimal entry points.
It returns 0 when MA of the histogram and EMA of the Price Spread are not align.
WHAT IS GannLSHVSA INDICATOR:
The GannLSHVSA plots a positive trend when a positive Volume smoothed Spread and EMA of Volume smoothed price is above 0, and a negative when negative Volume smoothed Spread and EMA of Volume smoothed price is below 0. When this conditions are not met it plots 0.
HOW TO USE THE STRATEGY:
Here you fine-tune the inputs until you find a combination that works well on all Timeframes you will use when creating your Automated Trade Algorithmic Strategy. I suggest 4h, 12h, 1D, 2D, 3D, 4D, 5D, 6D, W and M.
ORIGINALITY & USEFULNESS:
The GannLSHVSA Strategy is unique because it applies upgraded DFT, the Laplace Stieltjes Transform for data smoothing, effectively filtering out the minor fluctuations and leaving traders with a clear picture of the market's true movements. The DFT's ability to break down market signals into constituent frequencies offers a granular view of market dynamics, highlighting the amplitude and phase of each frequency component. This, combined with the strategic application of Ehler's Universal Oscillator principles via a histogram, furnishes traders with a nuanced understanding of market volatility and noise levels, thereby facilitating more informed trading decisions. The Gann swing strategy is developed by meomeo105, this Gann high and low algorithm forms the basis of the EMA modification.
DETAILED DESCRIPTION:
My detailed description of the indicator and use cases which I find very valuable.
What is the meaning of price spread?
In finance, a spread refers to the difference between two prices, rates, or yields. One of the most common types is the bid-ask spread, which refers to the gap between the bid (from buyers) and the ask (from sellers) prices of a security or asset.
We are going to use Open-Close spread.
What is Volume spread analysis?
Volume spread analysis (VSA) is a method of technical analysis that compares the volume per candle, range spread, and closing price to determine price direction.
What does this mean?
We need to have a positive Volume Price Spread and a positive Moving average of Volume price spread for a positive trend. OR via versa a negative Volume Price Spread and a negative Moving average of Volume price spread for a negative trend.
What if we have a positive Volume Price Spread and a negative Moving average of Volume Price Spread?
It results in a neutral, not trending price action.
Thus the Indicator/Strategy returns 0 and Closes all long and short positions.
I suggest using "Close all" input False when fine-tuning Inputs for 1 TimeFrame. When you export data to Excel/Numbers/GSheets I suggest using "Close all" input as True, except for the lowest TimeFrame. I suggest using 100% equity as your default quantity for fine-tune purposes. I have to mention that 100% equity may lead to unrealistic backtesting results. Be avare. When backtesting for trading purposes use Contracts or USDT.

Fine-tune Inputs: Gann + Laplace Smooth Volume Zone OscillatorUse this Strategy to Fine-tune inputs for the GannLSVZ0 Indicator.
Strategy allows you to fine-tune the indicator for 1 TimeFrame at a time; cross Timeframe Input fine-tuning is done manually after exporting the chart data.
I suggest using "Close all" input False when fine-tuning Inputs for 1 TimeFrame. When you export data to Excel/Numbers/GSheets I suggest using "Close all" input as True, except for the lowest TimeFrame.
MEANINGFUL DESCRIPTION:
The Volume Zone oscillator breaks up volume activity into positive and negative categories. It is positive when the current closing price is greater than the prior closing price and negative when it's lower than the prior closing price. The resulting curve plots through relative percentage levels that yield a series of buy and sell signals, depending on level and indicator direction.
The Gann Laplace Smoothed Volume Zone Oscillator GannLSVZO is a refined version of the Volume Zone Oscillator, enhanced by the implementation of the upgraded Discrete Fourier Transform, the Laplace Stieltjes Transform. Its primary function is to streamline price data and diminish market noise, thus offering a clearer and more precise reflection of price trends.
By combining the Laplace with Gann Swing Entries and with Ehler's white noise histogram, users gain a comprehensive perspective on volume-related market conditions.
HOW TO USE THE INDICATOR:
The default period is 2 but can be adjusted after backtesting. (I suggest 5 VZO length and NoiceR max length 8 as-well)
The VZO points to a positive trend when it is rising above the 0% level, and a negative trend when it is falling below the 0% level. 0% level can be adjusted in setting by adjusting VzoDifference. Oscillations rising below 0% level or falling above 0% level result in a natural trend.
HOW TO USE THE STRATEGY:
Here you fine-tune the inputs until you find a combination that works well on all Timeframes you will use when creating your Automated Trade Algorithmic Strategy. I suggest 4h, 12h, 1D, 2D, 3D, 4D, 5D, 6D, W and M.
When Indicator/Strategy returns 0 or natural trend, Strategy Closes All it's positions.
ORIGINALITY & USFULLNESS:
Personal combination of Gann swings and Laplace Stieltjes Transform of a price which results in less noise Volume Zone Oscillator.
The Laplace Stieltjes Transform is a mathematical technique that transforms discrete data from the time domain into its corresponding representation in the frequency domain. This process involves breaking down a signal into its individual frequency components, thereby exposing the amplitude and phase characteristics inherent in each frequency element.
This indicator utilizes the concept of Ehler's Universal Oscillator and displays a histogram, offering critical insights into the prevailing levels of market noise. The Ehler's Universal Oscillator is grounded in a statistical model that captures the erratic and unpredictable nature of market movements. Through the application of this principle, the histogram aids traders in pinpointing times when market volatility is either rising or subsiding.
The Gann swing strategy is developed by meomeo105, this Gann high and low algorithm forms the basis of the EMA modification.
DETAILED DESCRIPTION:
My detailed description of the indicator and use cases which I find very valuable.
What is oscillator?
Oscillators are chart indicators that can assist a trader in determining overbought or oversold conditions in ranging (non-trending) markets.
What is volume zone oscillator?
Price Zone Oscillator measures if the most recent closing price is above or below the preceding closing price.
Volume Zone Oscillator is Volume multiplied by the 1 or -1 depending on the difference of the preceding 2 close prices and smoothed with Exponential moving Average.
What does this mean?
If the VZO is above 0 and VZO is rising. We have a bullish trend. Most likely.
If the VZO is below 0 and VZO is falling. We have a bearish trend. Most likely.
Rising means that VZO on close is higher than the previous day.
Falling means that VZO on close is lower than the previous day.
What if VZO is falling above 0 line?
It means we have a high probability of a bearish trend.
Thus the indicator returns 0 and Strategy closes all it's positions when falling above 0 (or rising bellow 0) and we combine higher and lower timeframes to gauge the trend.
What is approximation and smoothing?
They are mathematical concepts for making a discrete set of numbers a
continuous curved line.
Laplace Stieltjes Transform approximation of a close price are taken from aprox library.
Key Features:
You can tailor the Indicator/Strategy to your preferences with adjustable parameters such as VZO length, noise reduction settings, and smoothing length.
Volume Zone Oscillator (VZO) shows market sentiment with the VZO, enhanced with Exponential Moving Average (EMA) smoothing for clearer trend identification.
Noise Reduction leverages Euler's White noise capabilities for effective noise reduction in the VZO, providing a cleaner and more accurate representation of market dynamics.
Choose between the traditional Fast Laplace Stieltjes Transform (FLT) and the innovative Double Discrete Fourier Transform (DTF32) soothed price series to suit your analytical needs.
Use dynamic calculation of Laplace coefficient or the static one. You may modify those inputs and Strategy entries with Gann swings.
I suggest using "Close all" input False when fine-tuning Inputs for 1 TimeFrame. When you export data to Excel/Numbers/GSheets I suggest using "Close all" input as True, except for the lowest TimeFrame. I suggest using 100% equity as your default quantity for fine-tune purposes. I have to mention that 100% equity may lead to unrealistic backtesting results. Be avare. When backtesting for trading purposes use Contracts or USDT.

Fourier Adjusted Average True Range [BackQuant]Fourier Adjusted Average True Range
1. Conceptual Foundation and Innovation
The FA-ATR leverages the principles of Fourier analysis to dissect market prices into their constituent cyclical components. By applying Fourier Transform to the price data, the FA-ATR captures the dominant cycles and trends which are often obscured in noisy market data. This integration allows the FA-ATR to adapt its readings based on underlying market dynamics, offering a refined view of volatility that is sensitive to both market direction and momentum.
2. Technical Composition and Calculation
The core of the FA-ATR involves calculating the traditional ATR, which measures market volatility by decomposing the entire range of price movements. The FA-ATR extends this by incorporating a Fourier Transform of price data to assess cyclical patterns over a user-defined period 'N'. This process synthesizes both the magnitude of price changes and their rhythmic occurrences, resulting in a more comprehensive volatility indicator.
Fourier Transform Application: The Fourier series is calculated using price data to identify the fundamental frequency of market movements. This frequency helps in adjusting the ATR to reflect more accurately the current market conditions.
Dynamic Adjustment: The ATR is then adjusted by the magnitude of the dominant cycle from the Fourier analysis, enhancing or reducing the ATR value based on the intensity and phase of market cycles.
3. Features and User Inputs
Customizability: Traders can modify the Fourier period, ATR period, and the multiplication factor to suit different trading styles and market environments.
Visualization : The FA-ATR can be plotted directly on the chart, providing a visual representation of volatility. Additionally, the option to paint candles according to the trend direction enhances the usability and interpretative ease of the indicator.
Confluence with Moving Averages: Optionally, a moving average of the FA-ATR can be displayed, serving as a confluence factor for confirming trends or potential reversals.
4. Practical Applications
The FA-ATR is particularly useful in markets characterized by periodic fluctuations or those that exhibit strong cyclical trends. Traders can utilize this indicator to:
Adjust Stop-Loss Orders: More accurately set stop-loss orders based on a volatility measure that accounts for cyclical market changes.
Trend Confirmation: Use the FA-ATR to confirm trend strength and sustainability, helping to avoid false signals often encountered in volatile markets.
Strategic Entry and Exit: The indicator's responsiveness to changing market dynamics makes it an excellent tool for planning entries and exits in a trend-following or a breakout trading strategy.
5. Advantages and Strategic Value
By integrating Fourier analysis, the FA-ATR provides a volatility measure that is both adaptive and anticipatory, giving traders a forward-looking tool that adjusts to changes before they become apparent through traditional indicators. This anticipatory feature makes it an invaluable asset for traders looking to gain an edge in fast-paced and rapidly changing market conditions.
6. Summary and Usage Tips
The Fourier Adjusted Average True Range is a cutting-edge development in technical analysis, offering traders an enhanced tool for assessing market volatility with increased accuracy and responsiveness. Its ability to adapt to the market's cyclical nature makes it particularly useful for those trading in highly volatile or cyclically influenced markets.
Traders are encouraged to integrate the FA-ATR into their trading systems as a supplementary tool to improve risk management and decision-making accuracy, thereby potentially increasing the effectiveness of their trading strategies.
INDEX:BTCUSD
INDEX:ETHUSD
BINANCE:SOLUSD

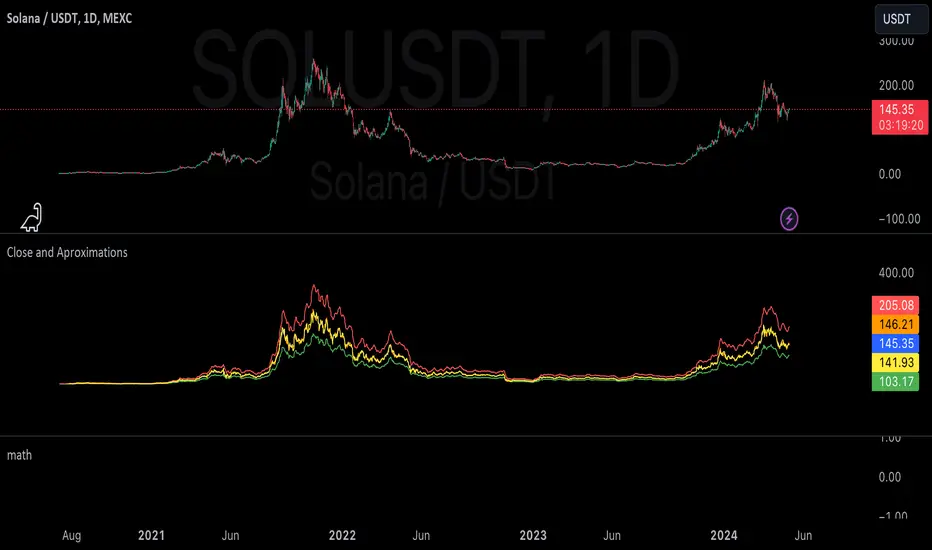
mathLibrary "math"
It's a library of discrete aproximations of a price or Series float it uses Fourier Discrete transform, Laplace Discrete Original and Modified transform and Euler's Theoreum for Homogenus White noice operations. Calling functions without source value it automatically take close as the default source value.
Here is a picture of Laplace and Fourier approximated close prices from this library:
Copy this indicator and try it yourself:
import AutomatedTradingAlgorithms/math/1 as math
//@version=5
indicator("Close Price with Aproximations", shorttitle="Close and Aproximations", overlay=false)
// Sample input data (replace this with your own data)
inputData = close
// Plot Close Price
plot(inputData, color=color.blue, title="Close Price")
ltf32_result = math.LTF32(a=0.01)
plot(ltf32_result, color=color.green, title="LTF32 Aproximation")
fft_result = math.FFT()
plot(fft_result, color=color.red, title="Fourier Aproximation")
wavelet_result = math.Wavelet()
plot(wavelet_result, color=color.orange, title="Wavelet Aproximation")
wavelet_std_result = math.Wavelet_std()
plot(wavelet_std_result, color=color.yellow, title="Wavelet_std Aproximation")
DFT3(xval, _dir)
Discrete Fourier Transform with last 3 points
Parameters:
xval (float) : Source series
_dir (int) : Direction parameter
Returns: Aproxiated source value
DFT2(xval, _dir)
Discrete Fourier Transform with last 2 points
Parameters:
xval (float) : Source series
_dir (int) : Direction parameter
Returns: Aproxiated source value
FFT(xval)
Fast Fourier Transform once. It aproximates usig last 3 points.
Parameters:
xval (float) : Source series
Returns: Aproxiated source value
DFT32(xval)
Combined Discrete Fourier Transforms of DFT3 and DTF2 it aproximates last point by first
aproximating last 3 ponts and than using last 2 points of the previus.
Parameters:
xval (float) : Source series
Returns: Aproxiated source value
DTF32(xval)
Combined Discrete Fourier Transforms of DFT3 and DTF2 it aproximates last point by first
aproximating last 3 ponts and than using last 2 points of the previus.
Parameters:
xval (float) : Source series
Returns: Aproxiated source value
LFT3(xval, _dir, a)
Discrete Laplace Transform with last 3 points
Parameters:
xval (float) : Source series
_dir (int) : Direction parameter
a (float) : laplace coeficient
Returns: Aproxiated source value
LFT2(xval, _dir, a)
Discrete Laplace Transform with last 2 points
Parameters:
xval (float) : Source series
_dir (int) : Direction parameter
a (float) : laplace coeficient
Returns: Aproxiated source value
LFT(xval, a)
Fast Laplace Transform once. It aproximates usig last 3 points.
Parameters:
xval (float) : Source series
a (float) : laplace coeficient
Returns: Aproxiated source value
LFT32(xval, a)
Combined Discrete Laplace Transforms of LFT3 and LTF2 it aproximates last point by first
aproximating last 3 ponts and than using last 2 points of the previus.
Parameters:
xval (float) : Source series
a (float) : laplace coeficient
Returns: Aproxiated source value
LTF32(xval, a)
Combined Discrete Laplace Transforms of LFT3 and LTF2 it aproximates last point by first
aproximating last 3 ponts and than using last 2 points of the previus.
Parameters:
xval (float) : Source series
a (float) : laplace coeficient
Returns: Aproxiated source value
whitenoise(indic_, _devided, minEmaLength, maxEmaLength, src)
Ehler's Universal Oscillator with White Noise, without extra aproximated src.
It uses dinamic EMA to aproximate indicator and thus reducing noise.
Parameters:
indic_ (float) : Input series for the indicator values to be smoothed
_devided (int) : Divisor for oscillator calculations
minEmaLength (int) : Minimum EMA length
maxEmaLength (int) : Maximum EMA length
src (float) : Source series
Returns: Smoothed indicator value
whitenoise(indic_, dft1, _devided, minEmaLength, maxEmaLength, src)
Ehler's Universal Oscillator with White Noise and DFT1.
It uses src and sproxiated src (dft1) to clearly define white noice.
It uses dinamic EMA to aproximate indicator and thus reducing noise.
Parameters:
indic_ (float) : Input series for the indicator values to be smoothed
dft1 (float) : Aproximated src value for white noice calculation
_devided (int) : Divisor for oscillator calculations
minEmaLength (int) : Minimum EMA length
maxEmaLength (int) : Maximum EMA length
src (float) : Source series
Returns: Smoothed indicator value
smooth(dft1, indic__, _devided, minEmaLength, maxEmaLength, src)
Smoothing source value with help of indicator series and aproximated source value
It uses src and sproxiated src (dft1) to clearly define white noice.
It uses dinamic EMA to aproximate src and thus reducing noise.
Parameters:
dft1 (float) : Value to be smoothed.
indic__ (float) : Optional input for indicator to help smooth dft1 (default is FFT)
_devided (int) : Divisor for smoothing calculations
minEmaLength (int) : Minimum EMA length
maxEmaLength (int) : Maximum EMA length
src (float) : Source series
Returns: Smoothed source (src) series
smooth(indic__, _devided, minEmaLength, maxEmaLength, src)
Smoothing source value with help of indicator series
It uses dinamic EMA to aproximate src and thus reducing noise.
Parameters:
indic__ (float) : Optional input for indicator to help smooth dft1 (default is FFT)
_devided (int) : Divisor for smoothing calculations
minEmaLength (int) : Minimum EMA length
maxEmaLength (int) : Maximum EMA length
src (float) : Source series
Returns: Smoothed src series
vzo_ema(src, len)
Volume Zone Oscillator with EMA smoothing
Parameters:
src (float) : Source series
len (simple int) : Length parameter for EMA
Returns: VZO value
vzo_sma(src, len)
Volume Zone Oscillator with SMA smoothing
Parameters:
src (float) : Source series
len (int) : Length parameter for SMA
Returns: VZO value
vzo_wma(src, len)
Volume Zone Oscillator with WMA smoothing
Parameters:
src (float) : Source series
len (int) : Length parameter for WMA
Returns: VZO value
alma2(series, windowsize, offset, sigma)
Arnaud Legoux Moving Average 2 accepts sigma as series float
Parameters:
series (float) : Input series
windowsize (int) : Size of the moving average window
offset (float) : Offset parameter
sigma (float) : Sigma parameter
Returns: ALMA value
Wavelet(src, len, offset, sigma)
Aproxiates srt using Discrete wavelet transform.
Parameters:
src (float) : Source series
len (int) : Length parameter for ALMA
offset (simple float)
sigma (simple float)
Returns: Wavelet-transformed series
Wavelet_std(src, len, offset, mag)
Aproxiates srt using Discrete wavelet transform with standard deviation as a magnitude.
Parameters:
src (float) : Source series
len (int) : Length parameter for ALMA
offset (float) : Offset parameter for ALMA
mag (int) : Magnitude parameter for standard deviation
Returns: Wavelet-transformed series
LaplaceTransform(xval, N, a)
Original Laplace Transform over N set of close prices
Parameters:
xval (float) : series to aproximate
N (int) : number of close prices in calculations
a (float) : laplace coeficient
Returns: Aproxiated source value
NLaplaceTransform(xval, N, a, repeat)
Y repetirions on Original Laplace Transform over N set of close prices, each time N-k set of close prices
Parameters:
xval (float) : series to aproximate
N (int) : number of close prices in calculations
a (float) : laplace coeficient
repeat (int) : number of repetitions
Returns: Aproxiated source value
LaplaceTransformsum(xval, N, a, b)
Sum of 2 exponent coeficient of Laplace Transform over N set of close prices
Parameters:
xval (float) : series to aproximate
N (int) : number of close prices in calculations
a (float) : laplace coeficient
b (float) : second laplace coeficient
Returns: Aproxiated source value
NLaplaceTransformdiff(xval, N, a, b, repeat)
Difference of 2 exponent coeficient of Laplace Transform over N set of close prices
Parameters:
xval (float) : series to aproximate
N (int) : number of close prices in calculations
a (float) : laplace coeficient
b (float) : second laplace coeficient
repeat (int) : number of repetitions
Returns: Aproxiated source value
N_divLaplaceTransformdiff(xval, N, a, b, repeat)
N repetitions of Difference of 2 exponent coeficient of Laplace Transform over N set of close prices, with dynamic rotation
Parameters:
xval (float) : series to aproximate
N (int) : number of close prices in calculations
a (float) : laplace coeficient
b (float) : second laplace coeficient
repeat (int) : number of repetitions
Returns: Aproxiated source value
LaplaceTransformdiff(xval, N, a, b)
Difference of 2 exponent coeficient of Laplace Transform over N set of close prices
Parameters:
xval (float) : series to aproximate
N (int) : number of close prices in calculations
a (float) : laplace coeficient
b (float) : second laplace coeficient
Returns: Aproxiated source value
NLaplaceTransformdiffFrom2(xval, N, a, b, repeat)
N repetitions of Difference of 2 exponent coeficient of Laplace Transform over N set of close prices, second element has for 1 higher exponent factor
Parameters:
xval (float) : series to aproximate
N (int) : number of close prices in calculations
a (float) : laplace coeficient
b (float) : second laplace coeficient
repeat (int) : number of repetitions
Returns: Aproxiated source value
N_divLaplaceTransformdiffFrom2(xval, N, a, b, repeat)
N repetitions of Difference of 2 exponent coeficient of Laplace Transform over N set of close prices, second element has for 1 higher exponent factor, dynamic rotation
Parameters:
xval (float) : series to aproximate
N (int) : number of close prices in calculations
a (float) : laplace coeficient
b (float) : second laplace coeficient
repeat (int) : number of repetitions
Returns: Aproxiated source value
LaplaceTransformdiffFrom2(xval, N, a, b)
Difference of 2 exponent coeficient of Laplace Transform over N set of close prices, second element has for 1 higher exponent factor
Parameters:
xval (float) : series to aproximate
N (int) : number of close prices in calculations
a (float) : laplace coeficient
b (float) : second laplace coeficient
Returns: Aproxiated source value
Fine-tune Inputs: Fourier Smoothed Volume zone oscillator WFSVZ0Use this Strategy to Fine-tune inputs for the (W&)FSVZ0 Indicator.
Strategy allows you to fine-tune the indicator for 1 TimeFrame at a time; cross Timeframe Input fine-tuning is done manually after exporting the chart data.
I suggest using "Close all" input False when fine-tuning Inputs for 1 TimeFrame. When you export data to Excel/Numbers/GSheets I suggest using "Close all" input as True, except for the lowest TimeFrame.
MEANINGFUL DESCRIPTION:
The Volume Zone oscillator breaks up volume activity into positive and negative categories. It is positive when the current closing price is greater than the prior closing price and negative when it's lower than the prior closing price. The resulting curve plots through relative percentage levels that yield a series of buy and sell signals, depending on level and indicator direction.
The Wavelet & Fourier Smoothed Volume Zone Oscillator (W&)FSVZO is a refined version of the Volume Zone Oscillator, enhanced by the implementation of the Discrete Fourier Transform . Its primary function is to streamline price data and diminish market noise, thus offering a clearer and more precise reflection of price trends.
By combining the Wavalet and Fourier aproximation with Ehler's white noise histogram, users gain a comprehensive perspective on volume-related market conditions.
HOW TO USE THE INDICATOR:
The default period is 2 but can be adjusted after backtesting. (I suggest 5 VZO length and NoiceR max length 8 as-well)
The VZO points to a positive trend when it is rising above the 0% level, and a negative trend when it is falling below the 0% level. 0% level can be adjusted in setting by adjusting VzoDifference. Oscillations rising below 0% level or falling above 0% level result in a natural trend.
HOW TO USE THE STRATEGY:
Here you fine-tune the inputs until you find a combination that works well on all Timeframes you will use when creating your Automated Trade Algorithmic Strategy. I suggest 4h, 12h, 1D, 2D, 3D, 4D, 5D, 6D, W and M.
When I ndicator/Strategy returns 0 or natural trend , Strategy Closes All it's positions.
ORIGINALITY & USFULLNESS:
Personal combination of Fourier and Wavalet aproximation of a price which results in less noise Volume Zone Oscillator.
The Wavelet Transform is a powerful mathematical tool for signal analysis, particularly effective in analyzing signals with varying frequency or non-stationary characteristics. It dissects a signal into wavelets, small waves with varying frequency and limited duration, providing a multi-resolution analysis. This approach captures both frequency and location information, making it especially useful for detecting changes or anomalies in complex signals.
The Discrete Fourier Transform (DFT) is a mathematical technique that transforms discrete data from the time domain into its corresponding representation in the frequency domain. This process involves breaking down a signal into its individual frequency components, thereby exposing the amplitude and phase characteristics inherent in each frequency element.
This indicator utilizes the concept of Ehler's Universal Oscillator and displays a histogram, offering critical insights into the prevailing levels of market noise. The Ehler's Universal Oscillator is grounded in a statistical model that captures the erratic and unpredictable nature of market movements. Through the application of this principle, the histogram aids traders in pinpointing times when market volatility is either rising or subsiding.
DETAILED DESCRIPTION:
My detailed description of the indicator and use cases which I find very valuable.
What is oscillator?
Oscillators are chart indicators that can assist a trader in determining overbought or oversold conditions in ranging (non-trending) markets.
What is volume zone oscillator?
Price Zone Oscillator measures if the most recent closing price is above or below the preceding closing price.
Volume Zone Oscillator is Volume multiplied by the 1 or -1 depending on the difference of the preceding 2 close prices and smoothed with Exponential moving Average.
What does this mean?
If the VZO is above 0 and VZO is rising. We have a bullish trend. Most likely.
If the VZO is below 0 and VZO is falling. We have a bearish trend. Most likely.
Rising means that VZO on close is higher than the previous day.
Falling means that VZO on close is lower than the previous day.
What if VZO is falling above 0 line?
It means we have a high probability of a bearish trend.
Thus the indicator returns 0 and Strategy closes all it's positions when falling above 0 (or rising bellow 0) and we combine higher and lower timeframes to gauge the trend.
In the next Image you can see that trend is negative on 4h, negative on 12h and positive on 1D. That means trend is negative.
I am sorry, the chart is a bit messy. The idea is to use the indicator over more than 1 Timeframe.
What is approximation and smoothing?
They are mathematical concepts for making a discrete set of numbers a
continuous curved line.
Fourier and Wavelet approximation of a close price are taken from aprox library.
Key Features:
You can tailor the Indicator/Strategy to your preferences with adjustable parameters such as VZO length, noise reduction settings, and smoothing length.
Volume Zone Oscillator (VZO) shows market sentiment with the VZO, enhanced with Exponential Moving Average (EMA) smoothing for clearer trend identification.
Noise Reduction leverages Euler's White noise capabilities for effective noise reduction in the VZO, providing a cleaner and more accurate representation of market dynamics.
Choose between the traditional Fast Fourier Transform (FFT) , the innovative Double Discrete Fourier Transform (DTF32) and Wavelet soothed Fourier soothed price series to suit your analytical needs.
Image of Wavelet transform with FAST settings, Double Fourier transform with FAST settings. Improved noice reduction with SLOW settings, and standard FSVZO with SLOW settings:
Fast setting are setting by default:
VZO length = 2
NoiceR max Length = 2
Slow settings are:
VZO length = 5 or 7
NoiceR max Length = 8
As you can see fast setting are more volatile. I suggest averaging fast setting on 4h 12h 1d 2d 3d 4d W and M Timeframe to get a clear view on market trend.
What if I want long only when VZO is rising and above 15 not 0?
You have set Setting VzoDifference to 15. That reduces the number of trend changes.
Example of W&FSVZO with VzoDifference 15 than 0:
VZO crossed 0 line but not 15 line and that's why Indicator returns 0 in one case an 1 in another.
What is Smooth length setting?
A way of calculating Bullish or Bearish (W&)FSVZO .
If smooth length is 2 the trend is rising if:
rising = VZO > ta.ema(VZO, 2)
Meaning that we check if VZO is higher that exponential average of the last 2 elements.
If smooth length is 1 the trend is rising if:
rising = VZO_ > VZO_
Use this Strategy to fine-tune inputs for the (W&)FSVZO Indicator.
(Strategy allows you to fine-tune the indicator for 1 TimeFrame at a time; cross Timeframe Input fine-tuning is done manually after exporting the chart data)
I suggest using " Close all " input False when fine-tuning Inputs for 1 TimeFrame . When you export data to Excel/Numbers/GSheets I suggest using " Close all " input as True , except for the lowest TimeFrame . I suggest using 100% equity as your default quantity for fine-tune purposes. I have to mention that 100% equity may lead to unrealistic backtesting results. Be avare. When backtesting for trading purposes use Contracts or USDT.

Fine-Tune Inputs: Fourier Smoothed Hybrid Volume Spread AnalysisUse this Strategy to Fine-tune inputs for the HSHVSA Indicator.
Strategy allows you to fine-tune the indicator for 1 TimeFrame at a time; cross Timeframe Input fine-tuning is done manually after exporting the chart data.
I suggest using " Close all " input False when fine-tuning Inputs for 1 TimeFrame. When you export data to Excel/Numbers/GSheets I suggest using " Close all " input as True , except for the lowest TimeFrame.
MEANINGFUL DESCRIPTION:
The Fourier Smoothed Hybrid Volume Spread Analysis (FSHVSA) Strategy/Indicator is an innovative trading tool designed to fuse volume analysis with trend detection capabilities, offering traders a comprehensive view of market dynamics.
This Strategy/Indicator stands apart by integrating the principles of the Discrete Fourier Transform (DFT) and volume spread analysis, enhanced with a layer of Fourier smoothing to distill market noise and highlight trend directions with unprecedented clarity.
This smoothing process allows traders to discern the true underlying patterns in volume and price action, stripped of the distractions of short-term fluctuations and noise.
The core functionality of the FSHVSA revolves around the innovative combination of volume change analysis, spread determination (calculated from the open and close price difference), and the strategic use of the EMA (default 10) to fine-tune the analysis of spread by incorporating volume changes.
Trend direction is validated through a moving average (MA) of the histogram, which acts analogously to the Volume MA found in traditional volume indicators. This MA serves as a pivotal reference point, enabling traders to confidently engage with the market when the histogram's movement concurs with the trend direction, particularly when it crosses the Trend MA line, signalling optimal entry points.
It returns 0 when MA of the histogram and EMA of the Price Spread are not align.
WHAT IS FSHVSA INDICATOR:
The FSHVSA plots a positive trend when a positive Volume smoothed Spread and EMA of Volume smoothed price is above 0, and a negative when negative Volume smoothed Spread and EMA of Volume smoothed price is below 0. When this conditions are not met it plots 0.
HOW TO USE THE STRATEGY:
Here you fine-tune the inputs until you find a combination that works well on all Timeframes you will use when creating your Automated Trade Algorithmic Strategy. I suggest 4h, 12h, 1D, 2D, 3D, 4D, 5D, 6D, W and M.
ORIGINALITY & USEFULNESS:
The FSHVSA Strategy is unique because it applies DFT for data smoothing, effectively filtering out the minor fluctuations and leaving traders with a clear picture of the market's true movements. The DFT's ability to break down market signals into constituent frequencies offers a granular view of market dynamics, highlighting the amplitude and phase of each frequency component. This, combined with the strategic application of Ehler's Universal Oscillator principles via a histogram, furnishes traders with a nuanced understanding of market volatility and noise levels, thereby facilitating more informed trading decisions.
DETAILED DESCRIPTION:
My detailed description of the indicator and use cases which I find very valuable.
What is the meaning of price spread?
In finance, a spread refers to the difference between two prices, rates, or yields. One of the most common types is the bid-ask spread, which refers to the gap between the bid (from buyers) and the ask (from sellers) prices of a security or asset.
We are going to use Open-Close spread.
What is Volume spread analysis?
Volume spread analysis (VSA) is a method of technical analysis that compares the volume per candle, range spread, and closing price to determine price direction.
What does this mean?
We need to have a positive Volume Price Spread and a positive Moving average of Volume price spread for a positive trend. OR via versa a negative Volume Price Spread and a negative Moving average of Volume price spread for a negative trend.
What if we have a positive Volume Price Spread and a negative Moving average of Volume Price Spread?
It results in a neutral, not trending price action.
Thus the Indicator/Strategy returns 0 and Closes all long and short positions.
In the next Image you can see that trend is negative on 4h, we just move Negative on 12h and Positive on 1D. That means trend/Strategy flipped negative .
I am sorry, the chart is a bit messy. The idea is to use the indicator/strategy over more than 1 Timeframe.
Use this Strategy to fine-tune inputs for the HSHVSA Indicator.
(Strategy allows you to fine-tune the indicator for 1 TimeFrame at a time; cross Timeframe Input fine-tuning is done manually after exporting the chart data)
I suggest using " Close all " input False when fine-tuning Inputs for 1 TimeFrame. When you export data to Excel/Numbers/GSheets I suggest using " Close all " input as True , except for the lowest TimeFrame. I suggest using 100% equity as your default quantity for fine-tune purposes. I have to mention that 100% equity may lead to unrealistic backtesting results. Be avare. When backtesting for trading purposes use Contracts or USDT.

Fourier Smoothed Hybrid Volume Spread AnalysisIndicator id:
USER;91bdff47320b4284a375f428f683b21e
(only relevant to those that use API requests)
MEANINGFUL DESCRIPTION:
The Fourier Smoothed Hybrid Volume Spread Analysis (FSHVSA) indicator is an innovative trading tool designed to fuse volume analysis with trend detection capabilities, offering traders a comprehensive view of market dynamics.
This indicator stands apart by integrating the principles of the Discrete Fourier Transform (DFT) and volume spread analysis, enhanced with a layer of Fourier smoothing to distill market noise and highlight trend directions with unprecedented clarity.
This smoothing process allows traders to discern the true underlying patterns in volume and price action, stripped of the distractions of short-term fluctuations and noise.
The core functionality of the FSHVSA revolves around the innovative combination of volume change analysis, spread determination (calculated from the open and close price difference), and the strategic use of the EMA (default 10) to fine-tune the analysis of spread by incorporating volume changes.
Trend direction is validated through a moving average (MA) of the histogram, which acts analogously to the Volume MA found in traditional volume indicators. This MA serves as a pivotal reference point, enabling traders to confidently engage with the market when the histogram's movement concurs with the trend direction, particularly when it crosses the Trend MA line, signalling optimal entry points.
It returns 0 when MA of the histogram and EMA of the Price Spread are not align.
HOW TO USE THE INDICATOR:
The FSHVSA plots a positive trend when a positive Volume smoothed Spread and EMA of Volume smoothed price is above 0, and a negative when negative Volume smoothed Spread and EMA of Volume smoothed price is below 0. When this conditions are not met it plots 0.
ORIGINALITY & USEFULNESS:
The FSHVSA is unique because it applies DFT for data smoothing, effectively filtering out the minor fluctuations and leaving traders with a clear picture of the market's true movements. The DFT's ability to break down market signals into constituent frequencies offers a granular view of market dynamics, highlighting the amplitude and phase of each frequency component. This, combined with the strategic application of Ehler's Universal Oscillator principles via a histogram, furnishes traders with a nuanced understanding of market volatility and noise levels, thereby facilitating more informed trading decisions.
DETAILED DESCRIPTION:
My detailed description of the indicator and use cases which I find very valuable.
What is the meaning of price spread?
In finance, a spread refers to the difference between two prices, rates, or yields. One of the most common types is the bid-ask spread, which refers to the gap between the bid (from buyers) and the ask (from sellers) prices of a security or asset.
We are going to use Open-Close spread.
What is Volume spread analysis?
Volume spread analysis (VSA) is a method of technical analysis that compares the volume per candle, range spread, and closing price to determine price direction.
What does this mean?
We need to have a positive Volume Price Spread and a positive Moving average of Volume price spread for a positive trend. OR via versa a negative Volume Price Spread and a negative Moving average of Volume price spread for a negative trend.
What if we have a positive Volume Price Spread and a negative Moving average of Volume Price Spread ?
It results in a neutral, not trending price action.
Thus the indicator returns 0.
In the next Image you can see that trend is negative on 4h, neutral on 12h and neutral on 1D. That means trend is negative .
I am sorry, the chart is a bit messy. The idea is to use the indicator over more than 1 Timeframe.
What is approximation and smoothing?
They are mathematical concepts for making a discrete set of numbers a
continuous curved line.
Fourier and Euler approximation of a spread are taken from aprox library.
Key Features:
Noise Reduction leverages Euler's White noise capabilities for effective Volume smoothing, providing a cleaner and more accurate representation of market dynamics.
Choose between the innovative Double Discrete Fourier Transform (DTF32) and Regular Open & Close price series.
Mathematical equations presented in Pinescript:
Fourier of the real (x axis) discrete:
x_0 = array.get(x, 0) + array.get(x, 1) + array.get(x, 2)
x_1 = array.get(x, 0) + array.get(x, 1) * math.cos( -2 * math.pi * _dir / 3 ) - array.get(y, 1) * math.sin( -2 * math.pi * _dir / 3 ) + array.get(x, 2) * math.cos( -4 * math.pi * _dir / 3 ) - array.get(y, 2) * math.sin( -4 * math.pi * _dir / 3 )
x_2 = array.get(x, 0) + array.get(x, 1) * math.cos( -4 * math.pi * _dir / 3 ) - array.get(y, 1) * math.sin( -4 * math.pi * _dir / 3 ) + array.get(x, 2) * math.cos( -8 * math.pi * _dir / 3 ) - array.get(y, 2) * math.sin( -8 * math.pi * _dir / 3 )
Fourier of the imaginary (y axis) discrete:
y_0 = array.get(x, 0) + array.get(x, 1) + array.get(x, 2)
y_1 = array.get(x, 0) + array.get(x, 1) * math.sin( -2 * math.pi * _dir / 3 ) + array.get(y, 1) * math.cos( -2 * math.pi * _dir / 3 ) + array.get(x, 2) * math.sin( -4 * math.pi * _dir / 3 ) + array.get(y, 2) * math.cos( -4 * math.pi * _dir / 3 )
y_2 = array.get(x, 0) + array.get(x, 1) * math.sin( -4 * math.pi * _dir / 3 ) + array.get(y, 1) * math.cos( -4 * math.pi * _dir / 3 ) + array.get(x, 2) * math.sin( -8 * math.pi * _dir / 3 ) + array.get(y, 2) * math.cos( -8 * math.pi * _dir / 3 )
Euler's Smooth with Discrete Furrier approximated Volume.
a = math.sqrt(2) * math.pi / _devided
b = math.cos(math.sqrt(2) * 180 / _devided)
c2 = 2 * math.pow(a, 2) * b
c3 = math.pow(a, 4)
c1 = 1 - 2 * math.pow(a, 2) * math.cos(b) + math.pow(a, 4)
filt := na(filt ) ? 0 : c1 * (w + nz(w )) / 2.0 + c2 * nz(filt ) + c3 * nz(filt )
Usecase:
First option:
Leverage the script to identify Bullish and Bearish trends, shown with green and red triangle.
Combine Different Timeframes to accurately determine market trend.
Second option:
Pull the data with API sockets to automate your trading journey.
plot(close, title="ClosePrice", display=display.status_line)
plot(open, title="OpenPrice", display=display.status_line)
plot(greencon ? 1 : redcon ? -1 : 0, title="position", display=display.status_line)
Use ClosePrice, OpenPrice and "position" titles to easily read and backtest your strategy utilising more than 1 Time Frame.
Indicator id:
USER;91bdff47320b4284a375f428f683b21e
(only relevant to those that use API requests)
Wavelet & Fourier Smoothed Volume zone oscillator (W&)FSVZO Indicator id:
USER;e7a774913c1242c3b1354334a8ea0f3c
(only relevant to those that use API requests)
MEANINGFUL DESCRIPTION:
The Volume Zone oscillator breaks up volume activity into positive and negative categories. It is positive when the current closing price is greater than the prior closing price and negative when it's lower than the prior closing price. The resulting curve plots through relative percentage levels that yield a series of buy and sell signals, depending on level and indicator direction.
The Wavelet & Fourier Smoothed Volume Zone Oscillator (W&)FSVZO is a refined version of the Volume Zone Oscillator, enhanced by the implementation of the Discrete Fourier Transform. Its primary function is to streamline price data and diminish market noise, thus offering a clearer and more precise reflection of price trends.
By combining the Wavalet and Fourier aproximation with Ehler's white noise histogram, users gain a comprehensive perspective on volume-related market conditions.
HOW TO USE THE INDICATOR:
The default period is 2 but can be adjusted after backtesting. (I suggest 5 VZO length and NoiceR max length 8 as-well)
The VZO points to a positive trend when it is rising above the 0% level, and a negative trend when it is falling below the 0% level. 0% level can be adjusted in setting by adjusting VzoDifference. Oscillations rising below 0% level or falling above 0% level result in natural trend.
ORIGINALITY & USFULLNESS:
Personal combination of Fourier and Wavalet aproximation of a price which results in less noise Volume Zone Oscillator.
The Wavelet Transform is a powerful mathematical tool for signal analysis, particularly effective in analyzing signals with varying frequency or non-stationary characteristics. It dissects a signal into wavelets, small waves with varying frequency and limited duration, providing a multi-resolution analysis. This approach captures both frequency and location information, making it especially useful for detecting changes or anomalies in complex signals.
The Discrete Fourier Transform (DFT) is a mathematical technique that transforms discrete data from the time domain into its corresponding representation in the frequency domain. This process involves breaking down a signal into its individual frequency components, thereby exposing the amplitude and phase characteristics inherent in each frequency element.
This indicator utilizes the concept of Ehler's Universal Oscillator and displays a histogram, offering critical insights into the prevailing levels of market noise. The Ehler's Universal Oscillator is grounded in a statistical model that captures the erratic and unpredictable nature of market movements. Through the application of this principle, the histogram aids traders in pinpointing times when market volatility is either rising or subsiding.
DETAILED DESCRIPTION:
My detailed description of the indicator and use cases which I find very valuable.
What is oscillator?
Oscillators are chart indicators that can assist a trader in determining overbought or oversold conditions in ranging (non-trending) markets.
What is volume zone oscillator?
Price Zone Oscillator measures if the most recent closing price is above or below the preceding closing price.
Volume Zone Oscillator is Volume multiplied by the 1 or -1 depending on the difference of the preceding 2 close prices and smoothed with Exponential moving Average.
What does this mean?
If the VZO is above 0 and VZO is rising. We have a bullish trend. Most likely.
If the VZO is below 0 and VZO is falling. We have a bearish trend. Most likely.
Rising means that VZO on close is higher than the previous day.
Falling means that VZO on close is lower than the previous day.
What if VZO is falling above 0 line?
It means we have a high probability of a bearish trend.
Thus the indicator returns 0 when falling above 0 (or rising bellow 0) and we combine higher and lower timeframes to gauge the trend.
In the next Image you can see that trend is positive on 4h, neutral on 12h and positive on 1D. That means trend is positive.
I am sorry, the chart is a bit messy. The idea is to use the indicator over more than 1 Timeframe.
What is approximation and smoothing?
They are mathematical concepts for making a discrete set of numbers a
continuous curved line.
Fourier and Wavelet approximation of a close price are taken from aprox library.
Key Features:
You can tailor the indicator to your preferences with adjustable parameters such as VZO length, noise reduction settings, and smoothing length.
Volume Zone Oscillator (VZO) shows market sentiment with the VZO, enhanced with Exponential Moving Average (EMA) smoothing for clearer trend identification.
Noise Reduction leverages Euler's White noise capabilities for effective noise reduction in the VZO, providing a cleaner and more accurate representation of market dynamics.
Choose between the traditional Fast Fourier Transform (FFT), the innovative Double Discrete Fourier Transform (DTF32) and Wavelet soothed Fourier soothed price series to suit your analytical needs.
Image of Wavelet transform with FAST settings, Double Fourier transform with FAST settings. Improved noice reduction with SLOW settings, and standard FSVZO with SLOW settings:
Fast setting are setting by default:
VZO length = 2
NoiceR max Length = 2
Slow settings are:
VZO length = 5 or 7
NoiceR max Length = 8
As you can see fast setting are more volatile. I suggest averaging fast setting on 4h 12h 1d 2d 3d 4d W and M Timeframe to get a clear view on market trend.
What if I want long only when VZO is rising and above 15 not 0?
You have set Setting VzoDifference to 15. That reduces the number of trend changes.
Example of W&FSVZO with VzoDifference 15 than 0:
VZO crossed 0 line but not 15 line and that's why Indicator returns 0 in one case an 1 in another.
What is Smooth length setting?
A way of calculating Bullish or Bearish FSVZO.
If smooth length is 2 the trend is rising if:
rising = VZO > ta.ema(VZO, 2)
Meaning that we check if VZO is higher that exponential average of the last 2 elements.
If smooth length is 1 the trend is rising if:
rising = VZO_ > VZO_
Rising is boolean value, meaning TRUE if rising and FALSE if falling.
Mathematical equations presented in Pinescript:
Fourier of the real (x axis) discrete:
x_0 = array.get(x, 0) + array.get(x, 1) + array.get(x, 2)
x_1 = array.get(x, 0) + array.get(x, 1) * math.cos( -2 * math.pi * _dir / 3 ) - array.get(y, 1) * math.sin( -2 * math.pi * _dir / 3 ) + array.get(x, 2) * math.cos( -4 * math.pi * _dir / 3 ) - array.get(y, 2) * math.sin( -4 * math.pi * _dir / 3 )
x_2 = array.get(x, 0) + array.get(x, 1) * math.cos( -4 * math.pi * _dir / 3 ) - array.get(y, 1) * math.sin( -4 * math.pi * _dir / 3 ) + array.get(x, 2) * math.cos( -8 * math.pi * _dir / 3 ) - array.get(y, 2) * math.sin( -8 * math.pi * _dir / 3 )
Euler's Noice reduction with both close and Discrete Furrier approximated price.
w = (dft1*src - dft1 *src ) / math.sqrt(math.pow(math.abs(src- src ),2) + math.pow(math.abs(dft1 - dft1 ),2))
filt := na(filt ) ? 0 : c1 * (w*dft1 + nz(w *dft1 )) / 2.0 /math.abs(dft1 -dft1 ) + c2 * nz(filt ) - c3 * nz(filt )
Usecase:
First option:
Select the preferred version of DFT and noise reduction settings based on your analysis requirements.
Leverage the script to identify Bullish and Bearish trends, shown with green and red triangle.
Combine Different Timeframes to accurately determine market trend.
Second option:
Pull the data with API sockets to automate your trading journey.
plot(close, title="ClosePrice", display=display.status_line)
plot(open, title="OpenPrice", display=display.status_line)
plot(greencon ? 1 : redcon ? -1 : 0, title="position", display=display.status_line)
Use ClosePrice, OpenPrice and "position" titles to easily read and backtest your strategy utilising more than 1 Time Frame.
Indicator id:
USER;e7a774913c1242c3b1354334a8ea0f3c
(only relevant to those that use API requests)

Discrete Fourier Transformed Money Flow IndexThe Discrete Fourier Transform Money Flow Index indicator integrates the Money Flow Index (MFI) with Discrete Fourier Transform (credit to author wbburgin - May 26 2023 ) smoothing to offer a refined and smoothed depiction of the MFI's underlying trend. The MFI is calculated using the formula: MFI = 100 - (100 / (1 + MR)), where a high MFI value indicates robust buying pressure (signaling an overbought condition), and a low MFI value indicates substantial selling pressure (signaling an oversold condition).
Why is the DFT and MFI combined?
The aim of this combination between DFT and MFI is to effectively filter out short-term fluctuations and noise, enabling a clearer assessment of the overall trend. This smoothing process enhances the reliability of the MFI by emphasizing dominant and sustained buying or selling pressures. This script executes a full DFT but only uses filtering from one frequency component. The choice to focus on the magnitude at index 0 is significant as it captures the dominant or fundamental frequency in the data. By analyzing this primary cyclic behavior, we can identify recurring patterns and potential turning points more easily. This streamlined approach simplifies interpretation and enhances efficiency by reducing complexity associated with multiple frequency components. Overall, focusing on the dominant frequency and applying it to the MFI provides a concise and actionable assessment of the underlying data.
Note: The FMFI indicator provides both smoothed and non-smoothed versions of the MFI, with the option to toggle the original non-smoothed MFI on or off in the settings.
Application
FMFI functions as a trend-following indicator. Bullish trends are denoted by the color white, while bearish trends are represented by the color purple. Circles plotted on the FMFI indicate regular bull and bear signals. Additionally, red arrows indicate a strong negative trend, while green arrows indicate a strong positive trend. These arrows are calculated based on the presence of regular bull and bear signals within overbought and oversold zones. To enhance its effectiveness, it is recommended to combine this indicator with other complementary technical analysis tools and integrate it into a comprehensive trading strategy. Traders are encouraged to explore a wide range of settings and timeframes to align the indicator with their unique trading preferences and adapt it to the current market conditions. By doing so, traders can optimize the indicator's performance and increase their potential for successful trading outcomes.
Utility
Traders and investors can employ this indicator to enhance their trend-following strategies. The white-colored components of the FMFI can help identify potential buying zones, while the purple-colored components can assist in identifying potential selling points. The red and green arrows can be used to pinpoint moments of strong bull or bear momentum, allowing traders to position themselves advantageously in their trading activities. Please note that future performance of any trading strategy is fundamentally unknowable, and past results do not guarantee future performance.

Quinn-Fernandes Fourier Transform of Filtered Price [Loxx]Down the Rabbit Hole We Go: A Deep Dive into the Mysteries of Quinn-Fernandes Fast Fourier Transform and Hodrick-Prescott Filtering
In the ever-evolving landscape of financial markets, the ability to accurately identify and exploit underlying market patterns is of paramount importance. As market participants continuously search for innovative tools to gain an edge in their trading and investment strategies, advanced mathematical techniques, such as the Quinn-Fernandes Fourier Transform and the Hodrick-Prescott Filter, have emerged as powerful analytical tools. This comprehensive analysis aims to delve into the rich history and theoretical foundations of these techniques, exploring their applications in financial time series analysis, particularly in the context of a sophisticated trading indicator. Furthermore, we will critically assess the limitations and challenges associated with these transformative tools, while offering practical insights and recommendations for overcoming these hurdles to maximize their potential in the financial domain.
Our investigation will begin with a comprehensive examination of the origins and development of both the Quinn-Fernandes Fourier Transform and the Hodrick-Prescott Filter. We will trace their roots from classical Fourier analysis and time series smoothing to their modern-day adaptive iterations. We will elucidate the key concepts and mathematical underpinnings of these techniques and demonstrate how they are synergistically used in the context of the trading indicator under study.
As we progress, we will carefully consider the potential drawbacks and challenges associated with using the Quinn-Fernandes Fourier Transform and the Hodrick-Prescott Filter as integral components of a trading indicator. By providing a critical evaluation of their computational complexity, sensitivity to input parameters, assumptions about data stationarity, performance in noisy environments, and their nature as lagging indicators, we aim to offer a balanced and comprehensive understanding of these powerful analytical tools.
In conclusion, this in-depth analysis of the Quinn-Fernandes Fourier Transform and the Hodrick-Prescott Filter aims to provide a solid foundation for financial market participants seeking to harness the potential of these advanced techniques in their trading and investment strategies. By shedding light on their history, applications, and limitations, we hope to equip traders and investors with the knowledge and insights necessary to make informed decisions and, ultimately, achieve greater success in the highly competitive world of finance.
█ Fourier Transform and Hodrick-Prescott Filter in Financial Time Series Analysis
Financial time series analysis plays a crucial role in making informed decisions about investments and trading strategies. Among the various methods used in this domain, the Fourier Transform and the Hodrick-Prescott (HP) Filter have emerged as powerful techniques for processing and analyzing financial data. This section aims to provide a comprehensive understanding of these two methodologies, their significance in financial time series analysis, and their combined application to enhance trading strategies.
█ The Quinn-Fernandes Fourier Transform: History, Applications, and Use in Financial Time Series Analysis
The Quinn-Fernandes Fourier Transform is an advanced spectral estimation technique developed by John J. Quinn and Mauricio A. Fernandes in the early 1990s. It builds upon the classical Fourier Transform by introducing an adaptive approach that improves the identification of dominant frequencies in noisy signals. This section will explore the history of the Quinn-Fernandes Fourier Transform, its applications in various domains, and its specific use in financial time series analysis.
History of the Quinn-Fernandes Fourier Transform
The Quinn-Fernandes Fourier Transform was introduced in a 1993 paper titled "The Application of Adaptive Estimation to the Interpolation of Missing Values in Noisy Signals." In this paper, Quinn and Fernandes developed an adaptive spectral estimation algorithm to address the limitations of the classical Fourier Transform when analyzing noisy signals.
The classical Fourier Transform is a powerful mathematical tool that decomposes a function or a time series into a sum of sinusoids, making it easier to identify underlying patterns and trends. However, its performance can be negatively impacted by noise and missing data points, leading to inaccurate frequency identification.
Quinn and Fernandes sought to address these issues by developing an adaptive algorithm that could more accurately identify the dominant frequencies in a noisy signal, even when data points were missing. This adaptive algorithm, now known as the Quinn-Fernandes Fourier Transform, employs an iterative approach to refine the frequency estimates, ultimately resulting in improved spectral estimation.
Applications of the Quinn-Fernandes Fourier Transform
The Quinn-Fernandes Fourier Transform has found applications in various fields, including signal processing, telecommunications, geophysics, and biomedical engineering. Its ability to accurately identify dominant frequencies in noisy signals makes it a valuable tool for analyzing and interpreting data in these domains.
For example, in telecommunications, the Quinn-Fernandes Fourier Transform can be used to analyze the performance of communication systems and identify interference patterns. In geophysics, it can help detect and analyze seismic signals and vibrations, leading to improved understanding of geological processes. In biomedical engineering, the technique can be employed to analyze physiological signals, such as electrocardiograms, leading to more accurate diagnoses and better patient care.
Use of the Quinn-Fernandes Fourier Transform in Financial Time Series Analysis
In financial time series analysis, the Quinn-Fernandes Fourier Transform can be a powerful tool for isolating the dominant cycles and frequencies in asset price data. By more accurately identifying these critical cycles, traders can better understand the underlying dynamics of financial markets and develop more effective trading strategies.
The Quinn-Fernandes Fourier Transform is used in conjunction with the Hodrick-Prescott Filter, a technique that separates the underlying trend from the cyclical component in a time series. By first applying the Hodrick-Prescott Filter to the financial data, short-term fluctuations and noise are removed, resulting in a smoothed representation of the underlying trend. This smoothed data is then subjected to the Quinn-Fernandes Fourier Transform, allowing for more accurate identification of the dominant cycles and frequencies in the asset price data.
By employing the Quinn-Fernandes Fourier Transform in this manner, traders can gain a deeper understanding of the underlying dynamics of financial time series and develop more effective trading strategies. The enhanced knowledge of market cycles and frequencies can lead to improved risk management and ultimately, better investment performance.
The Quinn-Fernandes Fourier Transform is an advanced spectral estimation technique that has proven valuable in various domains, including financial time series analysis. Its adaptive approach to frequency identification addresses the limitations of the classical Fourier Transform when analyzing noisy signals, leading to more accurate and reliable analysis. By employing the Quinn-Fernandes Fourier Transform in financial time series analysis, traders can gain a deeper understanding of the underlying financial instrument.
Drawbacks to the Quinn-Fernandes algorithm
While the Quinn-Fernandes Fourier Transform is an effective tool for identifying dominant cycles and frequencies in financial time series, it is not without its drawbacks. Some of the limitations and challenges associated with this indicator include:
1. Computational complexity: The adaptive nature of the Quinn-Fernandes Fourier Transform requires iterative calculations, which can lead to increased computational complexity. This can be particularly challenging when analyzing large datasets or when the indicator is used in real-time trading environments.
2. Sensitivity to input parameters: The performance of the Quinn-Fernandes Fourier Transform is dependent on the choice of input parameters, such as the number of harmonic periods, frequency tolerance, and Hodrick-Prescott filter settings. Choosing inappropriate parameter values can lead to inaccurate frequency identification or reduced performance. Finding the optimal parameter settings can be challenging, and may require trial and error or a more sophisticated optimization process.
3. Assumption of stationary data: The Quinn-Fernandes Fourier Transform assumes that the underlying data is stationary, meaning that its statistical properties do not change over time. However, financial time series data is often non-stationary, with changing trends and volatility. This can limit the effectiveness of the indicator and may require additional preprocessing steps, such as detrending or differencing, to ensure the data meets the assumptions of the algorithm.
4. Limitations in noisy environments: Although the Quinn-Fernandes Fourier Transform is designed to handle noisy signals, its performance may still be negatively impacted by significant noise levels. In such cases, the identification of dominant frequencies may become less reliable, leading to suboptimal trading signals or strategies.
5. Lagging indicator: As with many technical analysis tools, the Quinn-Fernandes Fourier Transform is a lagging indicator, meaning that it is based on past data. While it can provide valuable insights into historical market dynamics, its ability to predict future price movements may be limited. This can result in false signals or late entries and exits, potentially reducing the effectiveness of trading strategies based on this indicator.
Despite these drawbacks, the Quinn-Fernandes Fourier Transform remains a valuable tool for financial time series analysis when used appropriately. By being aware of its limitations and adjusting input parameters or preprocessing steps as needed, traders can still benefit from its ability to identify dominant cycles and frequencies in financial data, and use this information to inform their trading strategies.
█ Deep-dive into the Hodrick-Prescott Fitler
The Hodrick-Prescott (HP) filter is a statistical tool used in economics and finance to separate a time series into two components: a trend component and a cyclical component. It is a powerful tool for identifying long-term trends in economic and financial data and is widely used by economists, central banks, and financial institutions around the world.
The HP filter was first introduced in the 1990s by economists Robert Hodrick and Edward Prescott. It is a simple, two-parameter filter that separates a time series into a trend component and a cyclical component. The trend component represents the long-term behavior of the data, while the cyclical component captures the shorter-term fluctuations around the trend.
The HP filter works by minimizing the following objective function:
Minimize: (Sum of Squared Deviations) + λ (Sum of Squared Second Differences)
Where:
1. The first term represents the deviation of the data from the trend.
2. The second term represents the smoothness of the trend.
3. λ is a smoothing parameter that determines the degree of smoothness of the trend.
The smoothing parameter λ is typically set to a value between 100 and 1600, depending on the frequency of the data. Higher values of λ lead to a smoother trend, while lower values lead to a more volatile trend.
The HP filter has several advantages over other smoothing techniques. It is a non-parametric method, meaning that it does not make any assumptions about the underlying distribution of the data. It also allows for easy comparison of trends across different time series and can be used with data of any frequency.
Another significant advantage of the HP Filter is its ability to adapt to changes in the underlying trend. This feature makes it particularly well-suited for analyzing financial time series, which often exhibit non-stationary behavior. By employing the HP Filter to smooth financial data, traders can more accurately identify and analyze the long-term trends that drive asset prices, ultimately leading to better-informed investment decisions.
However, the HP filter also has some limitations. It assumes that the trend is a smooth function, which may not be the case in some situations. It can also be sensitive to changes in the smoothing parameter λ, which may result in different trends for the same data. Additionally, the filter may produce unrealistic trends for very short time series.
Despite these limitations, the HP filter remains a valuable tool for analyzing economic and financial data. It is widely used by central banks and financial institutions to monitor long-term trends in the economy, and it can be used to identify turning points in the business cycle. The filter can also be used to analyze asset prices, exchange rates, and other financial variables.
The Hodrick-Prescott filter is a powerful tool for analyzing economic and financial data. It separates a time series into a trend component and a cyclical component, allowing for easy identification of long-term trends and turning points in the business cycle. While it has some limitations, it remains a valuable tool for economists, central banks, and financial institutions around the world.
█ Combined Application of Fourier Transform and Hodrick-Prescott Filter
The integration of the Fourier Transform and the Hodrick-Prescott Filter in financial time series analysis can offer several benefits. By first applying the HP Filter to the financial data, traders can remove short-term fluctuations and noise, effectively isolating the underlying trend. This smoothed data can then be subjected to the Fourier Transform, allowing for the identification of dominant cycles and frequencies with greater precision.
By combining these two powerful techniques, traders can gain a more comprehensive understanding of the underlying dynamics of financial time series. This enhanced knowledge can lead to the development of more effective trading strategies, better risk management, and ultimately, improved investment performance.
The Fourier Transform and the Hodrick-Prescott Filter are powerful tools for financial time series analysis. Each technique offers unique benefits, with the Fourier Transform being adept at identifying dominant cycles and frequencies, and the HP Filter excelling at isolating long-term trends from short-term noise. By combining these methodologies, traders can develop a deeper understanding of the underlying dynamics of financial time series, leading to more informed investment decisions and improved trading strategies. As the financial markets continue to evolve, the combined application of these techniques will undoubtedly remain an essential aspect of modern financial analysis.
█ Features
Endpointed and Non-repainting
This is an endpointed and non-repainting indicator. These are crucial factors that contribute to its usefulness and reliability in trading and investment strategies. Let us break down these concepts and discuss why they matter in the context of a financial indicator.
1. Endpoint nature: An endpoint indicator uses the most recent data points to calculate its values, ensuring that the output is timely and reflective of the current market conditions. This is in contrast to non-endpoint indicators, which may use earlier data points in their calculations, potentially leading to less timely or less relevant results. By utilizing the most recent data available, the endpoint nature of this indicator ensures that it remains up-to-date and relevant, providing traders and investors with valuable and actionable insights into the market dynamics.
2. Non-repainting characteristic: A non-repainting indicator is one that does not change its values or signals after they have been generated. This means that once a signal or a value has been plotted on the chart, it will remain there, and future data will not affect it. This is crucial for traders and investors, as it offers a sense of consistency and certainty when making decisions based on the indicator's output.
Repainting indicators, on the other hand, can change their values or signals as new data comes in, effectively "repainting" the past. This can be problematic for several reasons:
a. Misleading results: Repainting indicators can create the illusion of a highly accurate or successful trading system when backtesting, as the indicator may adapt its past signals to fit the historical price data. This can lead to overly optimistic performance results that may not hold up in real-time trading.
b. Decision-making uncertainty: When an indicator repaints, it becomes challenging for traders and investors to trust its signals, as the signal that prompted a trade may change or disappear after the fact. This can create confusion and indecision, making it difficult to execute a consistent trading strategy.
The endpoint and non-repainting characteristics of this indicator contribute to its overall reliability and effectiveness as a tool for trading and investment decision-making. By providing timely and consistent information, this indicator helps traders and investors make well-informed decisions that are less likely to be influenced by misleading or shifting data.
Inputs
Source: This input determines the source of the price data to be used for the calculations. Users can select from options like closing price, opening price, high, low, etc., based on their preferences. Changing the source of the price data (e.g., from closing price to opening price) will alter the base data used for calculations, which may lead to different patterns and cycles being identified.
Calculation Bars: This input represents the number of past bars used for the calculation. A higher value will use more historical data for the analysis, while a lower value will focus on more recent price data. Increasing the number of past bars used for calculation will incorporate more historical data into the analysis. This may lead to a more comprehensive understanding of long-term trends but could also result in a slower response to recent price changes. Decreasing this value will focus more on recent data, potentially making the indicator more responsive to short-term fluctuations.
Harmonic Period: This input represents the harmonic period, which is the number of harmonics used in the Fourier Transform. A higher value will result in more harmonics being used, potentially capturing more complex cycles in the price data. Increasing the harmonic period will include more harmonics in the Fourier Transform, potentially capturing more complex cycles in the price data. However, this may also introduce more noise and make it harder to identify clear patterns. Decreasing this value will focus on simpler cycles and may make the analysis clearer, but it might miss out on more complex patterns.
Frequency Tolerance: This input represents the frequency tolerance, which determines how close the frequencies of the harmonics must be to be considered part of the same cycle. A higher value will allow for more variation between harmonics, while a lower value will require the frequencies to be more similar. Increasing the frequency tolerance will allow for more variation between harmonics, potentially capturing a broader range of cycles. However, this may also introduce noise and make it more difficult to identify clear patterns. Decreasing this value will require the frequencies to be more similar, potentially making the analysis clearer, but it might miss out on some cycles.
Number of Bars to Render: This input determines the number of bars to render on the chart. A higher value will result in more historical data being displayed, but it may also slow down the computation due to the increased amount of data being processed. Increasing the number of bars to render on the chart will display more historical data, providing a broader context for the analysis. However, this may also slow down the computation due to the increased amount of data being processed. Decreasing this value will speed up the computation, but it will provide less historical context for the analysis.
Smoothing Mode: This input allows the user to choose between two smoothing modes for the source price data: no smoothing or Hodrick-Prescott (HP) smoothing. The choice depends on the user's preference for how the price data should be processed before the Fourier Transform is applied. Choosing between no smoothing and Hodrick-Prescott (HP) smoothing will affect the preprocessing of the price data. Using HP smoothing will remove some of the short-term fluctuations from the data, potentially making the analysis clearer and more focused on longer-term trends. Not using smoothing will retain the original price fluctuations, which may provide more detail but also introduce noise into the analysis.
Hodrick-Prescott Filter Period: This input represents the Hodrick-Prescott filter period, which is used if the user chooses to apply HP smoothing to the price data. A higher value will result in a smoother curve, while a lower value will retain more of the original price fluctuations. Increasing the Hodrick-Prescott filter period will result in a smoother curve for the price data, emphasizing longer-term trends and minimizing short-term fluctuations. Decreasing this value will retain more of the original price fluctuations, potentially providing more detail but also introducing noise into the analysis.
Alets and signals
This indicator featues alerts, signals and bar coloring. You have to option to turn these on/off in the settings menu.
Maximum Bars Restriction
This indicator requires a large amount of processing power to render on the chart. To reduce overhead, the setting "Number of Bars to Render" is set to 500 bars. You can adjust this to you liking.
█ Related Indicators and Libraries
Goertzel Cycle Composite Wave
Goertzel Browser
Fourier Spectrometer of Price w/ Extrapolation Forecast
Fourier Extrapolator of 'Caterpillar' SSA of Price
Normalized, Variety, Fast Fourier Transform Explorer
Real-Fast Fourier Transform of Price Oscillator
Real-Fast Fourier Transform of Price w/ Linear Regression
Fourier Extrapolation of Variety Moving Averages
Fourier Extrapolator of Variety RSI w/ Bollinger Bands
Fourier Extrapolator of Price w/ Projection Forecast
Fourier Extrapolator of Price
STD-Stepped Fast Cosine Transform Moving Average
Variety RSI of Fast Discrete Cosine Transform
loxfft

Goertzel Cycle Composite Wave [Loxx]As the financial markets become increasingly complex and data-driven, traders and analysts must leverage powerful tools to gain insights and make informed decisions. One such tool is the Goertzel Cycle Composite Wave indicator, a sophisticated technical analysis indicator that helps identify cyclical patterns in financial data. This powerful tool is capable of detecting cyclical patterns in financial data, helping traders to make better predictions and optimize their trading strategies. With its unique combination of mathematical algorithms and advanced charting capabilities, this indicator has the potential to revolutionize the way we approach financial modeling and trading.
*** To decrease the load time of this indicator, only XX many bars back will render to the chart. You can control this value with the setting "Number of Bars to Render". This doesn't have anything to do with repainting or the indicator being endpointed***
█ Brief Overview of the Goertzel Cycle Composite Wave
The Goertzel Cycle Composite Wave is a sophisticated technical analysis tool that utilizes the Goertzel algorithm to analyze and visualize cyclical components within a financial time series. By identifying these cycles and their characteristics, the indicator aims to provide valuable insights into the market's underlying price movements, which could potentially be used for making informed trading decisions.
The Goertzel Cycle Composite Wave is considered a non-repainting and endpointed indicator. This means that once a value has been calculated for a specific bar, that value will not change in subsequent bars, and the indicator is designed to have a clear start and end point. This is an important characteristic for indicators used in technical analysis, as it allows traders to make informed decisions based on historical data without the risk of hindsight bias or future changes in the indicator's values. This means traders can use this indicator trading purposes.
The repainting version of this indicator with forecasting, cycle selection/elimination options, and data output table can be found here:
Goertzel Browser
The primary purpose of this indicator is to:
1. Detect and analyze the dominant cycles present in the price data.
2. Reconstruct and visualize the composite wave based on the detected cycles.
To achieve this, the indicator performs several tasks:
1. Detrending the price data: The indicator preprocesses the price data using various detrending techniques, such as Hodrick-Prescott filters, zero-lag moving averages, and linear regression, to remove the underlying trend and focus on the cyclical components.
2. Applying the Goertzel algorithm: The indicator applies the Goertzel algorithm to the detrended price data, identifying the dominant cycles and their characteristics, such as amplitude, phase, and cycle strength.
3. Constructing the composite wave: The indicator reconstructs the composite wave by combining the detected cycles, either by using a user-defined list of cycles or by selecting the top N cycles based on their amplitude or cycle strength.
4. Visualizing the composite wave: The indicator plots the composite wave, using solid lines for the cycles. The color of the lines indicates whether the wave is increasing or decreasing.
This indicator is a powerful tool that employs the Goertzel algorithm to analyze and visualize the cyclical components within a financial time series. By providing insights into the underlying price movements, the indicator aims to assist traders in making more informed decisions.
█ What is the Goertzel Algorithm?
The Goertzel algorithm, named after Gerald Goertzel, is a digital signal processing technique that is used to efficiently compute individual terms of the Discrete Fourier Transform (DFT). It was first introduced in 1958, and since then, it has found various applications in the fields of engineering, mathematics, and physics.
The Goertzel algorithm is primarily used to detect specific frequency components within a digital signal, making it particularly useful in applications where only a few frequency components are of interest. The algorithm is computationally efficient, as it requires fewer calculations than the Fast Fourier Transform (FFT) when detecting a small number of frequency components. This efficiency makes the Goertzel algorithm a popular choice in applications such as:
1. Telecommunications: The Goertzel algorithm is used for decoding Dual-Tone Multi-Frequency (DTMF) signals, which are the tones generated when pressing buttons on a telephone keypad. By identifying specific frequency components, the algorithm can accurately determine which button has been pressed.
2. Audio processing: The algorithm can be used to detect specific pitches or harmonics in an audio signal, making it useful in applications like pitch detection and tuning musical instruments.
3. Vibration analysis: In the field of mechanical engineering, the Goertzel algorithm can be applied to analyze vibrations in rotating machinery, helping to identify faulty components or signs of wear.
4. Power system analysis: The algorithm can be used to measure harmonic content in power systems, allowing engineers to assess power quality and detect potential issues.
The Goertzel algorithm is used in these applications because it offers several advantages over other methods, such as the FFT:
1. Computational efficiency: The Goertzel algorithm requires fewer calculations when detecting a small number of frequency components, making it more computationally efficient than the FFT in these cases.
2. Real-time analysis: The algorithm can be implemented in a streaming fashion, allowing for real-time analysis of signals, which is crucial in applications like telecommunications and audio processing.
3. Memory efficiency: The Goertzel algorithm requires less memory than the FFT, as it only computes the frequency components of interest.
4. Precision: The algorithm is less susceptible to numerical errors compared to the FFT, ensuring more accurate results in applications where precision is essential.
The Goertzel algorithm is an efficient digital signal processing technique that is primarily used to detect specific frequency components within a signal. Its computational efficiency, real-time capabilities, and precision make it an attractive choice for various applications, including telecommunications, audio processing, vibration analysis, and power system analysis. The algorithm has been widely adopted since its introduction in 1958 and continues to be an essential tool in the fields of engineering, mathematics, and physics.
█ Goertzel Algorithm in Quantitative Finance: In-Depth Analysis and Applications
The Goertzel algorithm, initially designed for signal processing in telecommunications, has gained significant traction in the financial industry due to its efficient frequency detection capabilities. In quantitative finance, the Goertzel algorithm has been utilized for uncovering hidden market cycles, developing data-driven trading strategies, and optimizing risk management. This section delves deeper into the applications of the Goertzel algorithm in finance, particularly within the context of quantitative trading and analysis.
Unveiling Hidden Market Cycles:
Market cycles are prevalent in financial markets and arise from various factors, such as economic conditions, investor psychology, and market participant behavior. The Goertzel algorithm's ability to detect and isolate specific frequencies in price data helps trader analysts identify hidden market cycles that may otherwise go unnoticed. By examining the amplitude, phase, and periodicity of each cycle, traders can better understand the underlying market structure and dynamics, enabling them to develop more informed and effective trading strategies.
Developing Quantitative Trading Strategies:
The Goertzel algorithm's versatility allows traders to incorporate its insights into a wide range of trading strategies. By identifying the dominant market cycles in a financial instrument's price data, traders can create data-driven strategies that capitalize on the cyclical nature of markets.
For instance, a trader may develop a mean-reversion strategy that takes advantage of the identified cycles. By establishing positions when the price deviates from the predicted cycle, the trader can profit from the subsequent reversion to the cycle's mean. Similarly, a momentum-based strategy could be designed to exploit the persistence of a dominant cycle by entering positions that align with the cycle's direction.
Enhancing Risk Management:
The Goertzel algorithm plays a vital role in risk management for quantitative strategies. By analyzing the cyclical components of a financial instrument's price data, traders can gain insights into the potential risks associated with their trading strategies.
By monitoring the amplitude and phase of dominant cycles, a trader can detect changes in market dynamics that may pose risks to their positions. For example, a sudden increase in amplitude may indicate heightened volatility, prompting the trader to adjust position sizing or employ hedging techniques to protect their portfolio. Additionally, changes in phase alignment could signal a potential shift in market sentiment, necessitating adjustments to the trading strategy.
Expanding Quantitative Toolkits:
Traders can augment the Goertzel algorithm's insights by combining it with other quantitative techniques, creating a more comprehensive and sophisticated analysis framework. For example, machine learning algorithms, such as neural networks or support vector machines, could be trained on features extracted from the Goertzel algorithm to predict future price movements more accurately.
Furthermore, the Goertzel algorithm can be integrated with other technical analysis tools, such as moving averages or oscillators, to enhance their effectiveness. By applying these tools to the identified cycles, traders can generate more robust and reliable trading signals.
The Goertzel algorithm offers invaluable benefits to quantitative finance practitioners by uncovering hidden market cycles, aiding in the development of data-driven trading strategies, and improving risk management. By leveraging the insights provided by the Goertzel algorithm and integrating it with other quantitative techniques, traders can gain a deeper understanding of market dynamics and devise more effective trading strategies.
█ Indicator Inputs
src: This is the source data for the analysis, typically the closing price of the financial instrument.
detrendornot: This input determines the method used for detrending the source data. Detrending is the process of removing the underlying trend from the data to focus on the cyclical components.
The available options are:
hpsmthdt: Detrend using Hodrick-Prescott filter centered moving average.
zlagsmthdt: Detrend using zero-lag moving average centered moving average.
logZlagRegression: Detrend using logarithmic zero-lag linear regression.
hpsmth: Detrend using Hodrick-Prescott filter.
zlagsmth: Detrend using zero-lag moving average.
DT_HPper1 and DT_HPper2: These inputs define the period range for the Hodrick-Prescott filter centered moving average when detrendornot is set to hpsmthdt.
DT_ZLper1 and DT_ZLper2: These inputs define the period range for the zero-lag moving average centered moving average when detrendornot is set to zlagsmthdt.
DT_RegZLsmoothPer: This input defines the period for the zero-lag moving average used in logarithmic zero-lag linear regression when detrendornot is set to logZlagRegression.
HPsmoothPer: This input defines the period for the Hodrick-Prescott filter when detrendornot is set to hpsmth.
ZLMAsmoothPer: This input defines the period for the zero-lag moving average when detrendornot is set to zlagsmth.
MaxPer: This input sets the maximum period for the Goertzel algorithm to search for cycles.
squaredAmp: This boolean input determines whether the amplitude should be squared in the Goertzel algorithm.
useAddition: This boolean input determines whether the Goertzel algorithm should use addition for combining the cycles.
useCosine: This boolean input determines whether the Goertzel algorithm should use cosine waves instead of sine waves.
UseCycleStrength: This boolean input determines whether the Goertzel algorithm should compute the cycle strength, which is a normalized measure of the cycle's amplitude.
WindowSizePast: These inputs define the window size for the composite wave.
FilterBartels: This boolean input determines whether Bartel's test should be applied to filter out non-significant cycles.
BartNoCycles: This input sets the number of cycles to be used in Bartel's test.
BartSmoothPer: This input sets the period for the moving average used in Bartel's test.
BartSigLimit: This input sets the significance limit for Bartel's test, below which cycles are considered insignificant.
SortBartels: This boolean input determines whether the cycles should be sorted by their Bartel's test results.
StartAtCycle: This input determines the starting index for selecting the top N cycles when UseCycleList is set to false. This allows you to skip a certain number of cycles from the top before selecting the desired number of cycles.
UseTopCycles: This input sets the number of top cycles to use for constructing the composite wave when UseCycleList is set to false. The cycles are ranked based on their amplitudes or cycle strengths, depending on the UseCycleStrength input.
SubtractNoise: This boolean input determines whether to subtract the noise (remaining cycles) from the composite wave. If set to true, the composite wave will only include the top N cycles specified by UseTopCycles.
█ Exploring Auxiliary Functions
The following functions demonstrate advanced techniques for analyzing financial markets, including zero-lag moving averages, Bartels probability, detrending, and Hodrick-Prescott filtering. This section examines each function in detail, explaining their purpose, methodology, and applications in finance. We will examine how each function contributes to the overall performance and effectiveness of the indicator and how they work together to create a powerful analytical tool.
Zero-Lag Moving Average:
The zero-lag moving average function is designed to minimize the lag typically associated with moving averages. This is achieved through a two-step weighted linear regression process that emphasizes more recent data points. The function calculates a linearly weighted moving average (LWMA) on the input data and then applies another LWMA on the result. By doing this, the function creates a moving average that closely follows the price action, reducing the lag and improving the responsiveness of the indicator.
The zero-lag moving average function is used in the indicator to provide a responsive, low-lag smoothing of the input data. This function helps reduce the noise and fluctuations in the data, making it easier to identify and analyze underlying trends and patterns. By minimizing the lag associated with traditional moving averages, this function allows the indicator to react more quickly to changes in market conditions, providing timely signals and improving the overall effectiveness of the indicator.
Bartels Probability:
The Bartels probability function calculates the probability of a given cycle being significant in a time series. It uses a mathematical test called the Bartels test to assess the significance of cycles detected in the data. The function calculates coefficients for each detected cycle and computes an average amplitude and an expected amplitude. By comparing these values, the Bartels probability is derived, indicating the likelihood of a cycle's significance. This information can help in identifying and analyzing dominant cycles in financial markets.
The Bartels probability function is incorporated into the indicator to assess the significance of detected cycles in the input data. By calculating the Bartels probability for each cycle, the indicator can prioritize the most significant cycles and focus on the market dynamics that are most relevant to the current trading environment. This function enhances the indicator's ability to identify dominant market cycles, improving its predictive power and aiding in the development of effective trading strategies.
Detrend Logarithmic Zero-Lag Regression:
The detrend logarithmic zero-lag regression function is used for detrending data while minimizing lag. It combines a zero-lag moving average with a linear regression detrending method. The function first calculates the zero-lag moving average of the logarithm of input data and then applies a linear regression to remove the trend. By detrending the data, the function isolates the cyclical components, making it easier to analyze and interpret the underlying market dynamics.
The detrend logarithmic zero-lag regression function is used in the indicator to isolate the cyclical components of the input data. By detrending the data, the function enables the indicator to focus on the cyclical movements in the market, making it easier to analyze and interpret market dynamics. This function is essential for identifying cyclical patterns and understanding the interactions between different market cycles, which can inform trading decisions and enhance overall market understanding.
Bartels Cycle Significance Test:
The Bartels cycle significance test is a function that combines the Bartels probability function and the detrend logarithmic zero-lag regression function to assess the significance of detected cycles. The function calculates the Bartels probability for each cycle and stores the results in an array. By analyzing the probability values, traders and analysts can identify the most significant cycles in the data, which can be used to develop trading strategies and improve market understanding.
The Bartels cycle significance test function is integrated into the indicator to provide a comprehensive analysis of the significance of detected cycles. By combining the Bartels probability function and the detrend logarithmic zero-lag regression function, this test evaluates the significance of each cycle and stores the results in an array. The indicator can then use this information to prioritize the most significant cycles and focus on the most relevant market dynamics. This function enhances the indicator's ability to identify and analyze dominant market cycles, providing valuable insights for trading and market analysis.
Hodrick-Prescott Filter:
The Hodrick-Prescott filter is a popular technique used to separate the trend and cyclical components of a time series. The function applies a smoothing parameter to the input data and calculates a smoothed series using a two-sided filter. This smoothed series represents the trend component, which can be subtracted from the original data to obtain the cyclical component. The Hodrick-Prescott filter is commonly used in economics and finance to analyze economic data and financial market trends.
The Hodrick-Prescott filter is incorporated into the indicator to separate the trend and cyclical components of the input data. By applying the filter to the data, the indicator can isolate the trend component, which can be used to analyze long-term market trends and inform trading decisions. Additionally, the cyclical component can be used to identify shorter-term market dynamics and provide insights into potential trading opportunities. The inclusion of the Hodrick-Prescott filter adds another layer of analysis to the indicator, making it more versatile and comprehensive.
Detrending Options: Detrend Centered Moving Average:
The detrend centered moving average function provides different detrending methods, including the Hodrick-Prescott filter and the zero-lag moving average, based on the selected detrending method. The function calculates two sets of smoothed values using the chosen method and subtracts one set from the other to obtain a detrended series. By offering multiple detrending options, this function allows traders and analysts to select the most appropriate method for their specific needs and preferences.
The detrend centered moving average function is integrated into the indicator to provide users with multiple detrending options, including the Hodrick-Prescott filter and the zero-lag moving average. By offering multiple detrending methods, the indicator allows users to customize the analysis to their specific needs and preferences, enhancing the indicator's overall utility and adaptability. This function ensures that the indicator can cater to a wide range of trading styles and objectives, making it a valuable tool for a diverse group of market participants.
The auxiliary functions functions discussed in this section demonstrate the power and versatility of mathematical techniques in analyzing financial markets. By understanding and implementing these functions, traders and analysts can gain valuable insights into market dynamics, improve their trading strategies, and make more informed decisions. The combination of zero-lag moving averages, Bartels probability, detrending methods, and the Hodrick-Prescott filter provides a comprehensive toolkit for analyzing and interpreting financial data. The integration of advanced functions in a financial indicator creates a powerful and versatile analytical tool that can provide valuable insights into financial markets. By combining the zero-lag moving average,
█ In-Depth Analysis of the Goertzel Cycle Composite Wave Code
The Goertzel Cycle Composite Wave code is an implementation of the Goertzel Algorithm, an efficient technique to perform spectral analysis on a signal. The code is designed to detect and analyze dominant cycles within a given financial market data set. This section will provide an extremely detailed explanation of the code, its structure, functions, and intended purpose.
Function signature and input parameters:
The Goertzel Cycle Composite Wave function accepts numerous input parameters for customization, including source data (src), the current bar (forBar), sample size (samplesize), period (per), squared amplitude flag (squaredAmp), addition flag (useAddition), cosine flag (useCosine), cycle strength flag (UseCycleStrength), past sizes (WindowSizePast), Bartels filter flag (FilterBartels), Bartels-related parameters (BartNoCycles, BartSmoothPer, BartSigLimit), sorting flag (SortBartels), and output buffers (goeWorkPast, cyclebuffer, amplitudebuffer, phasebuffer, cycleBartelsBuffer).
Initializing variables and arrays:
The code initializes several float arrays (goeWork1, goeWork2, goeWork3, goeWork4) with the same length as twice the period (2 * per). These arrays store intermediate results during the execution of the algorithm.
Preprocessing input data:
The input data (src) undergoes preprocessing to remove linear trends. This step enhances the algorithm's ability to focus on cyclical components in the data. The linear trend is calculated by finding the slope between the first and last values of the input data within the sample.
Iterative calculation of Goertzel coefficients:
The core of the Goertzel Cycle Composite Wave algorithm lies in the iterative calculation of Goertzel coefficients for each frequency bin. These coefficients represent the spectral content of the input data at different frequencies. The code iterates through the range of frequencies, calculating the Goertzel coefficients using a nested loop structure.
Cycle strength computation:
The code calculates the cycle strength based on the Goertzel coefficients. This is an optional step, controlled by the UseCycleStrength flag. The cycle strength provides information on the relative influence of each cycle on the data per bar, considering both amplitude and cycle length. The algorithm computes the cycle strength either by squaring the amplitude (controlled by squaredAmp flag) or using the actual amplitude values.
Phase calculation:
The Goertzel Cycle Composite Wave code computes the phase of each cycle, which represents the position of the cycle within the input data. The phase is calculated using the arctangent function (math.atan) based on the ratio of the imaginary and real components of the Goertzel coefficients.
Peak detection and cycle extraction:
The algorithm performs peak detection on the computed amplitudes or cycle strengths to identify dominant cycles. It stores the detected cycles in the cyclebuffer array, along with their corresponding amplitudes and phases in the amplitudebuffer and phasebuffer arrays, respectively.
Sorting cycles by amplitude or cycle strength:
The code sorts the detected cycles based on their amplitude or cycle strength in descending order. This allows the algorithm to prioritize cycles with the most significant impact on the input data.
Bartels cycle significance test:
If the FilterBartels flag is set, the code performs a Bartels cycle significance test on the detected cycles. This test determines the statistical significance of each cycle and filters out the insignificant cycles. The significant cycles are stored in the cycleBartelsBuffer array. If the SortBartels flag is set, the code sorts the significant cycles based on their Bartels significance values.
Waveform calculation:
The Goertzel Cycle Composite Wave code calculates the waveform of the significant cycles for specified time windows. The windows are defined by the WindowSizePast parameters, respectively. The algorithm uses either cosine or sine functions (controlled by the useCosine flag) to calculate the waveforms for each cycle. The useAddition flag determines whether the waveforms should be added or subtracted.
Storing waveforms in a matrix:
The calculated waveforms for the cycle is stored in the matrix - goeWorkPast. This matrix holds the waveforms for the specified time windows. Each row in the matrix represents a time window position, and each column corresponds to a cycle.
Returning the number of cycles:
The Goertzel Cycle Composite Wave function returns the total number of detected cycles (number_of_cycles) after processing the input data. This information can be used to further analyze the results or to visualize the detected cycles.
The Goertzel Cycle Composite Wave code is a comprehensive implementation of the Goertzel Algorithm, specifically designed for detecting and analyzing dominant cycles within financial market data. The code offers a high level of customization, allowing users to fine-tune the algorithm based on their specific needs. The Goertzel Cycle Composite Wave's combination of preprocessing, iterative calculations, cycle extraction, sorting, significance testing, and waveform calculation makes it a powerful tool for understanding cyclical components in financial data.
█ Generating and Visualizing Composite Waveform
The indicator calculates and visualizes the composite waveform for specified time windows based on the detected cycles. Here's a detailed explanation of this process:
Updating WindowSizePast:
The WindowSizePast is updated to ensure they are at least twice the MaxPer (maximum period).
Initializing matrices and arrays:
The matrix goeWorkPast is initialized to store the Goertzel results for specified time windows. Multiple arrays are also initialized to store cycle, amplitude, phase, and Bartels information.
Preparing the source data (srcVal) array:
The source data is copied into an array, srcVal, and detrended using one of the selected methods (hpsmthdt, zlagsmthdt, logZlagRegression, hpsmth, or zlagsmth).
Goertzel function call:
The Goertzel function is called to analyze the detrended source data and extract cycle information. The output, number_of_cycles, contains the number of detected cycles.
Initializing arrays for waveforms:
The goertzel array is initialized to store the endpoint Goertzel.
Calculating composite waveform (goertzel array):
The composite waveform is calculated by summing the selected cycles (either from the user-defined cycle list or the top cycles) and optionally subtracting the noise component.
Drawing composite waveform (pvlines):
The composite waveform is drawn on the chart using solid lines. The color of the lines is determined by the direction of the waveform (green for upward, red for downward).
To summarize, this indicator generates a composite waveform based on the detected cycles in the financial data. It calculates the composite waveforms and visualizes them on the chart using colored lines.
█ Enhancing the Goertzel Algorithm-Based Script for Financial Modeling and Trading
The Goertzel algorithm-based script for detecting dominant cycles in financial data is a powerful tool for financial modeling and trading. It provides valuable insights into the past behavior of these cycles. However, as with any algorithm, there is always room for improvement. This section discusses potential enhancements to the existing script to make it even more robust and versatile for financial modeling, general trading, advanced trading, and high-frequency finance trading.
Enhancements for Financial Modeling
Data preprocessing: One way to improve the script's performance for financial modeling is to introduce more advanced data preprocessing techniques. This could include removing outliers, handling missing data, and normalizing the data to ensure consistent and accurate results.
Additional detrending and smoothing methods: Incorporating more sophisticated detrending and smoothing techniques, such as wavelet transform or empirical mode decomposition, can help improve the script's ability to accurately identify cycles and trends in the data.
Machine learning integration: Integrating machine learning techniques, such as artificial neural networks or support vector machines, can help enhance the script's predictive capabilities, leading to more accurate financial models.
Enhancements for General and Advanced Trading
Customizable indicator integration: Allowing users to integrate their own technical indicators can help improve the script's effectiveness for both general and advanced trading. By enabling the combination of the dominant cycle information with other technical analysis tools, traders can develop more comprehensive trading strategies.
Risk management and position sizing: Incorporating risk management and position sizing functionality into the script can help traders better manage their trades and control potential losses. This can be achieved by calculating the optimal position size based on the user's risk tolerance and account size.
Multi-timeframe analysis: Enhancing the script to perform multi-timeframe analysis can provide traders with a more holistic view of market trends and cycles. By identifying dominant cycles on different timeframes, traders can gain insights into the potential confluence of cycles and make better-informed trading decisions.
Enhancements for High-Frequency Finance Trading
Algorithm optimization: To ensure the script's suitability for high-frequency finance trading, optimizing the algorithm for faster execution is crucial. This can be achieved by employing efficient data structures and refining the calculation methods to minimize computational complexity.
Real-time data streaming: Integrating real-time data streaming capabilities into the script can help high-frequency traders react to market changes more quickly. By continuously updating the cycle information based on real-time market data, traders can adapt their strategies accordingly and capitalize on short-term market fluctuations.
Order execution and trade management: To fully leverage the script's capabilities for high-frequency trading, implementing functionality for automated order execution and trade management is essential. This can include features such as stop-loss and take-profit orders, trailing stops, and automated trade exit strategies.
While the existing Goertzel algorithm-based script is a valuable tool for detecting dominant cycles in financial data, there are several potential enhancements that can make it even more powerful for financial modeling, general trading, advanced trading, and high-frequency finance trading. By incorporating these improvements, the script can become a more versatile and effective tool for traders and financial analysts alike.
█ Understanding the Limitations of the Goertzel Algorithm
While the Goertzel algorithm-based script for detecting dominant cycles in financial data provides valuable insights, it is important to be aware of its limitations and drawbacks. Some of the key drawbacks of this indicator are:
Lagging nature:
As with many other technical indicators, the Goertzel algorithm-based script can suffer from lagging effects, meaning that it may not immediately react to real-time market changes. This lag can lead to late entries and exits, potentially resulting in reduced profitability or increased losses.
Parameter sensitivity:
The performance of the script can be sensitive to the chosen parameters, such as the detrending methods, smoothing techniques, and cycle detection settings. Improper parameter selection may lead to inaccurate cycle detection or increased false signals, which can negatively impact trading performance.
Complexity:
The Goertzel algorithm itself is relatively complex, making it difficult for novice traders or those unfamiliar with the concept of cycle analysis to fully understand and effectively utilize the script. This complexity can also make it challenging to optimize the script for specific trading styles or market conditions.
Overfitting risk:
As with any data-driven approach, there is a risk of overfitting when using the Goertzel algorithm-based script. Overfitting occurs when a model becomes too specific to the historical data it was trained on, leading to poor performance on new, unseen data. This can result in misleading signals and reduced trading performance.
Limited applicability:
The Goertzel algorithm-based script may not be suitable for all markets, trading styles, or timeframes. Its effectiveness in detecting cycles may be limited in certain market conditions, such as during periods of extreme volatility or low liquidity.
While the Goertzel algorithm-based script offers valuable insights into dominant cycles in financial data, it is essential to consider its drawbacks and limitations when incorporating it into a trading strategy. Traders should always use the script in conjunction with other technical and fundamental analysis tools, as well as proper risk management, to make well-informed trading decisions.
█ Interpreting Results
The Goertzel Cycle Composite Wave indicator can be interpreted by analyzing the plotted lines. The indicator plots two lines: composite waves. The composite wave represents the composite wave of the price data.
The composite wave line displays a solid line, with green indicating a bullish trend and red indicating a bearish trend.
Interpreting the Goertzel Cycle Composite Wave indicator involves identifying the trend of the composite wave lines and matching them with the corresponding bullish or bearish color.
█ Conclusion
The Goertzel Cycle Composite Wave indicator is a powerful tool for identifying and analyzing cyclical patterns in financial markets. Its ability to detect multiple cycles of varying frequencies and strengths make it a valuable addition to any trader's technical analysis toolkit. However, it is important to keep in mind that the Goertzel Cycle Composite Wave indicator should be used in conjunction with other technical analysis tools and fundamental analysis to achieve the best results. With continued refinement and development, the Goertzel Cycle Composite Wave indicator has the potential to become a highly effective tool for financial modeling, general trading, advanced trading, and high-frequency finance trading. Its accuracy and versatility make it a promising candidate for further research and development.
█ Footnotes
What is the Bartels Test for Cycle Significance?
The Bartels Cycle Significance Test is a statistical method that determines whether the peaks and troughs of a time series are statistically significant. The test is named after its inventor, George Bartels, who developed it in the mid-20th century.
The Bartels test is designed to analyze the cyclical components of a time series, which can help traders and analysts identify trends and cycles in financial markets. The test calculates a Bartels statistic, which measures the degree of non-randomness or autocorrelation in the time series.
The Bartels statistic is calculated by first splitting the time series into two halves and calculating the range of the peaks and troughs in each half. The test then compares these ranges using a t-test, which measures the significance of the difference between the two ranges.
If the Bartels statistic is greater than a critical value, it indicates that the peaks and troughs in the time series are non-random and that there is a significant cyclical component to the data. Conversely, if the Bartels statistic is less than the critical value, it suggests that the peaks and troughs are random and that there is no significant cyclical component.
The Bartels Cycle Significance Test is particularly useful in financial analysis because it can help traders and analysts identify significant cycles in asset prices, which can in turn inform investment decisions. However, it is important to note that the test is not perfect and can produce false signals in certain situations, particularly in noisy or volatile markets. Therefore, it is always recommended to use the test in conjunction with other technical and fundamental indicators to confirm trends and cycles.
Deep-dive into the Hodrick-Prescott Fitler
The Hodrick-Prescott (HP) filter is a statistical tool used in economics and finance to separate a time series into two components: a trend component and a cyclical component. It is a powerful tool for identifying long-term trends in economic and financial data and is widely used by economists, central banks, and financial institutions around the world.
The HP filter was first introduced in the 1990s by economists Robert Hodrick and Edward Prescott. It is a simple, two-parameter filter that separates a time series into a trend component and a cyclical component. The trend component represents the long-term behavior of the data, while the cyclical component captures the shorter-term fluctuations around the trend.
The HP filter works by minimizing the following objective function:
Minimize: (Sum of Squared Deviations) + λ (Sum of Squared Second Differences)
Where:
1. The first term represents the deviation of the data from the trend.
2. The second term represents the smoothness of the trend.
3. λ is a smoothing parameter that determines the degree of smoothness of the trend.
The smoothing parameter λ is typically set to a value between 100 and 1600, depending on the frequency of the data. Higher values of λ lead to a smoother trend, while lower values lead to a more volatile trend.
The HP filter has several advantages over other smoothing techniques. It is a non-parametric method, meaning that it does not make any assumptions about the underlying distribution of the data. It also allows for easy comparison of trends across different time series and can be used with data of any frequency.
However, the HP filter also has some limitations. It assumes that the trend is a smooth function, which may not be the case in some situations. It can also be sensitive to changes in the smoothing parameter λ, which may result in different trends for the same data. Additionally, the filter may produce unrealistic trends for very short time series.
Despite these limitations, the HP filter remains a valuable tool for analyzing economic and financial data. It is widely used by central banks and financial institutions to monitor long-term trends in the economy, and it can be used to identify turning points in the business cycle. The filter can also be used to analyze asset prices, exchange rates, and other financial variables.
The Hodrick-Prescott filter is a powerful tool for analyzing economic and financial data. It separates a time series into a trend component and a cyclical component, allowing for easy identification of long-term trends and turning points in the business cycle. While it has some limitations, it remains a valuable tool for economists, central banks, and financial institutions around the world.

Goertzel Browser [Loxx]As the financial markets become increasingly complex and data-driven, traders and analysts must leverage powerful tools to gain insights and make informed decisions. One such tool is the Goertzel Browser indicator, a sophisticated technical analysis indicator that helps identify cyclical patterns in financial data. This powerful tool is capable of detecting cyclical patterns in financial data, helping traders to make better predictions and optimize their trading strategies. With its unique combination of mathematical algorithms and advanced charting capabilities, this indicator has the potential to revolutionize the way we approach financial modeling and trading.
█ Brief Overview of the Goertzel Browser
The Goertzel Browser is a sophisticated technical analysis tool that utilizes the Goertzel algorithm to analyze and visualize cyclical components within a financial time series. By identifying these cycles and their characteristics, the indicator aims to provide valuable insights into the market's underlying price movements, which could potentially be used for making informed trading decisions.
The primary purpose of this indicator is to:
1. Detect and analyze the dominant cycles present in the price data.
2. Reconstruct and visualize the composite wave based on the detected cycles.
3. Project the composite wave into the future, providing a potential roadmap for upcoming price movements.
To achieve this, the indicator performs several tasks:
1. Detrending the price data: The indicator preprocesses the price data using various detrending techniques, such as Hodrick-Prescott filters, zero-lag moving averages, and linear regression, to remove the underlying trend and focus on the cyclical components.
2. Applying the Goertzel algorithm: The indicator applies the Goertzel algorithm to the detrended price data, identifying the dominant cycles and their characteristics, such as amplitude, phase, and cycle strength.
3. Constructing the composite wave: The indicator reconstructs the composite wave by combining the detected cycles, either by using a user-defined list of cycles or by selecting the top N cycles based on their amplitude or cycle strength.
4. Visualizing the composite wave: The indicator plots the composite wave, using solid lines for the past and dotted lines for the future projections. The color of the lines indicates whether the wave is increasing or decreasing.
5. Displaying cycle information: The indicator provides a table that displays detailed information about the detected cycles, including their rank, period, Bartel's test results, amplitude, and phase.
This indicator is a powerful tool that employs the Goertzel algorithm to analyze and visualize the cyclical components within a financial time series. By providing insights into the underlying price movements and their potential future trajectory, the indicator aims to assist traders in making more informed decisions.
█ What is the Goertzel Algorithm?
The Goertzel algorithm, named after Gerald Goertzel, is a digital signal processing technique that is used to efficiently compute individual terms of the Discrete Fourier Transform (DFT). It was first introduced in 1958, and since then, it has found various applications in the fields of engineering, mathematics, and physics.
The Goertzel algorithm is primarily used to detect specific frequency components within a digital signal, making it particularly useful in applications where only a few frequency components are of interest. The algorithm is computationally efficient, as it requires fewer calculations than the Fast Fourier Transform (FFT) when detecting a small number of frequency components. This efficiency makes the Goertzel algorithm a popular choice in applications such as:
1. Telecommunications: The Goertzel algorithm is used for decoding Dual-Tone Multi-Frequency (DTMF) signals, which are the tones generated when pressing buttons on a telephone keypad. By identifying specific frequency components, the algorithm can accurately determine which button has been pressed.
2. Audio processing: The algorithm can be used to detect specific pitches or harmonics in an audio signal, making it useful in applications like pitch detection and tuning musical instruments.
3. Vibration analysis: In the field of mechanical engineering, the Goertzel algorithm can be applied to analyze vibrations in rotating machinery, helping to identify faulty components or signs of wear.
4. Power system analysis: The algorithm can be used to measure harmonic content in power systems, allowing engineers to assess power quality and detect potential issues.
The Goertzel algorithm is used in these applications because it offers several advantages over other methods, such as the FFT:
1. Computational efficiency: The Goertzel algorithm requires fewer calculations when detecting a small number of frequency components, making it more computationally efficient than the FFT in these cases.
2. Real-time analysis: The algorithm can be implemented in a streaming fashion, allowing for real-time analysis of signals, which is crucial in applications like telecommunications and audio processing.
3. Memory efficiency: The Goertzel algorithm requires less memory than the FFT, as it only computes the frequency components of interest.
4. Precision: The algorithm is less susceptible to numerical errors compared to the FFT, ensuring more accurate results in applications where precision is essential.
The Goertzel algorithm is an efficient digital signal processing technique that is primarily used to detect specific frequency components within a signal. Its computational efficiency, real-time capabilities, and precision make it an attractive choice for various applications, including telecommunications, audio processing, vibration analysis, and power system analysis. The algorithm has been widely adopted since its introduction in 1958 and continues to be an essential tool in the fields of engineering, mathematics, and physics.
█ Goertzel Algorithm in Quantitative Finance: In-Depth Analysis and Applications
The Goertzel algorithm, initially designed for signal processing in telecommunications, has gained significant traction in the financial industry due to its efficient frequency detection capabilities. In quantitative finance, the Goertzel algorithm has been utilized for uncovering hidden market cycles, developing data-driven trading strategies, and optimizing risk management. This section delves deeper into the applications of the Goertzel algorithm in finance, particularly within the context of quantitative trading and analysis.
Unveiling Hidden Market Cycles:
Market cycles are prevalent in financial markets and arise from various factors, such as economic conditions, investor psychology, and market participant behavior. The Goertzel algorithm's ability to detect and isolate specific frequencies in price data helps trader analysts identify hidden market cycles that may otherwise go unnoticed. By examining the amplitude, phase, and periodicity of each cycle, traders can better understand the underlying market structure and dynamics, enabling them to develop more informed and effective trading strategies.
Developing Quantitative Trading Strategies:
The Goertzel algorithm's versatility allows traders to incorporate its insights into a wide range of trading strategies. By identifying the dominant market cycles in a financial instrument's price data, traders can create data-driven strategies that capitalize on the cyclical nature of markets.
For instance, a trader may develop a mean-reversion strategy that takes advantage of the identified cycles. By establishing positions when the price deviates from the predicted cycle, the trader can profit from the subsequent reversion to the cycle's mean. Similarly, a momentum-based strategy could be designed to exploit the persistence of a dominant cycle by entering positions that align with the cycle's direction.
Enhancing Risk Management:
The Goertzel algorithm plays a vital role in risk management for quantitative strategies. By analyzing the cyclical components of a financial instrument's price data, traders can gain insights into the potential risks associated with their trading strategies.
By monitoring the amplitude and phase of dominant cycles, a trader can detect changes in market dynamics that may pose risks to their positions. For example, a sudden increase in amplitude may indicate heightened volatility, prompting the trader to adjust position sizing or employ hedging techniques to protect their portfolio. Additionally, changes in phase alignment could signal a potential shift in market sentiment, necessitating adjustments to the trading strategy.
Expanding Quantitative Toolkits:
Traders can augment the Goertzel algorithm's insights by combining it with other quantitative techniques, creating a more comprehensive and sophisticated analysis framework. For example, machine learning algorithms, such as neural networks or support vector machines, could be trained on features extracted from the Goertzel algorithm to predict future price movements more accurately.
Furthermore, the Goertzel algorithm can be integrated with other technical analysis tools, such as moving averages or oscillators, to enhance their effectiveness. By applying these tools to the identified cycles, traders can generate more robust and reliable trading signals.
The Goertzel algorithm offers invaluable benefits to quantitative finance practitioners by uncovering hidden market cycles, aiding in the development of data-driven trading strategies, and improving risk management. By leveraging the insights provided by the Goertzel algorithm and integrating it with other quantitative techniques, traders can gain a deeper understanding of market dynamics and devise more effective trading strategies.
█ Indicator Inputs
src: This is the source data for the analysis, typically the closing price of the financial instrument.
detrendornot: This input determines the method used for detrending the source data. Detrending is the process of removing the underlying trend from the data to focus on the cyclical components.
The available options are:
hpsmthdt: Detrend using Hodrick-Prescott filter centered moving average.
zlagsmthdt: Detrend using zero-lag moving average centered moving average.
logZlagRegression: Detrend using logarithmic zero-lag linear regression.
hpsmth: Detrend using Hodrick-Prescott filter.
zlagsmth: Detrend using zero-lag moving average.
DT_HPper1 and DT_HPper2: These inputs define the period range for the Hodrick-Prescott filter centered moving average when detrendornot is set to hpsmthdt.
DT_ZLper1 and DT_ZLper2: These inputs define the period range for the zero-lag moving average centered moving average when detrendornot is set to zlagsmthdt.
DT_RegZLsmoothPer: This input defines the period for the zero-lag moving average used in logarithmic zero-lag linear regression when detrendornot is set to logZlagRegression.
HPsmoothPer: This input defines the period for the Hodrick-Prescott filter when detrendornot is set to hpsmth.
ZLMAsmoothPer: This input defines the period for the zero-lag moving average when detrendornot is set to zlagsmth.
MaxPer: This input sets the maximum period for the Goertzel algorithm to search for cycles.
squaredAmp: This boolean input determines whether the amplitude should be squared in the Goertzel algorithm.
useAddition: This boolean input determines whether the Goertzel algorithm should use addition for combining the cycles.
useCosine: This boolean input determines whether the Goertzel algorithm should use cosine waves instead of sine waves.
UseCycleStrength: This boolean input determines whether the Goertzel algorithm should compute the cycle strength, which is a normalized measure of the cycle's amplitude.
WindowSizePast and WindowSizeFuture: These inputs define the window size for past and future projections of the composite wave.
FilterBartels: This boolean input determines whether Bartel's test should be applied to filter out non-significant cycles.
BartNoCycles: This input sets the number of cycles to be used in Bartel's test.
BartSmoothPer: This input sets the period for the moving average used in Bartel's test.
BartSigLimit: This input sets the significance limit for Bartel's test, below which cycles are considered insignificant.
SortBartels: This boolean input determines whether the cycles should be sorted by their Bartel's test results.
UseCycleList: This boolean input determines whether a user-defined list of cycles should be used for constructing the composite wave. If set to false, the top N cycles will be used.
Cycle1, Cycle2, Cycle3, Cycle4, and Cycle5: These inputs define the user-defined list of cycles when 'UseCycleList' is set to true. If using a user-defined list, each of these inputs represents the period of a specific cycle to include in the composite wave.
StartAtCycle: This input determines the starting index for selecting the top N cycles when UseCycleList is set to false. This allows you to skip a certain number of cycles from the top before selecting the desired number of cycles.
UseTopCycles: This input sets the number of top cycles to use for constructing the composite wave when UseCycleList is set to false. The cycles are ranked based on their amplitudes or cycle strengths, depending on the UseCycleStrength input.
SubtractNoise: This boolean input determines whether to subtract the noise (remaining cycles) from the composite wave. If set to true, the composite wave will only include the top N cycles specified by UseTopCycles.
█ Exploring Auxiliary Functions
The following functions demonstrate advanced techniques for analyzing financial markets, including zero-lag moving averages, Bartels probability, detrending, and Hodrick-Prescott filtering. This section examines each function in detail, explaining their purpose, methodology, and applications in finance. We will examine how each function contributes to the overall performance and effectiveness of the indicator and how they work together to create a powerful analytical tool.
Zero-Lag Moving Average:
The zero-lag moving average function is designed to minimize the lag typically associated with moving averages. This is achieved through a two-step weighted linear regression process that emphasizes more recent data points. The function calculates a linearly weighted moving average (LWMA) on the input data and then applies another LWMA on the result. By doing this, the function creates a moving average that closely follows the price action, reducing the lag and improving the responsiveness of the indicator.
The zero-lag moving average function is used in the indicator to provide a responsive, low-lag smoothing of the input data. This function helps reduce the noise and fluctuations in the data, making it easier to identify and analyze underlying trends and patterns. By minimizing the lag associated with traditional moving averages, this function allows the indicator to react more quickly to changes in market conditions, providing timely signals and improving the overall effectiveness of the indicator.
Bartels Probability:
The Bartels probability function calculates the probability of a given cycle being significant in a time series. It uses a mathematical test called the Bartels test to assess the significance of cycles detected in the data. The function calculates coefficients for each detected cycle and computes an average amplitude and an expected amplitude. By comparing these values, the Bartels probability is derived, indicating the likelihood of a cycle's significance. This information can help in identifying and analyzing dominant cycles in financial markets.
The Bartels probability function is incorporated into the indicator to assess the significance of detected cycles in the input data. By calculating the Bartels probability for each cycle, the indicator can prioritize the most significant cycles and focus on the market dynamics that are most relevant to the current trading environment. This function enhances the indicator's ability to identify dominant market cycles, improving its predictive power and aiding in the development of effective trading strategies.
Detrend Logarithmic Zero-Lag Regression:
The detrend logarithmic zero-lag regression function is used for detrending data while minimizing lag. It combines a zero-lag moving average with a linear regression detrending method. The function first calculates the zero-lag moving average of the logarithm of input data and then applies a linear regression to remove the trend. By detrending the data, the function isolates the cyclical components, making it easier to analyze and interpret the underlying market dynamics.
The detrend logarithmic zero-lag regression function is used in the indicator to isolate the cyclical components of the input data. By detrending the data, the function enables the indicator to focus on the cyclical movements in the market, making it easier to analyze and interpret market dynamics. This function is essential for identifying cyclical patterns and understanding the interactions between different market cycles, which can inform trading decisions and enhance overall market understanding.
Bartels Cycle Significance Test:
The Bartels cycle significance test is a function that combines the Bartels probability function and the detrend logarithmic zero-lag regression function to assess the significance of detected cycles. The function calculates the Bartels probability for each cycle and stores the results in an array. By analyzing the probability values, traders and analysts can identify the most significant cycles in the data, which can be used to develop trading strategies and improve market understanding.
The Bartels cycle significance test function is integrated into the indicator to provide a comprehensive analysis of the significance of detected cycles. By combining the Bartels probability function and the detrend logarithmic zero-lag regression function, this test evaluates the significance of each cycle and stores the results in an array. The indicator can then use this information to prioritize the most significant cycles and focus on the most relevant market dynamics. This function enhances the indicator's ability to identify and analyze dominant market cycles, providing valuable insights for trading and market analysis.
Hodrick-Prescott Filter:
The Hodrick-Prescott filter is a popular technique used to separate the trend and cyclical components of a time series. The function applies a smoothing parameter to the input data and calculates a smoothed series using a two-sided filter. This smoothed series represents the trend component, which can be subtracted from the original data to obtain the cyclical component. The Hodrick-Prescott filter is commonly used in economics and finance to analyze economic data and financial market trends.
The Hodrick-Prescott filter is incorporated into the indicator to separate the trend and cyclical components of the input data. By applying the filter to the data, the indicator can isolate the trend component, which can be used to analyze long-term market trends and inform trading decisions. Additionally, the cyclical component can be used to identify shorter-term market dynamics and provide insights into potential trading opportunities. The inclusion of the Hodrick-Prescott filter adds another layer of analysis to the indicator, making it more versatile and comprehensive.
Detrending Options: Detrend Centered Moving Average:
The detrend centered moving average function provides different detrending methods, including the Hodrick-Prescott filter and the zero-lag moving average, based on the selected detrending method. The function calculates two sets of smoothed values using the chosen method and subtracts one set from the other to obtain a detrended series. By offering multiple detrending options, this function allows traders and analysts to select the most appropriate method for their specific needs and preferences.
The detrend centered moving average function is integrated into the indicator to provide users with multiple detrending options, including the Hodrick-Prescott filter and the zero-lag moving average. By offering multiple detrending methods, the indicator allows users to customize the analysis to their specific needs and preferences, enhancing the indicator's overall utility and adaptability. This function ensures that the indicator can cater to a wide range of trading styles and objectives, making it a valuable tool for a diverse group of market participants.
The auxiliary functions functions discussed in this section demonstrate the power and versatility of mathematical techniques in analyzing financial markets. By understanding and implementing these functions, traders and analysts can gain valuable insights into market dynamics, improve their trading strategies, and make more informed decisions. The combination of zero-lag moving averages, Bartels probability, detrending methods, and the Hodrick-Prescott filter provides a comprehensive toolkit for analyzing and interpreting financial data. The integration of advanced functions in a financial indicator creates a powerful and versatile analytical tool that can provide valuable insights into financial markets. By combining the zero-lag moving average,
█ In-Depth Analysis of the Goertzel Browser Code
The Goertzel Browser code is an implementation of the Goertzel Algorithm, an efficient technique to perform spectral analysis on a signal. The code is designed to detect and analyze dominant cycles within a given financial market data set. This section will provide an extremely detailed explanation of the code, its structure, functions, and intended purpose.
Function signature and input parameters:
The Goertzel Browser function accepts numerous input parameters for customization, including source data (src), the current bar (forBar), sample size (samplesize), period (per), squared amplitude flag (squaredAmp), addition flag (useAddition), cosine flag (useCosine), cycle strength flag (UseCycleStrength), past and future window sizes (WindowSizePast, WindowSizeFuture), Bartels filter flag (FilterBartels), Bartels-related parameters (BartNoCycles, BartSmoothPer, BartSigLimit), sorting flag (SortBartels), and output buffers (goeWorkPast, goeWorkFuture, cyclebuffer, amplitudebuffer, phasebuffer, cycleBartelsBuffer).
Initializing variables and arrays:
The code initializes several float arrays (goeWork1, goeWork2, goeWork3, goeWork4) with the same length as twice the period (2 * per). These arrays store intermediate results during the execution of the algorithm.
Preprocessing input data:
The input data (src) undergoes preprocessing to remove linear trends. This step enhances the algorithm's ability to focus on cyclical components in the data. The linear trend is calculated by finding the slope between the first and last values of the input data within the sample.
Iterative calculation of Goertzel coefficients:
The core of the Goertzel Browser algorithm lies in the iterative calculation of Goertzel coefficients for each frequency bin. These coefficients represent the spectral content of the input data at different frequencies. The code iterates through the range of frequencies, calculating the Goertzel coefficients using a nested loop structure.
Cycle strength computation:
The code calculates the cycle strength based on the Goertzel coefficients. This is an optional step, controlled by the UseCycleStrength flag. The cycle strength provides information on the relative influence of each cycle on the data per bar, considering both amplitude and cycle length. The algorithm computes the cycle strength either by squaring the amplitude (controlled by squaredAmp flag) or using the actual amplitude values.
Phase calculation:
The Goertzel Browser code computes the phase of each cycle, which represents the position of the cycle within the input data. The phase is calculated using the arctangent function (math.atan) based on the ratio of the imaginary and real components of the Goertzel coefficients.
Peak detection and cycle extraction:
The algorithm performs peak detection on the computed amplitudes or cycle strengths to identify dominant cycles. It stores the detected cycles in the cyclebuffer array, along with their corresponding amplitudes and phases in the amplitudebuffer and phasebuffer arrays, respectively.
Sorting cycles by amplitude or cycle strength:
The code sorts the detected cycles based on their amplitude or cycle strength in descending order. This allows the algorithm to prioritize cycles with the most significant impact on the input data.
Bartels cycle significance test:
If the FilterBartels flag is set, the code performs a Bartels cycle significance test on the detected cycles. This test determines the statistical significance of each cycle and filters out the insignificant cycles. The significant cycles are stored in the cycleBartelsBuffer array. If the SortBartels flag is set, the code sorts the significant cycles based on their Bartels significance values.
Waveform calculation:
The Goertzel Browser code calculates the waveform of the significant cycles for both past and future time windows. The past and future windows are defined by the WindowSizePast and WindowSizeFuture parameters, respectively. The algorithm uses either cosine or sine functions (controlled by the useCosine flag) to calculate the waveforms for each cycle. The useAddition flag determines whether the waveforms should be added or subtracted.
Storing waveforms in matrices:
The calculated waveforms for each cycle are stored in two matrices - goeWorkPast and goeWorkFuture. These matrices hold the waveforms for the past and future time windows, respectively. Each row in the matrices represents a time window position, and each column corresponds to a cycle.
Returning the number of cycles:
The Goertzel Browser function returns the total number of detected cycles (number_of_cycles) after processing the input data. This information can be used to further analyze the results or to visualize the detected cycles.
The Goertzel Browser code is a comprehensive implementation of the Goertzel Algorithm, specifically designed for detecting and analyzing dominant cycles within financial market data. The code offers a high level of customization, allowing users to fine-tune the algorithm based on their specific needs. The Goertzel Browser's combination of preprocessing, iterative calculations, cycle extraction, sorting, significance testing, and waveform calculation makes it a powerful tool for understanding cyclical components in financial data.
█ Generating and Visualizing Composite Waveform
The indicator calculates and visualizes the composite waveform for both past and future time windows based on the detected cycles. Here's a detailed explanation of this process:
Updating WindowSizePast and WindowSizeFuture:
The WindowSizePast and WindowSizeFuture are updated to ensure they are at least twice the MaxPer (maximum period).
Initializing matrices and arrays:
Two matrices, goeWorkPast and goeWorkFuture, are initialized to store the Goertzel results for past and future time windows. Multiple arrays are also initialized to store cycle, amplitude, phase, and Bartels information.
Preparing the source data (srcVal) array:
The source data is copied into an array, srcVal, and detrended using one of the selected methods (hpsmthdt, zlagsmthdt, logZlagRegression, hpsmth, or zlagsmth).
Goertzel function call:
The Goertzel function is called to analyze the detrended source data and extract cycle information. The output, number_of_cycles, contains the number of detected cycles.
Initializing arrays for past and future waveforms:
Three arrays, epgoertzel, goertzel, and goertzelFuture, are initialized to store the endpoint Goertzel, non-endpoint Goertzel, and future Goertzel projections, respectively.
Calculating composite waveform for past bars (goertzel array):
The past composite waveform is calculated by summing the selected cycles (either from the user-defined cycle list or the top cycles) and optionally subtracting the noise component.
Calculating composite waveform for future bars (goertzelFuture array):
The future composite waveform is calculated in a similar way as the past composite waveform.
Drawing past composite waveform (pvlines):
The past composite waveform is drawn on the chart using solid lines. The color of the lines is determined by the direction of the waveform (green for upward, red for downward).
Drawing future composite waveform (fvlines):
The future composite waveform is drawn on the chart using dotted lines. The color of the lines is determined by the direction of the waveform (fuchsia for upward, yellow for downward).
Displaying cycle information in a table (table3):
A table is created to display the cycle information, including the rank, period, Bartel value, amplitude (or cycle strength), and phase of each detected cycle.
Filling the table with cycle information:
The indicator iterates through the detected cycles and retrieves the relevant information (period, amplitude, phase, and Bartel value) from the corresponding arrays. It then fills the table with this information, displaying the values up to six decimal places.
To summarize, this indicator generates a composite waveform based on the detected cycles in the financial data. It calculates the composite waveforms for both past and future time windows and visualizes them on the chart using colored lines. Additionally, it displays detailed cycle information in a table, including the rank, period, Bartel value, amplitude (or cycle strength), and phase of each detected cycle.
█ Enhancing the Goertzel Algorithm-Based Script for Financial Modeling and Trading
The Goertzel algorithm-based script for detecting dominant cycles in financial data is a powerful tool for financial modeling and trading. It provides valuable insights into the past behavior of these cycles and potential future impact. However, as with any algorithm, there is always room for improvement. This section discusses potential enhancements to the existing script to make it even more robust and versatile for financial modeling, general trading, advanced trading, and high-frequency finance trading.
Enhancements for Financial Modeling
Data preprocessing: One way to improve the script's performance for financial modeling is to introduce more advanced data preprocessing techniques. This could include removing outliers, handling missing data, and normalizing the data to ensure consistent and accurate results.
Additional detrending and smoothing methods: Incorporating more sophisticated detrending and smoothing techniques, such as wavelet transform or empirical mode decomposition, can help improve the script's ability to accurately identify cycles and trends in the data.
Machine learning integration: Integrating machine learning techniques, such as artificial neural networks or support vector machines, can help enhance the script's predictive capabilities, leading to more accurate financial models.
Enhancements for General and Advanced Trading
Customizable indicator integration: Allowing users to integrate their own technical indicators can help improve the script's effectiveness for both general and advanced trading. By enabling the combination of the dominant cycle information with other technical analysis tools, traders can develop more comprehensive trading strategies.
Risk management and position sizing: Incorporating risk management and position sizing functionality into the script can help traders better manage their trades and control potential losses. This can be achieved by calculating the optimal position size based on the user's risk tolerance and account size.
Multi-timeframe analysis: Enhancing the script to perform multi-timeframe analysis can provide traders with a more holistic view of market trends and cycles. By identifying dominant cycles on different timeframes, traders can gain insights into the potential confluence of cycles and make better-informed trading decisions.
Enhancements for High-Frequency Finance Trading
Algorithm optimization: To ensure the script's suitability for high-frequency finance trading, optimizing the algorithm for faster execution is crucial. This can be achieved by employing efficient data structures and refining the calculation methods to minimize computational complexity.
Real-time data streaming: Integrating real-time data streaming capabilities into the script can help high-frequency traders react to market changes more quickly. By continuously updating the cycle information based on real-time market data, traders can adapt their strategies accordingly and capitalize on short-term market fluctuations.
Order execution and trade management: To fully leverage the script's capabilities for high-frequency trading, implementing functionality for automated order execution and trade management is essential. This can include features such as stop-loss and take-profit orders, trailing stops, and automated trade exit strategies.
While the existing Goertzel algorithm-based script is a valuable tool for detecting dominant cycles in financial data, there are several potential enhancements that can make it even more powerful for financial modeling, general trading, advanced trading, and high-frequency finance trading. By incorporating these improvements, the script can become a more versatile and effective tool for traders and financial analysts alike.
█ Understanding the Limitations of the Goertzel Algorithm
While the Goertzel algorithm-based script for detecting dominant cycles in financial data provides valuable insights, it is important to be aware of its limitations and drawbacks. Some of the key drawbacks of this indicator are:
Lagging nature:
As with many other technical indicators, the Goertzel algorithm-based script can suffer from lagging effects, meaning that it may not immediately react to real-time market changes. This lag can lead to late entries and exits, potentially resulting in reduced profitability or increased losses.
Parameter sensitivity:
The performance of the script can be sensitive to the chosen parameters, such as the detrending methods, smoothing techniques, and cycle detection settings. Improper parameter selection may lead to inaccurate cycle detection or increased false signals, which can negatively impact trading performance.
Complexity:
The Goertzel algorithm itself is relatively complex, making it difficult for novice traders or those unfamiliar with the concept of cycle analysis to fully understand and effectively utilize the script. This complexity can also make it challenging to optimize the script for specific trading styles or market conditions.
Overfitting risk:
As with any data-driven approach, there is a risk of overfitting when using the Goertzel algorithm-based script. Overfitting occurs when a model becomes too specific to the historical data it was trained on, leading to poor performance on new, unseen data. This can result in misleading signals and reduced trading performance.
No guarantee of future performance: While the script can provide insights into past cycles and potential future trends, it is important to remember that past performance does not guarantee future results. Market conditions can change, and relying solely on the script's predictions without considering other factors may lead to poor trading decisions.
Limited applicability: The Goertzel algorithm-based script may not be suitable for all markets, trading styles, or timeframes. Its effectiveness in detecting cycles may be limited in certain market conditions, such as during periods of extreme volatility or low liquidity.
While the Goertzel algorithm-based script offers valuable insights into dominant cycles in financial data, it is essential to consider its drawbacks and limitations when incorporating it into a trading strategy. Traders should always use the script in conjunction with other technical and fundamental analysis tools, as well as proper risk management, to make well-informed trading decisions.
█ Interpreting Results
The Goertzel Browser indicator can be interpreted by analyzing the plotted lines and the table presented alongside them. The indicator plots two lines: past and future composite waves. The past composite wave represents the composite wave of the past price data, and the future composite wave represents the projected composite wave for the next period.
The past composite wave line displays a solid line, with green indicating a bullish trend and red indicating a bearish trend. On the other hand, the future composite wave line is a dotted line with fuchsia indicating a bullish trend and yellow indicating a bearish trend.
The table presented alongside the indicator shows the top cycles with their corresponding rank, period, Bartels, amplitude or cycle strength, and phase. The amplitude is a measure of the strength of the cycle, while the phase is the position of the cycle within the data series.
Interpreting the Goertzel Browser indicator involves identifying the trend of the past and future composite wave lines and matching them with the corresponding bullish or bearish color. Additionally, traders can identify the top cycles with the highest amplitude or cycle strength and utilize them in conjunction with other technical indicators and fundamental analysis for trading decisions.
This indicator is considered a repainting indicator because the value of the indicator is calculated based on the past price data. As new price data becomes available, the indicator's value is recalculated, potentially causing the indicator's past values to change. This can create a false impression of the indicator's performance, as it may appear to have provided a profitable trading signal in the past when, in fact, that signal did not exist at the time.
The Goertzel indicator is also non-endpointed, meaning that it is not calculated up to the current bar or candle. Instead, it uses a fixed amount of historical data to calculate its values, which can make it difficult to use for real-time trading decisions. For example, if the indicator uses 100 bars of historical data to make its calculations, it cannot provide a signal until the current bar has closed and become part of the historical data. This can result in missed trading opportunities or delayed signals.
█ Conclusion
The Goertzel Browser indicator is a powerful tool for identifying and analyzing cyclical patterns in financial markets. Its ability to detect multiple cycles of varying frequencies and strengths make it a valuable addition to any trader's technical analysis toolkit. However, it is important to keep in mind that the Goertzel Browser indicator should be used in conjunction with other technical analysis tools and fundamental analysis to achieve the best results. With continued refinement and development, the Goertzel Browser indicator has the potential to become a highly effective tool for financial modeling, general trading, advanced trading, and high-frequency finance trading. Its accuracy and versatility make it a promising candidate for further research and development.
█ Footnotes
What is the Bartels Test for Cycle Significance?
The Bartels Cycle Significance Test is a statistical method that determines whether the peaks and troughs of a time series are statistically significant. The test is named after its inventor, George Bartels, who developed it in the mid-20th century.
The Bartels test is designed to analyze the cyclical components of a time series, which can help traders and analysts identify trends and cycles in financial markets. The test calculates a Bartels statistic, which measures the degree of non-randomness or autocorrelation in the time series.
The Bartels statistic is calculated by first splitting the time series into two halves and calculating the range of the peaks and troughs in each half. The test then compares these ranges using a t-test, which measures the significance of the difference between the two ranges.
If the Bartels statistic is greater than a critical value, it indicates that the peaks and troughs in the time series are non-random and that there is a significant cyclical component to the data. Conversely, if the Bartels statistic is less than the critical value, it suggests that the peaks and troughs are random and that there is no significant cyclical component.
The Bartels Cycle Significance Test is particularly useful in financial analysis because it can help traders and analysts identify significant cycles in asset prices, which can in turn inform investment decisions. However, it is important to note that the test is not perfect and can produce false signals in certain situations, particularly in noisy or volatile markets. Therefore, it is always recommended to use the test in conjunction with other technical and fundamental indicators to confirm trends and cycles.
Deep-dive into the Hodrick-Prescott Fitler
The Hodrick-Prescott (HP) filter is a statistical tool used in economics and finance to separate a time series into two components: a trend component and a cyclical component. It is a powerful tool for identifying long-term trends in economic and financial data and is widely used by economists, central banks, and financial institutions around the world.
The HP filter was first introduced in the 1990s by economists Robert Hodrick and Edward Prescott. It is a simple, two-parameter filter that separates a time series into a trend component and a cyclical component. The trend component represents the long-term behavior of the data, while the cyclical component captures the shorter-term fluctuations around the trend.
The HP filter works by minimizing the following objective function:
Minimize: (Sum of Squared Deviations) + λ (Sum of Squared Second Differences)
Where:
The first term represents the deviation of the data from the trend.
The second term represents the smoothness of the trend.
λ is a smoothing parameter that determines the degree of smoothness of the trend.
The smoothing parameter λ is typically set to a value between 100 and 1600, depending on the frequency of the data. Higher values of λ lead to a smoother trend, while lower values lead to a more volatile trend.
The HP filter has several advantages over other smoothing techniques. It is a non-parametric method, meaning that it does not make any assumptions about the underlying distribution of the data. It also allows for easy comparison of trends across different time series and can be used with data of any frequency.
However, the HP filter also has some limitations. It assumes that the trend is a smooth function, which may not be the case in some situations. It can also be sensitive to changes in the smoothing parameter λ, which may result in different trends for the same data. Additionally, the filter may produce unrealistic trends for very short time series.
Despite these limitations, the HP filter remains a valuable tool for analyzing economic and financial data. It is widely used by central banks and financial institutions to monitor long-term trends in the economy, and it can be used to identify turning points in the business cycle. The filter can also be used to analyze asset prices, exchange rates, and other financial variables.
The Hodrick-Prescott filter is a powerful tool for analyzing economic and financial data. It separates a time series into a trend component and a cyclical component, allowing for easy identification of long-term trends and turning points in the business cycle. While it has some limitations, it remains a valuable tool for economists, central banks, and financial institutions around the world.

loxxfftLibrary "loxxfft"
This code is a library for performing Fast Fourier Transform (FFT) operations. FFT is an algorithm that can quickly compute the discrete Fourier transform (DFT) of a sequence. The library includes functions for performing FFTs on both real and complex data. It also includes functions for fast correlation and convolution, which are operations that can be performed efficiently using FFTs. Additionally, the library includes functions for fast sine and cosine transforms.
Reference:
www.alglib.net
fastfouriertransform(a, nn, inversefft)
Returns Fast Fourier Transform
Parameters:
a (float ) : float , An array of real and imaginary parts of the function values. The real part is stored at even indices, and the imaginary part is stored at odd indices.
nn (int) : int, The number of function values. It must be a power of two, but the algorithm does not validate this.
inversefft (bool) : bool, A boolean value that indicates the direction of the transformation. If True, it performs the inverse FFT; if False, it performs the direct FFT.
Returns: float , Modifies the input array a in-place, which means that the transformed data (the FFT result for direct transformation or the inverse FFT result for inverse transformation) will be stored in the same array a after the function execution. The transformed data will have real and imaginary parts interleaved, with the real parts at even indices and the imaginary parts at odd indices.
realfastfouriertransform(a, tnn, inversefft)
Returns Real Fast Fourier Transform
Parameters:
a (float ) : float , A float array containing the real-valued function samples.
tnn (int) : int, The number of function values (must be a power of 2, but the algorithm does not validate this condition).
inversefft (bool) : bool, A boolean flag that indicates the direction of the transformation (True for inverse, False for direct).
Returns: float , Modifies the input array a in-place, meaning that the transformed data (the FFT result for direct transformation or the inverse FFT result for inverse transformation) will be stored in the same array a after the function execution.
fastsinetransform(a, tnn, inversefst)
Returns Fast Discrete Sine Conversion
Parameters:
a (float ) : float , An array of real numbers representing the function values.
tnn (int) : int, Number of function values (must be a power of two, but the code doesn't validate this).
inversefst (bool) : bool, A boolean flag indicating the direction of the transformation. If True, it performs the inverse FST, and if False, it performs the direct FST.
Returns: float , The output is the transformed array 'a', which will contain the result of the transformation.
fastcosinetransform(a, tnn, inversefct)
Returns Fast Discrete Cosine Transform
Parameters:
a (float ) : float , This is a floating-point array representing the sequence of values (time-domain) that you want to transform. The function will perform the Fast Cosine Transform (FCT) or the inverse FCT on this input array, depending on the value of the inversefct parameter. The transformed result will also be stored in this same array, which means the function modifies the input array in-place.
tnn (int) : int, This is an integer value representing the number of data points in the input array a. It is used to determine the size of the input array and control the loops in the algorithm. Note that the size of the input array should be a power of 2 for the Fast Cosine Transform algorithm to work correctly.
inversefct (bool) : bool, This is a boolean value that controls whether the function performs the regular Fast Cosine Transform or the inverse FCT. If inversefct is set to true, the function will perform the inverse FCT, and if set to false, the regular FCT will be performed. The inverse FCT can be used to transform data back into its original form (time-domain) after the regular FCT has been applied.
Returns: float , The resulting transformed array is stored in the input array a. This means that the function modifies the input array in-place and does not return a new array.
fastconvolution(signal, signallen, response, negativelen, positivelen)
Convolution using FFT
Parameters:
signal (float ) : float , This is an array of real numbers representing the input signal that will be convolved with the response function. The elements are numbered from 0 to SignalLen-1.
signallen (int) : int, This is an integer representing the length of the input signal array. It specifies the number of elements in the signal array.
response (float ) : float , This is an array of real numbers representing the response function used for convolution. The response function consists of two parts: one corresponding to positive argument values and the other to negative argument values. Array elements with numbers from 0 to NegativeLen match the response values at points from -NegativeLen to 0, respectively. Array elements with numbers from NegativeLen+1 to NegativeLen+PositiveLen correspond to the response values in points from 1 to PositiveLen, respectively.
negativelen (int) : int, This is an integer representing the "negative length" of the response function. It indicates the number of elements in the response function array that correspond to negative argument values. Outside the range , the response function is considered zero.
positivelen (int) : int, This is an integer representing the "positive length" of the response function. It indicates the number of elements in the response function array that correspond to positive argument values. Similar to negativelen, outside the range , the response function is considered zero.
Returns: float , The resulting convolved values are stored back in the input signal array.
fastcorrelation(signal, signallen, pattern, patternlen)
Returns Correlation using FFT
Parameters:
signal (float ) : float ,This is an array of real numbers representing the signal to be correlated with the pattern. The elements are numbered from 0 to SignalLen-1.
signallen (int) : int, This is an integer representing the length of the input signal array.
pattern (float ) : float , This is an array of real numbers representing the pattern to be correlated with the signal. The elements are numbered from 0 to PatternLen-1.
patternlen (int) : int, This is an integer representing the length of the pattern array.
Returns: float , The signal array containing the correlation values at points from 0 to SignalLen-1.
tworealffts(a1, a2, a, b, tn)
Returns Fast Fourier Transform of Two Real Functions
Parameters:
a1 (float ) : float , An array of real numbers, representing the values of the first function.
a2 (float ) : float , An array of real numbers, representing the values of the second function.
a (float ) : float , An output array to store the Fourier transform of the first function.
b (float ) : float , An output array to store the Fourier transform of the second function.
tn (int) : float , An integer representing the number of function values. It must be a power of two, but the algorithm doesn't validate this condition.
Returns: float , The a and b arrays will contain the Fourier transform of the first and second functions, respectively. Note that the function overwrites the input arrays a and b.
█ Detailed explaination of each function
Fast Fourier Transform
The fastfouriertransform() function takes three input parameters:
1. a: An array of real and imaginary parts of the function values. The real part is stored at even indices, and the imaginary part is stored at odd indices.
2. nn: The number of function values. It must be a power of two, but the algorithm does not validate this.
3. inversefft: A boolean value that indicates the direction of the transformation. If True, it performs the inverse FFT; if False, it performs the direct FFT.
The function performs the FFT using the Cooley-Tukey algorithm, which is an efficient algorithm for computing the discrete Fourier transform (DFT) and its inverse. The Cooley-Tukey algorithm recursively breaks down the DFT of a sequence into smaller DFTs of subsequences, leading to a significant reduction in computational complexity. The algorithm's time complexity is O(n log n), where n is the number of samples.
The fastfouriertransform() function first initializes variables and determines the direction of the transformation based on the inversefft parameter. If inversefft is True, the isign variable is set to -1; otherwise, it is set to 1.
Next, the function performs the bit-reversal operation. This is a necessary step before calculating the FFT, as it rearranges the input data in a specific order required by the Cooley-Tukey algorithm. The bit-reversal is performed using a loop that iterates through the nn samples, swapping the data elements according to their bit-reversed index.
After the bit-reversal operation, the function iteratively computes the FFT using the Cooley-Tukey algorithm. It performs calculations in a loop that goes through different stages, doubling the size of the sub-FFT at each stage. Within each stage, the Cooley-Tukey algorithm calculates the butterfly operations, which are mathematical operations that combine the results of smaller DFTs into the final DFT. The butterfly operations involve complex number multiplication and addition, updating the input array a with the computed values.
The loop also calculates the twiddle factors, which are complex exponential factors used in the butterfly operations. The twiddle factors are calculated using trigonometric functions, such as sine and cosine, based on the angle theta. The variables wpr, wpi, wr, and wi are used to store intermediate values of the twiddle factors, which are updated in each iteration of the loop.
Finally, if the inversefft parameter is True, the function divides the result by the number of samples nn to obtain the correct inverse FFT result. This normalization step is performed using a loop that iterates through the array a and divides each element by nn.
In summary, the fastfouriertransform() function is an implementation of the Cooley-Tukey FFT algorithm, which is an efficient algorithm for computing the DFT and its inverse. This FFT library can be used for a variety of applications, such as signal processing, image processing, audio processing, and more.
Feal Fast Fourier Transform
The realfastfouriertransform() function performs a fast Fourier transform (FFT) specifically for real-valued functions. The FFT is an efficient algorithm used to compute the discrete Fourier transform (DFT) and its inverse, which are fundamental tools in signal processing, image processing, and other related fields.
This function takes three input parameters:
1. a - A float array containing the real-valued function samples.
2. tnn - The number of function values (must be a power of 2, but the algorithm does not validate this condition).
3. inversefft - A boolean flag that indicates the direction of the transformation (True for inverse, False for direct).
The function modifies the input array a in-place, meaning that the transformed data (the FFT result for direct transformation or the inverse FFT result for inverse transformation) will be stored in the same array a after the function execution.
The algorithm uses a combination of complex-to-complex FFT and additional transformations specific to real-valued data to optimize the computation. It takes into account the symmetry properties of the real-valued input data to reduce the computational complexity.
Here's a detailed walkthrough of the algorithm:
1. Depending on the inversefft flag, the initial values for ttheta, c1, and c2 are determined. These values are used for the initial data preprocessing and post-processing steps specific to the real-valued FFT.
2. The preprocessing step computes the initial real and imaginary parts of the data using a combination of sine and cosine terms with the input data. This step effectively converts the real-valued input data into complex-valued data suitable for the complex-to-complex FFT.
3. The complex-to-complex FFT is then performed on the preprocessed complex data. This involves bit-reversal reordering, followed by the Cooley-Tukey radix-2 decimation-in-time algorithm. This part of the code is similar to the fastfouriertransform() function you provided earlier.
4. After the complex-to-complex FFT, a post-processing step is performed to obtain the final real-valued output data. This involves updating the real and imaginary parts of the transformed data using sine and cosine terms, as well as the values c1 and c2.
5. Finally, if the inversefft flag is True, the output data is divided by the number of samples (nn) to obtain the inverse DFT.
The function does not return a value explicitly. Instead, the transformed data is stored in the input array a. After the function execution, you can access the transformed data in the a array, which will have the real part at even indices and the imaginary part at odd indices.
Fast Sine Transform
This code defines a function called fastsinetransform that performs a Fast Discrete Sine Transform (FST) on an array of real numbers. The function takes three input parameters:
1. a (float array): An array of real numbers representing the function values.
2. tnn (int): Number of function values (must be a power of two, but the code doesn't validate this).
3. inversefst (bool): A boolean flag indicating the direction of the transformation. If True, it performs the inverse FST, and if False, it performs the direct FST.
The output is the transformed array 'a', which will contain the result of the transformation.
The code starts by initializing several variables, including trigonometric constants for the sine transform. It then sets the first value of the array 'a' to 0 and calculates the initial values of 'y1' and 'y2', which are used to update the input array 'a' in the following loop.
The first loop (with index 'jx') iterates from 2 to (tm + 1), where 'tm' is half of the number of input samples 'tnn'. This loop is responsible for calculating the initial sine transform of the input data.
The second loop (with index 'ii') is a bit-reversal loop. It reorders the elements in the array 'a' based on the bit-reversed indices of the original order.
The third loop (with index 'ii') iterates while 'n' is greater than 'mmax', which starts at 2 and doubles each iteration. This loop performs the actual Fast Discrete Sine Transform. It calculates the sine transform using the Danielson-Lanczos lemma, which is a divide-and-conquer strategy for calculating Discrete Fourier Transforms (DFTs) efficiently.
The fourth loop (with index 'ix') is responsible for the final phase adjustments needed for the sine transform, updating the array 'a' accordingly.
The fifth loop (with index 'jj') updates the array 'a' one more time by dividing each element by 2 and calculating the sum of the even-indexed elements.
Finally, if the 'inversefst' flag is True, the code scales the transformed data by a factor of 2/tnn to get the inverse Fast Sine Transform.
In summary, the code performs a Fast Discrete Sine Transform on an input array of real numbers, either in the direct or inverse direction, and returns the transformed array. The algorithm is based on the Danielson-Lanczos lemma and uses a divide-and-conquer strategy for efficient computation.
Fast Cosine Transform
This code defines a function called fastcosinetransform that takes three parameters: a floating-point array a, an integer tnn, and a boolean inversefct. The function calculates the Fast Cosine Transform (FCT) or the inverse FCT of the input array, depending on the value of the inversefct parameter.
The Fast Cosine Transform is an algorithm that converts a sequence of values (time-domain) into a frequency domain representation. It is closely related to the Fast Fourier Transform (FFT) and can be used in various applications, such as signal processing and image compression.
Here's a detailed explanation of the code:
1. The function starts by initializing a number of variables, including counters, intermediate values, and constants.
2. The initial steps of the algorithm are performed. This includes calculating some trigonometric values and updating the input array a with the help of intermediate variables.
3. The code then enters a loop (from jx = 2 to tnn / 2). Within this loop, the algorithm computes and updates the elements of the input array a.
4. After the loop, the function prepares some variables for the next stage of the algorithm.
5. The next part of the algorithm is a series of nested loops that perform the bit-reversal permutation and apply the FCT to the input array a.
6. The code then calculates some additional trigonometric values, which are used in the next loop.
7. The following loop (from ix = 2 to tnn / 4 + 1) computes and updates the elements of the input array a using the previously calculated trigonometric values.
8. The input array a is further updated with the final calculations.
9. In the last loop (from j = 4 to tnn), the algorithm computes and updates the sum of elements in the input array a.
10. Finally, if the inversefct parameter is set to true, the function scales the input array a to obtain the inverse FCT.
The resulting transformed array is stored in the input array a. This means that the function modifies the input array in-place and does not return a new array.
Fast Convolution
This code defines a function called fastconvolution that performs the convolution of a given signal with a response function using the Fast Fourier Transform (FFT) technique. Convolution is a mathematical operation used in signal processing to combine two signals, producing a third signal representing how the shape of one signal is modified by the other.
The fastconvolution function takes the following input parameters:
1. float signal: This is an array of real numbers representing the input signal that will be convolved with the response function. The elements are numbered from 0 to SignalLen-1.
2. int signallen: This is an integer representing the length of the input signal array. It specifies the number of elements in the signal array.
3. float response: This is an array of real numbers representing the response function used for convolution. The response function consists of two parts: one corresponding to positive argument values and the other to negative argument values. Array elements with numbers from 0 to NegativeLen match the response values at points from -NegativeLen to 0, respectively. Array elements with numbers from NegativeLen+1 to NegativeLen+PositiveLen correspond to the response values in points from 1 to PositiveLen, respectively.
4. int negativelen: This is an integer representing the "negative length" of the response function. It indicates the number of elements in the response function array that correspond to negative argument values. Outside the range , the response function is considered zero.
5. int positivelen: This is an integer representing the "positive length" of the response function. It indicates the number of elements in the response function array that correspond to positive argument values. Similar to negativelen, outside the range , the response function is considered zero.
The function works by:
1. Calculating the length nl of the arrays used for FFT, ensuring it's a power of 2 and large enough to hold the signal and response.
2. Creating two new arrays, a1 and a2, of length nl and initializing them with the input signal and response function, respectively.
3. Applying the forward FFT (realfastfouriertransform) to both arrays, a1 and a2.
4. Performing element-wise multiplication of the FFT results in the frequency domain.
5. Applying the inverse FFT (realfastfouriertransform) to the multiplied results in a1.
6. Updating the original signal array with the convolution result, which is stored in the a1 array.
The result of the convolution is stored in the input signal array at the function exit.
Fast Correlation
This code defines a function called fastcorrelation that computes the correlation between a signal and a pattern using the Fast Fourier Transform (FFT) method. The function takes four input arguments and modifies the input signal array to store the correlation values.
Input arguments:
1. float signal: This is an array of real numbers representing the signal to be correlated with the pattern. The elements are numbered from 0 to SignalLen-1.
2. int signallen: This is an integer representing the length of the input signal array.
3. float pattern: This is an array of real numbers representing the pattern to be correlated with the signal. The elements are numbered from 0 to PatternLen-1.
4. int patternlen: This is an integer representing the length of the pattern array.
The function performs the following steps:
1. Calculate the required size nl for the FFT by finding the smallest power of 2 that is greater than or equal to the sum of the lengths of the signal and the pattern.
2. Create two new arrays a1 and a2 with the length nl and initialize them to 0.
3. Copy the signal array into a1 and pad it with zeros up to the length nl.
4. Copy the pattern array into a2 and pad it with zeros up to the length nl.
5. Compute the FFT of both a1 and a2.
6. Perform element-wise multiplication of the frequency-domain representation of a1 and the complex conjugate of the frequency-domain representation of a2.
7. Compute the inverse FFT of the result obtained in step 6.
8. Store the resulting correlation values in the original signal array.
At the end of the function, the signal array contains the correlation values at points from 0 to SignalLen-1.
Fast Fourier Transform of Two Real Functions
This code defines a function called tworealffts that computes the Fast Fourier Transform (FFT) of two real-valued functions (a1 and a2) using a Cooley-Tukey-based radix-2 Decimation in Time (DIT) algorithm. The FFT is a widely used algorithm for computing the discrete Fourier transform (DFT) and its inverse.
Input parameters:
1. float a1: an array of real numbers, representing the values of the first function.
2. float a2: an array of real numbers, representing the values of the second function.
3. float a: an output array to store the Fourier transform of the first function.
4. float b: an output array to store the Fourier transform of the second function.
5. int tn: an integer representing the number of function values. It must be a power of two, but the algorithm doesn't validate this condition.
The function performs the following steps:
1. Combine the two input arrays, a1 and a2, into a single array a by interleaving their elements.
2. Perform a 1D FFT on the combined array a using the radix-2 DIT algorithm.
3. Separate the FFT results of the two input functions from the combined array a and store them in output arrays a and b.
Here is a detailed breakdown of the radix-2 DIT algorithm used in this code:
1. Bit-reverse the order of the elements in the combined array a.
2. Initialize the loop variables mmax, istep, and theta.
3. Enter the main loop that iterates through different stages of the FFT.
a. Compute the sine and cosine values for the current stage using the theta variable.
b. Initialize the loop variables wr and wi for the current stage.
c. Enter the inner loop that iterates through the butterfly operations within each stage.
i. Perform the butterfly operation on the elements of array a.
ii. Update the loop variables wr and wi for the next butterfly operation.
d. Update the loop variables mmax, istep, and theta for the next stage.
4. Separate the FFT results of the two input functions from the combined array a and store them in output arrays a and b.
At the end of the function, the a and b arrays will contain the Fourier transform of the first and second functions, respectively. Note that the function overwrites the input arrays a and b.
█ Example scripts using functions contained in loxxfft
Real-Fast Fourier Transform of Price w/ Linear Regression
Real-Fast Fourier Transform of Price Oscillator
Normalized, Variety, Fast Fourier Transform Explorer
Variety RSI of Fast Discrete Cosine Transform
STD-Stepped Fast Cosine Transform Moving Average
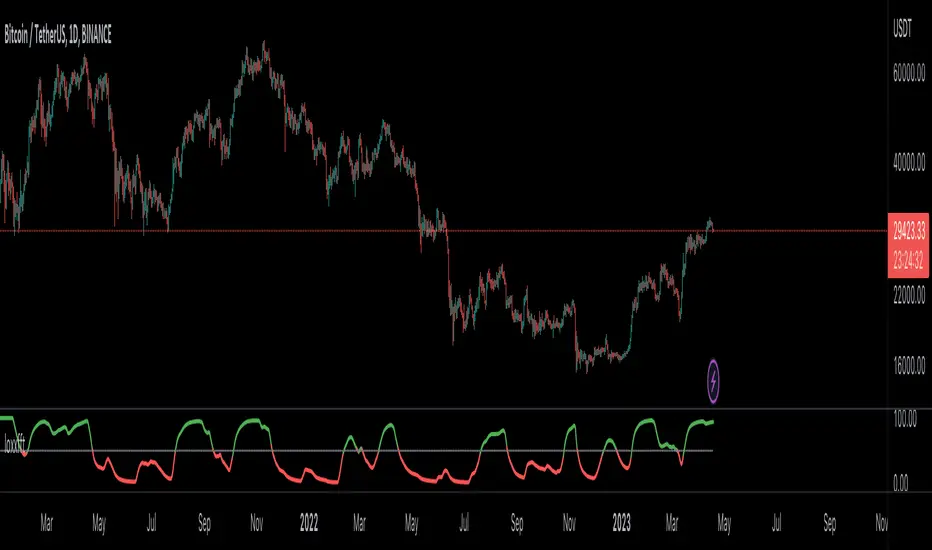
Fourier Spectrometer of Price w/ Extrapolation Forecast [Loxx]Fourier Spectrometer of Price w/ Extrapolation Forecast is a forecasting indicator that forecasts the sinusoidal frequency of input price. This method uses Linear Regression with a Fast Fourier Transform function for the forecast and is different from previous forecasting methods I've posted. Dotted lines are the forecast frequencies. You can change the UI colors and line widths. This comes with 8 frequencies out of the box. Instead of drawing sinusoidal manually on your charts, you can use this instead. This will render better results than eyeballing the Sine Wave that folks use for trading. this is the real math that automates that process.
Each signal line can be shown as a linear superposition of periodic (sinusoidal) components with different periods (frequencies) and amplitudes. Roughly, the indicator shows those components. It strongly depends on the probing window and changes (recalculates) after each tick; e.g., you can see the set of frequencies showing whether the signal is fast or slow-changing, etc. Sometimes only a small number of leading / strongest components (e.g., 3) can extrapolate the signal quite well.
Related Indicators
Fourier Extrapolator of 'Caterpillar' SSA of Price
Real-Fast Fourier Transform of Price w/ Linear Regression
Fourier Extrapolator of Price w/ Projection Forecast
Itakura-Saito Autoregressive Extrapolation of Price
Helme-Nikias Weighted Burg AR-SE Extra. of Price
***The period parameter doesn't correspond to how many bars back the drawing begins. Lines re rendered according to skipping mechanism due to TradingView limitations.
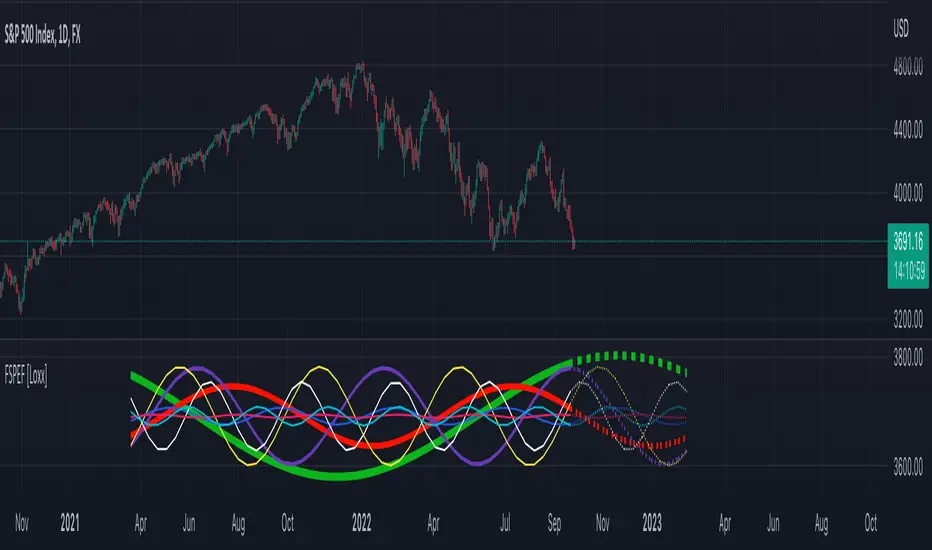
Normalized, Variety, Fast Fourier Transform Explorer [Loxx]Normalized, Variety, Fast Fourier Transform Explorer demonstrates Real, Cosine, and Sine Fast Fourier Transform algorithms. This indicator can be used as a rule of thumb but shouldn't be used in trading.
What is the Discrete Fourier Transform?
In mathematics, the discrete Fourier transform (DFT) converts a finite sequence of equally-spaced samples of a function into a same-length sequence of equally-spaced samples of the discrete-time Fourier transform (DTFT), which is a complex-valued function of frequency. The interval at which the DTFT is sampled is the reciprocal of the duration of the input sequence. An inverse DFT is a Fourier series, using the DTFT samples as coefficients of complex sinusoids at the corresponding DTFT frequencies. It has the same sample-values as the original input sequence. The DFT is therefore said to be a frequency domain representation of the original input sequence. If the original sequence spans all the non-zero values of a function, its DTFT is continuous (and periodic), and the DFT provides discrete samples of one cycle. If the original sequence is one cycle of a periodic function, the DFT provides all the non-zero values of one DTFT cycle.
What is the Complex Fast Fourier Transform?
The complex Fast Fourier Transform algorithm transforms N real or complex numbers into another N complex numbers. The complex FFT transforms a real or complex signal x in the time domain into a complex two-sided spectrum X in the frequency domain. You must remember that zero frequency corresponds to n = 0, positive frequencies 0 < f < f_c correspond to values 1 ≤ n ≤ N/2 −1, while negative frequencies −fc < f < 0 correspond to N/2 +1 ≤ n ≤ N −1. The value n = N/2 corresponds to both f = f_c and f = −f_c. f_c is the critical or Nyquist frequency with f_c = 1/(2*T) or half the sampling frequency. The first harmonic X corresponds to the frequency 1/(N*T).
The complex FFT requires the list of values (resolution, or N) to be a power 2. If the input size if not a power of 2, then the input data will be padded with zeros to fit the size of the closest power of 2 upward.
What is Real-Fast Fourier Transform?
Has conditions similar to the complex Fast Fourier Transform value, except that the input data must be purely real. If the time series data has the basic type complex64, only the real parts of the complex numbers are used for the calculation. The imaginary parts are silently discarded.
What is the Real-Fast Fourier Transform?
In many applications, the input data for the DFT are purely real, in which case the outputs satisfy the symmetry
X(N-k)=X(k)
and efficient FFT algorithms have been designed for this situation (see e.g. Sorensen, 1987). One approach consists of taking an ordinary algorithm (e.g. Cooley–Tukey) and removing the redundant parts of the computation, saving roughly a factor of two in time and memory. Alternatively, it is possible to express an even-length real-input DFT as a complex DFT of half the length (whose real and imaginary parts are the even/odd elements of the original real data), followed by O(N) post-processing operations.
It was once believed that real-input DFTs could be more efficiently computed by means of the discrete Hartley transform (DHT), but it was subsequently argued that a specialized real-input DFT algorithm (FFT) can typically be found that requires fewer operations than the corresponding DHT algorithm (FHT) for the same number of inputs. Bruun's algorithm (above) is another method that was initially proposed to take advantage of real inputs, but it has not proved popular.
There are further FFT specializations for the cases of real data that have even/odd symmetry, in which case one can gain another factor of roughly two in time and memory and the DFT becomes the discrete cosine/sine transform(s) (DCT/DST). Instead of directly modifying an FFT algorithm for these cases, DCTs/DSTs can also be computed via FFTs of real data combined with O(N) pre- and post-processing.
What is the Discrete Cosine Transform?
A discrete cosine transform ( DCT ) expresses a finite sequence of data points in terms of a sum of cosine functions oscillating at different frequencies. The DCT , first proposed by Nasir Ahmed in 1972, is a widely used transformation technique in signal processing and data compression. It is used in most digital media, including digital images (such as JPEG and HEIF, where small high-frequency components can be discarded), digital video (such as MPEG and H.26x), digital audio (such as Dolby Digital, MP3 and AAC ), digital television (such as SDTV, HDTV and VOD ), digital radio (such as AAC+ and DAB+), and speech coding (such as AAC-LD, Siren and Opus). DCTs are also important to numerous other applications in science and engineering, such as digital signal processing, telecommunication devices, reducing network bandwidth usage, and spectral methods for the numerical solution of partial differential equations.
The use of cosine rather than sine functions is critical for compression, since it turns out (as described below) that fewer cosine functions are needed to approximate a typical signal, whereas for differential equations the cosines express a particular choice of boundary conditions. In particular, a DCT is a Fourier-related transform similar to the discrete Fourier transform (DFT), but using only real numbers. The DCTs are generally related to Fourier Series coefficients of a periodically and symmetrically extended sequence whereas DFTs are related to Fourier Series coefficients of only periodically extended sequences. DCTs are equivalent to DFTs of roughly twice the length, operating on real data with even symmetry (since the Fourier transform of a real and even function is real and even), whereas in some variants the input and/or output data are shifted by half a sample. There are eight standard DCT variants, of which four are common.
The most common variant of discrete cosine transform is the type-II DCT , which is often called simply "the DCT". This was the original DCT as first proposed by Ahmed. Its inverse, the type-III DCT , is correspondingly often called simply "the inverse DCT" or "the IDCT". Two related transforms are the discrete sine transform ( DST ), which is equivalent to a DFT of real and odd functions, and the modified discrete cosine transform (MDCT), which is based on a DCT of overlapping data. Multidimensional DCTs ( MD DCTs) are developed to extend the concept of DCT to MD signals. There are several algorithms to compute MD DCT . A variety of fast algorithms have been developed to reduce the computational complexity of implementing DCT . One of these is the integer DCT (IntDCT), an integer approximation of the standard DCT ,: ix, xiii, 1, 141–304 used in several ISO /IEC and ITU-T international standards.
What is the Discrete Sine Transform?
In mathematics, the discrete sine transform (DST) is a Fourier-related transform similar to the discrete Fourier transform (DFT), but using a purely real matrix. It is equivalent to the imaginary parts of a DFT of roughly twice the length, operating on real data with odd symmetry (since the Fourier transform of a real and odd function is imaginary and odd), where in some variants the input and/or output data are shifted by half a sample.
A family of transforms composed of sine and sine hyperbolic functions exists. These transforms are made based on the natural vibration of thin square plates with different boundary conditions.
The DST is related to the discrete cosine transform (DCT), which is equivalent to a DFT of real and even functions. See the DCT article for a general discussion of how the boundary conditions relate the various DCT and DST types. Generally, the DST is derived from the DCT by replacing the Neumann condition at x=0 with a Dirichlet condition. Both the DCT and the DST were described by Nasir Ahmed T. Natarajan and K.R. Rao in 1974. The type-I DST (DST-I) was later described by Anil K. Jain in 1976, and the type-II DST (DST-II) was then described by H.B. Kekra and J.K. Solanka in 1978.
Notable settings
windowper = period for calculation, restricted to powers of 2: "16", "32", "64", "128", "256", "512", "1024", "2048", this reason for this is FFT is an algorithm that computes DFT (Discrete Fourier Transform) in a fast way, generally in 𝑂(𝑁⋅log2(𝑁)) instead of 𝑂(𝑁2). To achieve this the input matrix has to be a power of 2 but many FFT algorithm can handle any size of input since the matrix can be zero-padded. For our purposes here, we stick to powers of 2 to keep this fast and neat. read more about this here: Cooley–Tukey FFT algorithm
SS = smoothing count, this smoothing happens after the first FCT regular pass. this zeros out frequencies from the previously calculated values above SS count. the lower this number, the smoother the output, it works opposite from other smoothing periods
Fmin1 = zeroes out frequencies not passing this test for min value
Fmax1 = zeroes out frequencies not passing this test for max value
barsback = moves the window backward
Inverse = whether or not you wish to invert the FFT after first pass calculation
Related indicators
Real-Fast Fourier Transform of Price Oscillator
STD-Stepped Fast Cosine Transform Moving Average
Real-Fast Fourier Transform of Price w/ Linear Regression
Variety RSI of Fast Discrete Cosine Transform
Additional reading
A Fast Computational Algorithm for the Discrete Cosine Transform by Chen et al.
Practical Fast 1-D DCT Algorithms With 11 Multiplications by Loeffler et al.
Cooley–Tukey FFT algorithm
Ahmed, Nasir (January 1991). "How I Came Up With the Discrete Cosine Transform". Digital Signal Processing. 1 (1): 4–5. doi:10.1016/1051-2004(91)90086-Z.
DCT-History - How I Came Up With The Discrete Cosine Transform
Comparative Analysis for Discrete Sine Transform as a suitable method for noise estimation

STD-Stepped Fast Cosine Transform Moving Average [Loxx]STD-Stepped Fast Cosine Transform Moving Average is an experimental moving average that uses Fast Cosine Transform to calculate a moving average. This indicator has standard deviation stepping in order to smooth the trend by weeding out low volatility movements.
What is the Discrete Cosine Transform?
A discrete cosine transform (DCT) expresses a finite sequence of data points in terms of a sum of cosine functions oscillating at different frequencies. The DCT, first proposed by Nasir Ahmed in 1972, is a widely used transformation technique in signal processing and data compression. It is used in most digital media, including digital images (such as JPEG and HEIF, where small high-frequency components can be discarded), digital video (such as MPEG and H.26x), digital audio (such as Dolby Digital, MP3 and AAC), digital television (such as SDTV, HDTV and VOD), digital radio (such as AAC+ and DAB+), and speech coding (such as AAC-LD, Siren and Opus). DCTs are also important to numerous other applications in science and engineering, such as digital signal processing, telecommunication devices, reducing network bandwidth usage, and spectral methods for the numerical solution of partial differential equations.
The use of cosine rather than sine functions is critical for compression, since it turns out (as described below) that fewer cosine functions are needed to approximate a typical signal, whereas for differential equations the cosines express a particular choice of boundary conditions. In particular, a DCT is a Fourier-related transform similar to the discrete Fourier transform (DFT), but using only real numbers. The DCTs are generally related to Fourier Series coefficients of a periodically and symmetrically extended sequence whereas DFTs are related to Fourier Series coefficients of only periodically extended sequences. DCTs are equivalent to DFTs of roughly twice the length, operating on real data with even symmetry (since the Fourier transform of a real and even function is real and even), whereas in some variants the input and/or output data are shifted by half a sample. There are eight standard DCT variants, of which four are common.
The most common variant of discrete cosine transform is the type-II DCT, which is often called simply "the DCT". This was the original DCT as first proposed by Ahmed. Its inverse, the type-III DCT, is correspondingly often called simply "the inverse DCT" or "the IDCT". Two related transforms are the discrete sine transform (DST), which is equivalent to a DFT of real and odd functions, and the modified discrete cosine transform (MDCT), which is based on a DCT of overlapping data. Multidimensional DCTs (MD DCTs) are developed to extend the concept of DCT to MD signals. There are several algorithms to compute MD DCT. A variety of fast algorithms have been developed to reduce the computational complexity of implementing DCT. One of these is the integer DCT (IntDCT), an integer approximation of the standard DCT, : ix, xiii, 1, 141–304 used in several ISO/IEC and ITU-T international standards.
Notable settings
windowper = period for calculation, restricted to powers of 2: "16", "32", "64", "128", "256", "512", "1024", "2048", this reason for this is FFT is an algorithm that computes DFT (Discrete Fourier Transform) in a fast way, generally in 𝑂(𝑁⋅log2(𝑁)) instead of 𝑂(𝑁2). To achieve this the input matrix has to be a power of 2 but many FFT algorithm can handle any size of input since the matrix can be zero-padded. For our purposes here, we stick to powers of 2 to keep this fast and neat. read more about this here: Cooley–Tukey FFT algorithm
smthper = smoothing count, this smoothing happens after the first FCT regular pass. this zeros out frequencies from the previously calculated values above SS count. the lower this number, the smoother the output, it works opposite from other smoothing periods
Included
Alerts
Signals
Loxx's Expanded Source Types
Additional reading
A Fast Computational Algorithm for the Discrete Cosine Transform by Chen et al.
Practical Fast 1-D DCT Algorithms With 11 Multiplications by Loeffler et al.
Cooley–Tukey FFT algorithm

Real-Fast Fourier Transform of Price Oscillator [Loxx]Real-Fast Fourier Transform Oscillator is a simple Real-Fast Fourier Transform Oscillator. You have the option to turn on inverse filter as well as min/max filters to fine tune the oscillator. This oscillator is normalized by default. This indicator is to demonstrate how one can easily turn the RFFT algorithm into an oscillator..
What is the Discrete Fourier Transform?
In mathematics, the discrete Fourier transform (DFT) converts a finite sequence of equally-spaced samples of a function into a same-length sequence of equally-spaced samples of the discrete-time Fourier transform (DTFT), which is a complex-valued function of frequency. The interval at which the DTFT is sampled is the reciprocal of the duration of the input sequence. An inverse DFT is a Fourier series, using the DTFT samples as coefficients of complex sinusoids at the corresponding DTFT frequencies. It has the same sample-values as the original input sequence. The DFT is therefore said to be a frequency domain representation of the original input sequence. If the original sequence spans all the non-zero values of a function, its DTFT is continuous (and periodic), and the DFT provides discrete samples of one cycle. If the original sequence is one cycle of a periodic function, the DFT provides all the non-zero values of one DTFT cycle.
What is the Complex Fast Fourier Transform?
The complex Fast Fourier Transform algorithm transforms N real or complex numbers into another N complex numbers. The complex FFT transforms a real or complex signal x in the time domain into a complex two-sided spectrum X in the frequency domain. You must remember that zero frequency corresponds to n = 0, positive frequencies 0 < f < f_c correspond to values 1 ≤ n ≤ N/2 −1, while negative frequencies −fc < f < 0 correspond to N/2 +1 ≤ n ≤ N −1. The value n = N/2 corresponds to both f = f_c and f = −f_c. f_c is the critical or Nyquist frequency with f_c = 1/(2*T) or half the sampling frequency. The first harmonic X corresponds to the frequency 1/(N*T).
The complex FFT requires the list of values (resolution, or N) to be a power 2. If the input size if not a power of 2, then the input data will be padded with zeros to fit the size of the closest power of 2 upward.
What is Real-Fast Fourier Transform?
Has conditions similar to the complex Fast Fourier Transform value, except that the input data must be purely real. If the time series data has the basic type complex64, only the real parts of the complex numbers are used for the calculation. The imaginary parts are silently discarded.
Included
Moving window from Last Bar setting. You can lock the oscillator in place on the current bar by adding 1 every time a new bar appears in the Last Bar Setting

Real-Fast Fourier Transform of Price w/ Linear Regression [Loxx]Real-Fast Fourier Transform of Price w/ Linear Regression is a indicator that implements a Real-Fast Fourier Transform on Price and modifies the output by a measure of Linear Regression. The solid line is the Linear Regression Trend of the windowed data, The green/red line is the Real FFT of price.
What is the Discrete Fourier Transform?
In mathematics, the discrete Fourier transform (DFT) converts a finite sequence of equally-spaced samples of a function into a same-length sequence of equally-spaced samples of the discrete-time Fourier transform (DTFT), which is a complex-valued function of frequency. The interval at which the DTFT is sampled is the reciprocal of the duration of the input sequence. An inverse DFT is a Fourier series, using the DTFT samples as coefficients of complex sinusoids at the corresponding DTFT frequencies. It has the same sample-values as the original input sequence. The DFT is therefore said to be a frequency domain representation of the original input sequence. If the original sequence spans all the non-zero values of a function, its DTFT is continuous (and periodic), and the DFT provides discrete samples of one cycle. If the original sequence is one cycle of a periodic function, the DFT provides all the non-zero values of one DTFT cycle.
What is the Complex Fast Fourier Transform?
The complex Fast Fourier Transform algorithm transforms N real or complex numbers into another N complex numbers. The complex FFT transforms a real or complex signal x in the time domain into a complex two-sided spectrum X in the frequency domain. You must remember that zero frequency corresponds to n = 0, positive frequencies 0 < f < f_c correspond to values 1 ≤ n ≤ N/2 −1, while negative frequencies −fc < f < 0 correspond to N/2 +1 ≤ n ≤ N −1. The value n = N/2 corresponds to both f = f_c and f = −f_c. f_c is the critical or Nyquist frequency with f_c = 1/(2*T) or half the sampling frequency. The first harmonic X corresponds to the frequency 1/(N*T).
The complex FFT requires the list of values (resolution, or N) to be a power 2. If the input size if not a power of 2, then the input data will be padded with zeros to fit the size of the closest power of 2 upward.
What is Real-Fast Fourier Transform?
Has conditions similar to the complex Fast Fourier Transform value, except that the input data must be purely real. If the time series data has the basic type complex64, only the real parts of the complex numbers are used for the calculation. The imaginary parts are silently discarded.
Inputs:
src = source price
uselreg = whether you wish to modify output with linear regression calculation
Windowin = windowing period, restricted to powers of 2: "4", "8", "16", "32", "64", "128", "256", "512", "1024", "2048"
Treshold = to modified power output to fine tune signal
dtrendper = adjust regression calculation
barsback = move window backward from bar 0
mutebars = mute bar coloring for the range
Further reading:
Real-valued Fast Fourier Transform Algorithms IEEE Transactions on Acoustics, Speech, and Signal Processing, June 1987
Related indicators utilizing Fourier Transform
Fourier Extrapolator of Variety RSI w/ Bollinger Bands
Fourier Extrapolation of Variety Moving Averages
Fourier Extrapolator of Price w/ Projection Forecast
