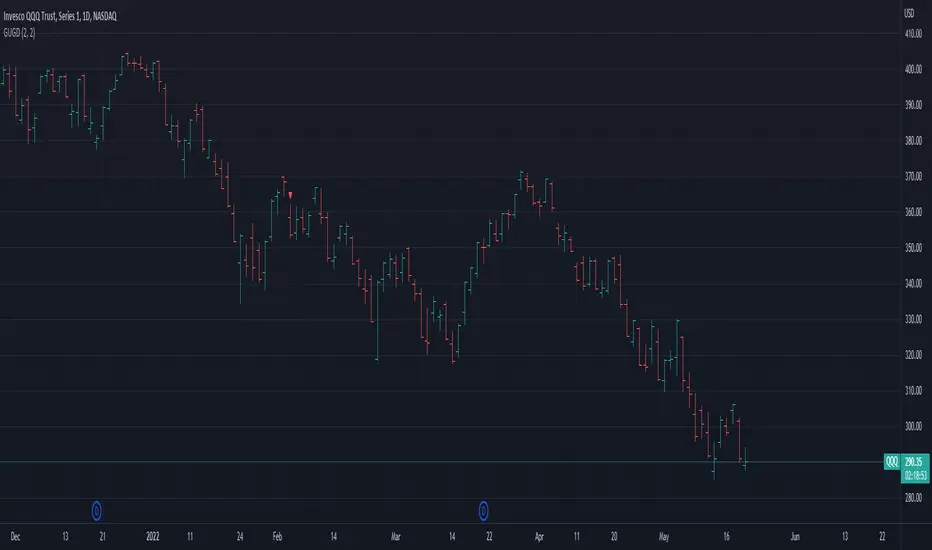
[AN] GapierA colored gap finder.
It colors a gap until it gets closed. It displays an info for the current opened gaps (range).
Allows to change the gap timeframe
Allows you to overlay gaps of other symbol on the current one
There are some assets that really like to fill the gaps. Using this indicator you can have a better understanding on where the price is heading (on the current trend).
Gap

Gap Up and Gap DownIdentify gap ups and downs by percentage and amount.
Set alerts for:
Gap up/down by %
Gap up/down by $
Piercing Line Pattern Trading Setupthis study is the first one of a series of scripts based on the candlesticks pattern which will be published over time. There are several such scripts out there that can be found on TradingView but they seem to be inaccurate with a lot of noises and messy hard to understand code. In this script, I've tried to have a clean and easy to get
of the pattern itself and the method for detecting it with enough parameters to filter out the noises.
Piercing Pattern
A piercing pattern is a technical trading signal that is formed by a closing down day with a good-sized trading range, followed by a trading gap lower the following day with a bullish candlestick that covers at least half of the upward length of the previous day's bearish candlestick body, finishing with a close higher for the day. A piercing pattern often signals the end of a small to moderate downward trend. A piercing pattern can serve as a potential indicator for a bullish reversal. This pattern is formed by two consecutive candlestick marks. The first candlestick is bearish signifying a down day and the second is bullish signifying an up day. When a trader is watching for a bullish reversal any red candlestick followed by a green candlestick could be an alert. There are a few things that set a piercing pattern apart from a general red candlestick green candlestick pattern. In a piercing pattern, a green candlestick follows a red one with a significant gap in the red candlestick close and green candlestick open. On the second-day green candlestick, the candlestick’s body must also lengthen to cover at least half of the previous day’s red candlestick . Generally, the gap down and substantial increase to the closing price are good signs for a reversal. In a piercing pattern, the second-day green candlestick will close at or above the midpoint of the previous day’s red candlestick.
please provide me with your valuable comments,
thanks for your attention,

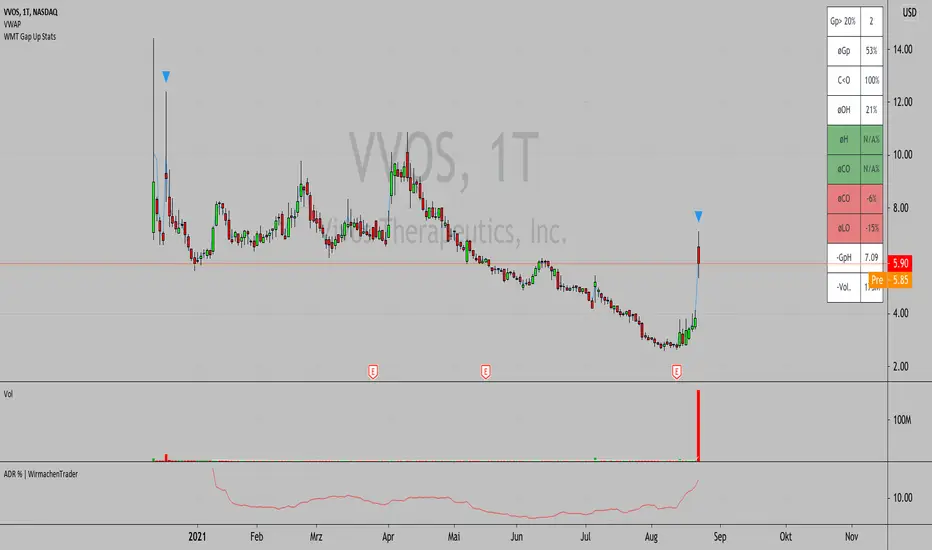
Gap Up Stats - Gap Strategie für Aktien! Was passiert eigentlich nach einem X% Gap? Diese Frage lässt sich nun einfach beantworten! Ändere die % und die Anzahl der Jahre, welche Du testen möchtest mit nur einem Klick. Die unterschiedlichen Werte zeigen Dir dann direkt, ob sich Deine Handelsthese mit den Statistiken der Aktie deckt.
In diesem Fall sehen wir, dass die Aktie über das letzte Jahr in allen Fällen unter dem Eröffnungspreis geschlossen hat. Der durchschnittliche Spike lag bei 16%. Damit ist ein Short die richtige Wahl und die potentiellen Level der Aktie können mit der Statistik vereint werden.
Bei Interesse ist dieses Skript bei uns erhältlich.
Viele Grüße
WirmachenTrader®
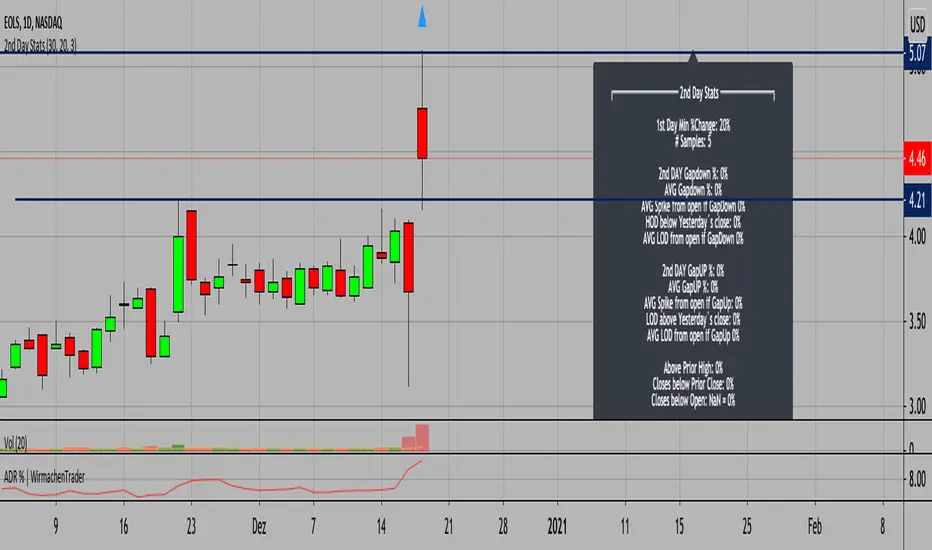
2nd Day Stats / BACKTESTING TOOL//English version below
## Deutsche Version
Was passiert am 2. Tag, nachdem wir X % am ersten Tag zurückgelegt haben? Genau dies lässt sich sehr gut backtesten und die Erkenntnisse im Markt anwenden. Dieses Tool eignet sich besonders für kleinere Aktien (Small-Caps) oder Aktien, die am Tag der Quartalszahlen große Bewegungen zurückgelegt haben. Backtesting war selten so einfach.
## English version
What happens after a strong day 1 move? Use the custom input to test, what happened after a 10% move on day one. Change the day 1 move % and the number of years to backtest. It's that simple. The tool is especially helpful for small-cap traders and for stocks after earnings.
Wirmchen 2nd Day StatsThis is a stats script for calculating gaps and opportunities to trade them in the market
requested by user felhvbn

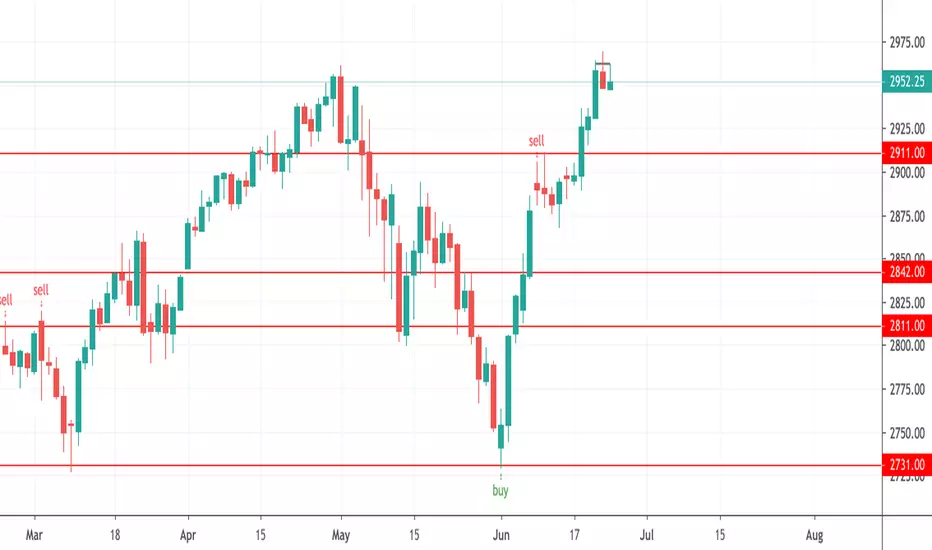
WhiplashClimax setup looking for a reversal the next day after a gap, this works best if the signal is triggered after a prolonged move in one direction. Enter the position at the close of the day when you get a signal and exit for a loss the next day if not profitable, otherwise, trail a stop to lock profits.
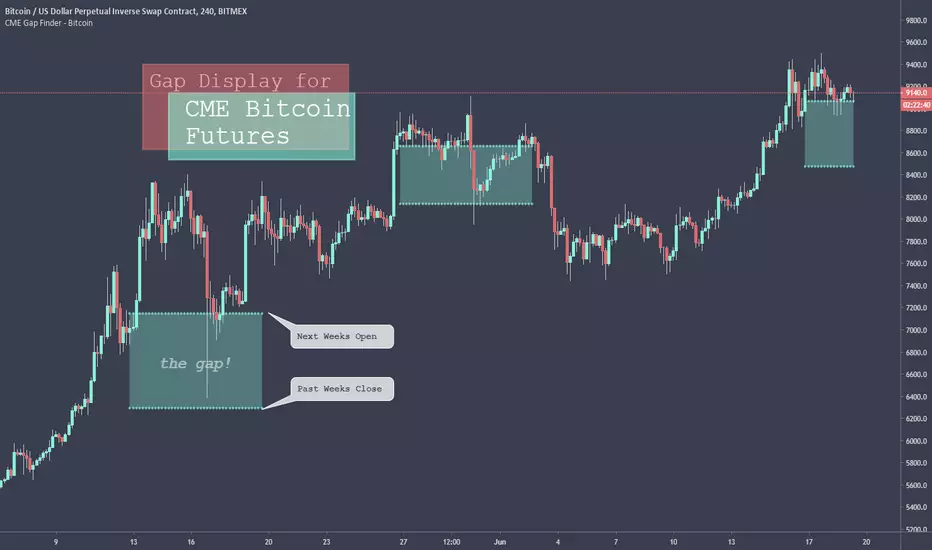
CME Gap Finder - BitcoinOnly for Bitcoin!
This indicator locates weekly gaps created by the CME Futures market for Bitcoin.
As you can see, Bitcoin tends to close the weekly gaps created in the futures market so I thought this could be a very useful tool.
Instead of having to look between multiple charts, this simply overlays the past weeks open and close should a gap appear.
I hope you find this indicator useful!
Cheers!
Crypto GapCrypto trade 24 hours a day, so there is no real gap.
But the gap is a price area actually where nobody or very few people trade.
This script marks all those areas on your chart.
You'd better use the daily chart and change the marked candle color same as your chart background color, then you'll see the magic.

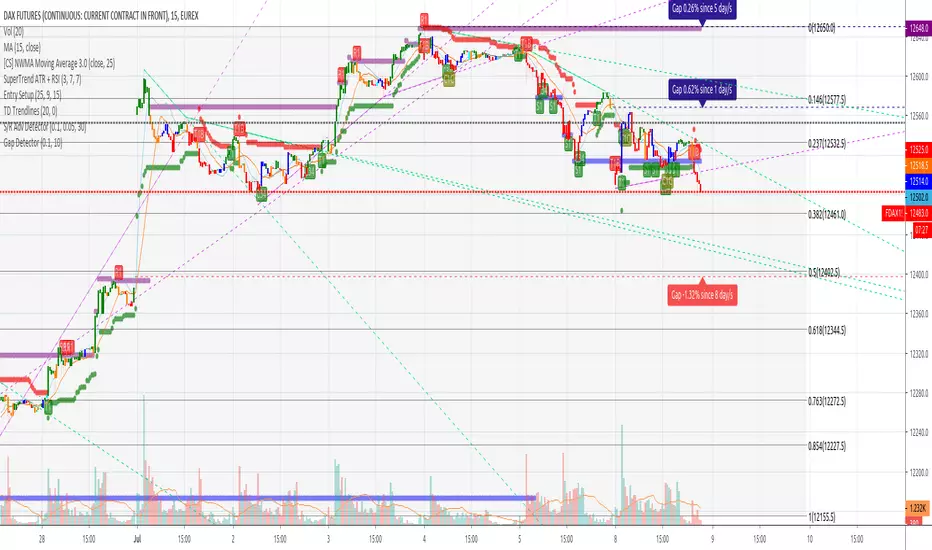
Gap Trader
Plot the most recent 20 gaps based on custom session info.
The session can be customized with a start time and an end time.
The previous open, high, low, close are only from the price during the session specified.
A gap line will stop printing the moment the gap is filled.
For CME futures, the session must be offset by one hour for Central time. I use the official cash close of 16:15 EST (yes, not 16:00) as this is the TRUE close when options go offline. Every day CME futures take a break between 16:15 - 16:30 EST for settlement, and then again from 17:00 - 18:00 EST.
To offset CME futures you must subtract an hour, the official NYSE hours for futures: 0830-1515, this translates to 9:30 AM EST - 4:15 PM EST.
For information about the probability of a previous day's gap being filled by the NYSE close: www.investiquant.com


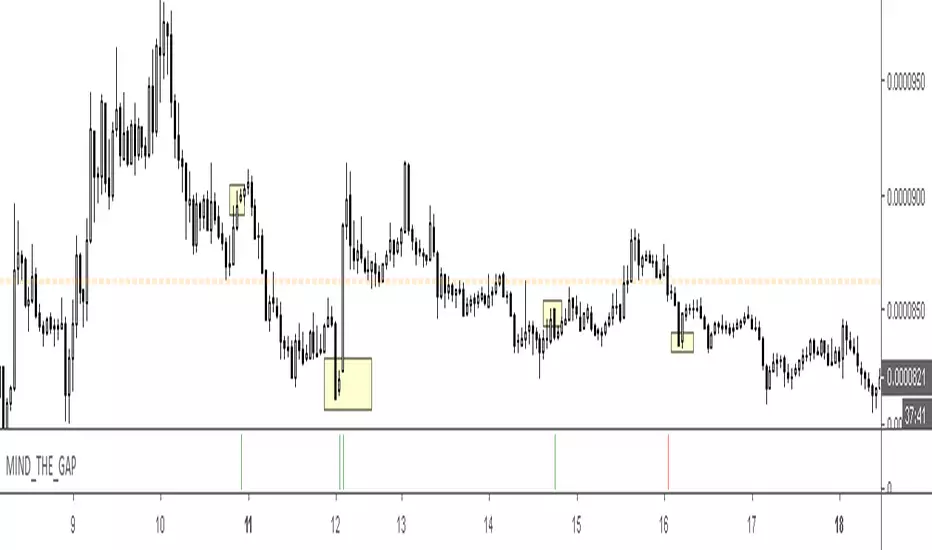
MIND_THE_GAP: Locate gaps on all time frames. Alerts enabled. • Identify gaps on all time frames
• Ability to set gap sensitivity
• Daily gaps overlaid on intra-day time frames
• Horizontal bars indicate gap on the current time frame
• Circles indicate gap on the daily time frame
• Alerts enabled
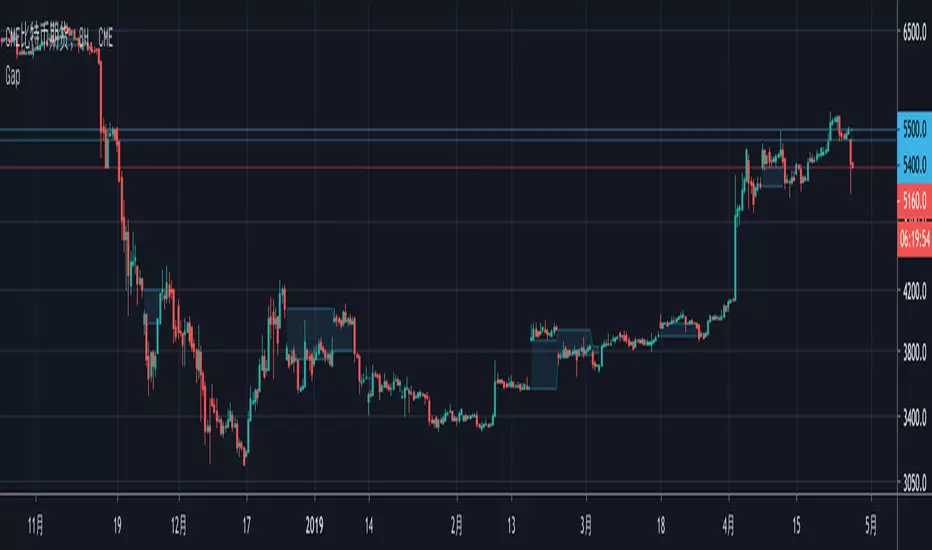
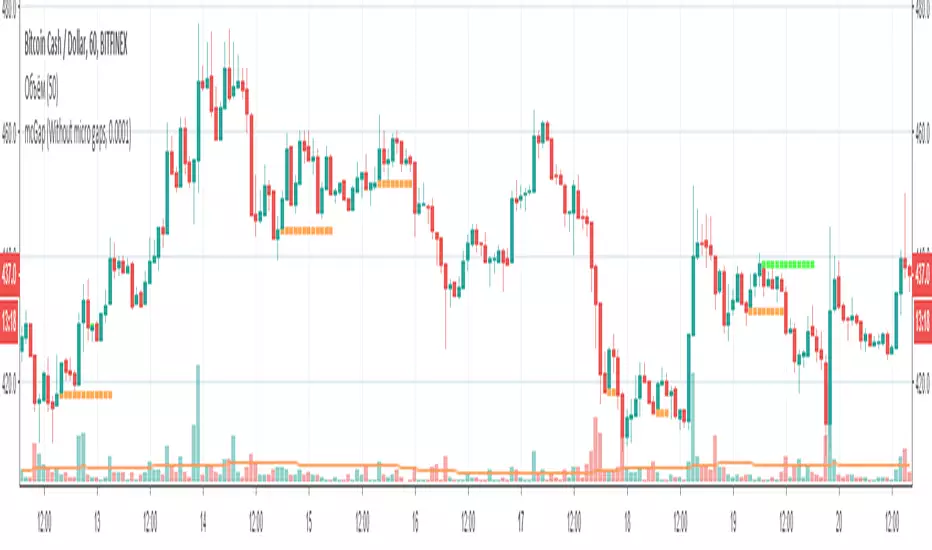
Gap-O-MaticGap-O-Matic checks whether there is a gap in a user-defined security or symbol and gives you alerts, targets for the gap and tracks the gap until it has been filled. In addition, you can disable or show plots, and change the gap threshhold to pick how big of gaps you want Gap-O-Matic to alert you to and which it should ignore.
A good use case, for example, is to use Gap-O-Matic to monitor a CME/CBOE such as "BTC1!" while trading a bitmex chart. You wont need to check or chart out gap areas. Gap-O-Matic will automatically draw in the gaps on your chart for you.

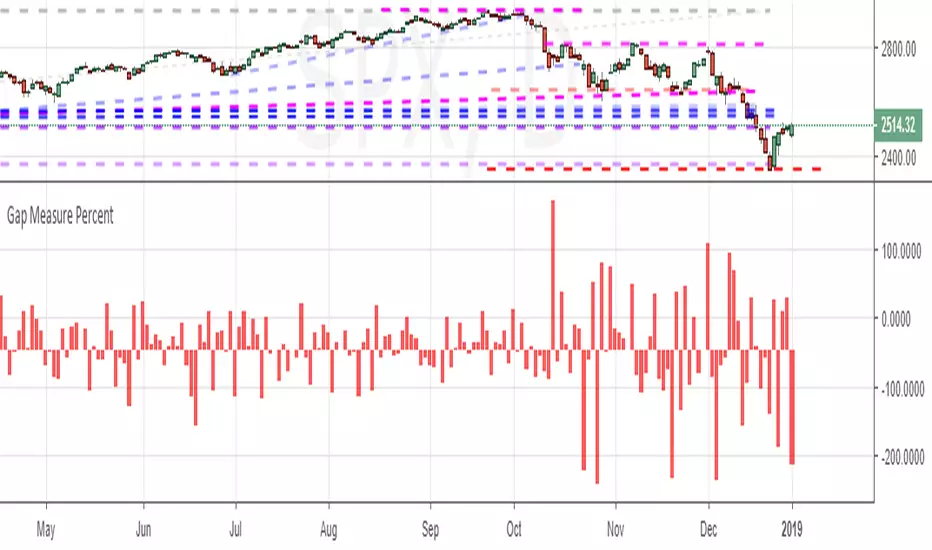
Gap Measure PercentMeasures the gaps between bars - bullish or bearish - as a percent of the underlying's price.

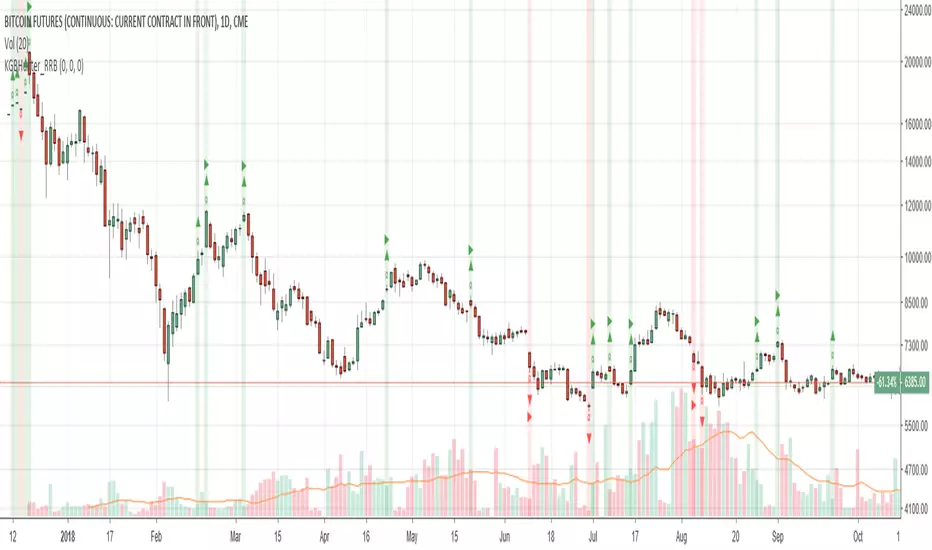
Katana Gaps Bounty Hunter (Show Gaps Counter) by RRBKatana Gaps Bounty Hunter (KGB_Hunter) by RagingRocketBull 2018
Version 1.0
This indicator shows/counts/filters gaps on a chart
There are several versions: Simple, Pro and Zones. This is the Simple version. The Differences are listed below.
- Simple: shows/counts gaps, changes color based on gap dir (2 colors), filters out price gaps within session, large gaps, and high volume gaps
- Pro: +shows all types of gaps, multi color, more filters (time gaps, doji, etc)
- Zones: +shows gaps as dynamic horiz zones
Features:
- highlights gaps using barcolor and plotchar chars (2 colors x 2 dirs)
- can show/hide gaps/chars based on gap dir
- changes color of gaps/chars based on gap dir
- displays chars above/below bar based on gap dir
- can filter out price gaps, large gaps, and high volume gaps
- counts all filtered gaps
Good Luck! Feel free to reuse the code and make it your own
My Closed Gap v.1.1 by WentalThe indicator draws a line when the gap is open and stops drawing it when the gap is closed. The length of the line is limited. The indicator has four modes of operation, you can adjust it depending on the instrument and personal preferences.
v.1.1 - fixed code, added alert to the appearance of the gap, the increased maximum line length.
Индикатор рисует линию, когда гэп открыт и перестаёт её рисовать, когда гэп закрывается. Длина линии ограничена. Индикатор имеет четыре режима работы, вы можете настроить его в зависимости от инструмента и личных предпочтений.
v.1.1 - подправлен код, добавлены оповещения при появлении гэпа, увеличена максимальная длина линии.
Strength Candles With GapCode written by Krishna Khanna on 20/11/2017 includes the following components for NimblrTA
1) Logic for detection of strength candles, only displayed candles are of strength (BH>50%CH)
2) Wicks are not considered
3) Any Gaps are indicated with a arrow, can detect gapup and gapdown
This indicator is apt for small screen devices

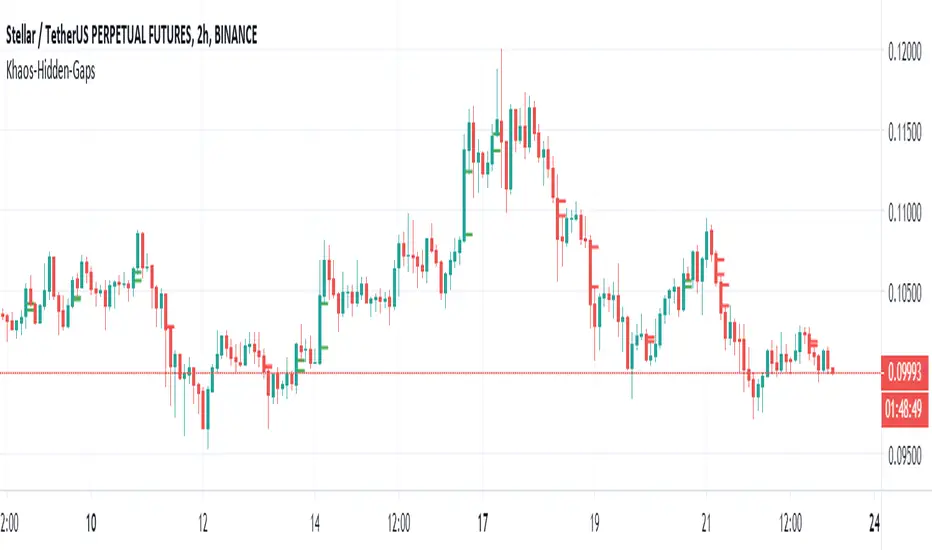
Khaos-Hidden-Gaps
This is an indicator that shows Hidden Gaps. It will assist when looking for support and resistance levels, as well as help in understanding trend, thereby improving trading performance.
LEGAL STUFF:
Risk Disclosure
Futures , forex, stock, crypto and derivative trading contains substantial risk and is not for every investor. An investor could potentially lose all or more than the initial investment. Risk capital is money that can be lost without jeopardizing ones’ financial security or life style. Only risk capital should be used for trading and only those with sufficient risk capital should consider trading. Past performance is not necessarily indicative of future results
Hypothetical Performance Disclosure
Hypothetical performance results have many inherent limitations, some of which are described below. no representation is being made that any account will or is likely to achieve profits or losses similar to those shown; in fact, there are frequently sharp differences between hypothetical performance results and the actual results subsequently achieved by any particular trading program. One of the limitations of hypothetical performance results is that they are generally prepared with the benefit of hindsight. In addition, hypothetical trading does not involve financial risk, and no hypothetical trading record can completely account for the impact of financial risk of actual trading. for example, the ability to withstand losses or to adhere to a particular trading program in spite of trading losses are material points which can also adversely affect actual trading results. There are numerous other factors related to the markets in general or to the implementation of any specific trading program which cannot be fully accounted for in the preparation of hypothetical performance results and all which can adversely affect trading results
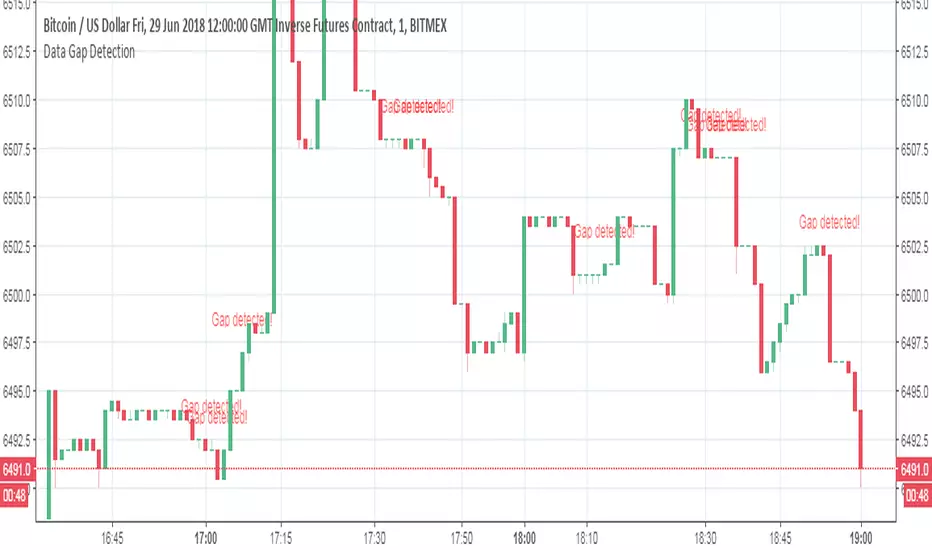
Data Gap DetectionThis simple script checks for data gaps in an intra-day TradingView chart. I have found that BitMEX 1-minute data is coming in rather holey lately, so I wrote this just to see how prevalent the problem is. It should work on any intra-day timeframe, not just 1-minute.
V1: initial release.
Gap finder (gold minds)This tool highlights where gaps happens and outlines in the chart where the gap zones are. If there is a gap up there is a green line, a gap down it is red. The gap zone is highlighted in blue. You can choose the size of your gap with the input menu to the desired size. Feel free to ask comment below. Made for the Gold Minds group
