RTH Session Range Position (0-100) with EMAA Pine Script indicator designed to help traders understand where the current price is located within the Regular Trading Hours (RTH) session range, from 0 (session low) to 100 (session high). It also plots a smoothed EMA of this position to provide insight into momentum or trend during the RTH session.
What the Indicator Does
Defines RTH (Regular Trading Hours):
Start: 9:30 AM
End: 4:00 PM
These are typical US equity market hours.
Tracks the session's high and low during RTH:
sessionHigh and sessionLow update only during RTH.
Calculates position of the current price within the RTH range:
Formula: ((close - sessionLow) / (sessionHigh - sessionLow)) * 100
Result is a percentage:
0 = at session low
100 = at session high
50 = middle of session range
Calculates an EMA of that position (posEMA):
Smooths out the raw position to help visualize momentum within the range.
Plots and table:
Plots pos and posEMA on a separate chart pane.
Adds horizontal lines at key levels (0, 30, 50, 70, 100).
Table shows current values for Position, EMA, and Range.
Visual cues:
bgcolor highlights when pos crosses over or under the EMA — potential momentum shifts.
Alerts:
Cross above/below 50 (session midpoint).
Cross above/below EMA.
How to Use It Effectively
1. Session Strength & Momentum
Position above 70: Price is near session highs — strong upward momentum.
Position below 30: Price is near session lows — strong downward momentum.
Use the EMA of position to filter out noise and identify trends.
2. Breakout or Reversal Detection
Cross above EMA: Momentum may be turning bullish.
Cross below EMA: Momentum may be turning bearish.
These crosses (especially near mid-levels like 50) can hint at session trend shifts.
3. Range Context for Entries
If you're a mean-reversion trader, look for:
Price > 70 + turning down below EMA → possible short.
Price < 30 + turning up above EMA → possible long.
For breakout traders, you might wait for:
Crosses above 70 with EMA support.
Crosses below 30 with EMA resistance.
4. Confirmation Tool
Use this indicator alongside others to confirm:
Whether price action has strength within the day.
Whether breakouts have real momentum or are extended already.
مؤشر أعلى وأدنى سعر

RTH Session Highs & LowsA Pine Script indicator designed to track and plot the Regular Trading Hours (RTH) session highs and lows on a chart, typically for U.S. equity markets (e.g., S&P 500, Nasdaq, etc.), which operate from 9:30 AM to 4:00 PM Eastern Time.
Session High & Low Lines:
During the RTH session, the indicator draws green and red horizontal lines that represent the highest and lowest price seen so far within that trading session.
These levels help traders identify intraday support (low) and resistance (high) levels.
New High/Low Markers:
Small triangle markers are placed:
Above the bar when a new intraday high is made (green triangle).
Below the bar when a new intraday low is made (red triangle).
This visually flags when momentum may be building or reversing.
Intraday Strategy Support:
Use the session high/low as dynamic support/resistance for scalping or breakout strategies.
For example:
Breakouts above session highs may indicate bullish strength.
Breakdowns below session lows may suggest bearish momentum.
Mean Reversion Tactics:
Prices approaching these lines and then rejecting can be used for mean reversion setups.
Combine with volume or candlestick patterns for confirmation.
Risk Management:
Set stops or targets relative to session highs/lows.
For instance, use session high as a stop-loss level in a short position.
Volatility Gauge:
Tracking how frequently new highs/lows are formed can help assess intraday volatility or range expansion.
Complement with Indicators:
Combine this with our "McGinley Dynamic Channel with Directional Shading" indicator or our "EMA Crossover with Shading" indicator to add context to breakouts or rejections.

HMA 200 + EMA 20 Crossover StrategyThis strategy combines a long-term trend filter using the Hull Moving Average (HMA 200) with a short-term entry trigger using the Exponential Moving Average (EMA 20).
📈 Entry Logic:
Buy Entry: When price is above the HMA 200 and crosses above the EMA 20.
Sell Entry: When price is below the HMA 200 and crosses below the EMA 20.
The strategy closes the current position and reverses on the opposite signal.
⚙️ Strategy Settings (Backtest Configuration):
Position size: 10% of equity per trade
Commission: 0.1% per trade (to simulate broker fees)
Slippage: 2 ticks (to reflect realistic fill conditions)
✅ Purpose:
This script is designed to identify high-probability trades in the direction of the overall trend, avoiding whipsaw conditions. It is useful for traders looking for a dynamic crossover-based system that filters trades based on longer-term momentum.
🔎 Make sure to test across multiple assets and timeframes. For best results, apply this strategy to liquid trending markets like major FX pairs, indices, or high-cap stocks.

Current Fractal High/Low (Dynamic)
This indicator dynamically tracks the most recent confirmed Fractal High and Fractal Low across any timeframe using custom left/right bar configurations.
🔍 Key Features:
Detects Fractal Highs and Lows based on user-defined pivot settings.
Draws a green line and label ("FH") at the most recent Fractal High.
Draws a red line and label ("FL") at the most recent Fractal Low.
All lines extend from the confirmation bar to the current candle.
Automatically removes old lines and labels for a clean, uncluttered chart.
🛠️ Customizable Inputs:
Left & Right bars for pivot sensitivity
Line width for visibility
📌 Use Cases:
Identifying structure shifts
Recognizing key swing points
Supporting liquidity and breakout strategies
💡 Fractals are confirmed only after the full formation of the pattern (left and right bars). This ensures reliability over reactivity.
This script is designed for intraday to swing traders who want a reliable way to visualize market turning points with minimal noise.

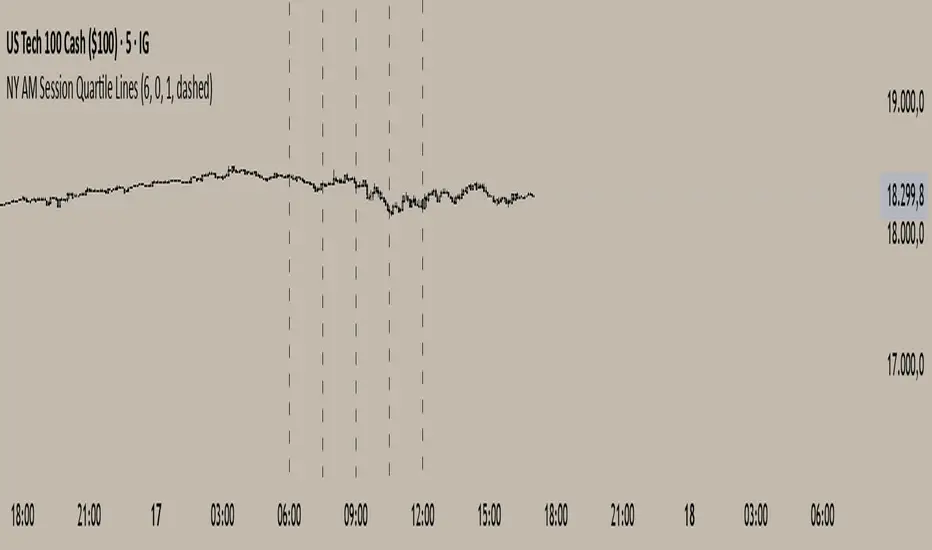
NY AM Session Quartile LinesNY AM Session Quartile Lines
This script automatically divides the New York AM session (6:00 AM to 12:00 PM NY time) into four clear quartiles.
It helps traders visualize the market structure by marking each new quartile with customizable vertical lines.
🔹 Features:
Configurable session start time (NY time).
Adjustable line color, width, and style (solid, dashed, or dotted).
Clean, lightweight design that fits any trading style.
Works across all instruments and timeframes that cover the NY session.
🔹 Perfect for:
Intraday traders who focus on New York session dynamics.
Identifying accumulation, manipulation, and distribution phases across the session.
Structuring the AM session into logical market segments for better planning and analysis.
🎯 Default Settings:
Start Hour: 6:00 AM NY
Line Style: Dashed
Line Color: Black
Line Width: 2
Multi Oscillator OB/OS Signals v3 - Scope TestIndicator Description: Multi Oscillator OB/OS Signals
Purpose:
The "Multi Oscillator OB/OS Signals" indicator is a TradingView tool designed to help traders identify potential market extremes and momentum shifts by monitoring four popular oscillators simultaneously: RSI, Stochastic RSI, CCI, and MACD. Instead of displaying these oscillators in separate panes, this indicator plots distinct visual symbols directly onto the main price chart whenever specific predefined conditions (typically related to overbought/oversold levels or line crossovers) are met for each oscillator. This provides a consolidated view of potential signals from these different technical tools.
How It Works:
The indicator calculates the values for each of the four oscillators based on user-defined settings (like length periods and price sources) and then checks for specific signal conditions on every bar:
Relative Strength Index (RSI):
It monitors the standard RSI value.
When the RSI crosses above the user-defined Overbought (OB) level (e.g., 70), it plots an "Overbought" symbol (like a downward triangle) above that price bar.
When the RSI crosses below the user-defined Oversold (OS) level (e.g., 30), it plots an "Oversold" symbol (like an upward triangle) below that price bar.
Stochastic RSI:
This works similarly to RSI but is based on the Stochastic calculation applied to the RSI value itself (specifically, the %K line of the Stoch RSI).
When the Stoch RSI's %K line crosses above its Overbought level (e.g., 80), it plots its designated OB symbol (like a downward arrow) above the bar.
When the %K line crosses below its Oversold level (e.g., 20), it plots its OS symbol (like an upward arrow) below the bar.
Commodity Channel Index (CCI):
It tracks the CCI value.
When the CCI crosses above its Overbought level (e.g., +100), it plots its OB symbol (like a square) above the bar.
When the CCI crosses below its Oversold level (e.g., -100), it plots its OS symbol (like a square) below the bar.
Moving Average Convergence Divergence (MACD):
Unlike the others, MACD signals here are not based on fixed OB/OS levels.
It identifies when the main MACD line crosses above its Signal line. This is considered a bullish crossover and is indicated by a specific symbol (like an upward label) plotted below the price bar.
It also identifies when the MACD line crosses below its Signal line. This is a bearish crossover, indicated by a different symbol (like a downward label) plotted above the price bar.
Visualization:
All these signals appear as small, distinct shapes directly on the price chart at the bar where the condition occurred. The shapes, their colors, and their position (above or below the bar) are predefined for each signal type to allow for quick visual identification. Note: In the current version of the underlying code, the size of these shapes is fixed (e.g., tiny) and not user-adjustable via the settings.
Configuration:
Users can access the indicator's settings to customize:
The calculation parameters (Length periods, smoothing, price source) for each individual oscillator (RSI, Stoch RSI, CCI, MACD).
The specific Overbought and Oversold threshold levels for RSI, Stoch RSI, and CCI.
The colors associated with each type of signal (OB, OS, Bullish Cross, Bearish Cross).
(Limitation Note: While settings exist to toggle the visibility of signals for each oscillator individually, due to a technical workaround in the current code, these toggles may not actively prevent the shapes from plotting if the underlying condition is met.)
Alerts:
The indicator itself does not automatically generate pop-up alerts. However, it creates the necessary "Alert Conditions" within TradingView's alert system. This means users can manually set up alerts for any of the specific signals generated by the indicator (e.g., "RSI Overbought Enter," "MACD Bullish Crossover"). When creating an alert, the user selects this indicator, chooses the desired condition from the list provided by the script, and configures the alert actions.
Intended Use:
This indicator aims to provide traders with convenient visual cues for potential over-extension in price (via OB/OS signals) or shifts in momentum (via MACD crossovers) based on multiple standard oscillators. These signals are often used as potential indicators for:
Identifying areas where a trend might be exhausted and prone to a pullback or reversal.
Confirming signals generated by other analysis methods or trading strategies.
Noting shifts in short-term momentum.
Disclaimer: As with any technical indicator, the signals generated should not be taken as direct buy or sell recommendations. They are best used in conjunction with other forms of analysis (price action, trend analysis, volume, fundamental analysis, etc.) and within the framework of a well-defined trading plan that includes risk management. Market conditions can change, and indicator signals can sometimes be false or misleading.

ICT & SMC Multi-Timeframe by [KhedrFX]Transform your trading experience with the ICT & SMC Multi-Timeframe by indicator. This innovative tool is designed for traders who want to harness the power of multi-timeframe analysis, enabling them to make informed trading decisions based on key market insights. By integrating concepts from the Inner Circle Trader (ICT) and Smart Money Concepts (SMC), this indicator provides a comprehensive view of market dynamics, helping you identify potential trading opportunities with precision.
Key Features
- Multi-Timeframe Analysis: Effortlessly switch between various timeframes (5 minutes, 15 minutes, 30 minutes, 1 hour, 4 hours, daily, and weekly) to capture the full spectrum of market movements.
- High and Low Levels: Automatically calculates and displays the highest and lowest price levels over the last 20 bars, highlighting critical support and resistance zones.
- Market Structure Visualization: Identifies the last swing high and swing low, allowing you to recognize current market trends and potential reversal points.
- Order Block Detection: Detects significant order blocks, pinpointing areas of strong buying or selling pressure that can indicate potential market reversals.
- Custom Alerts: Set alerts for when the price crosses above or below identified order block levels, enabling you to act swiftly on trading opportunities.
How to Use the Indicator
1. Add the Indicator to Your Chart
- Open TradingView.
- Click on the "Indicators" button at the top of the screen.
- Search for "ICT & SMC Multi-Timeframe by " in the search bar.
- Click on the indicator to add it to your chart.
2. Select Your Timeframe
- Use the dropdown menu to choose your preferred timeframe (5, 15, 30, 60, 240, D, W) for analysis.
3. Interpret the Signals
- High Level (Green Line): Represents the highest price level over the last 20 bars, acting as a potential resistance level.
- Low Level (Red Line): Represents the lowest price level over the last 20 bars, acting as a potential support level.
- Last Swing High (Blue Cross): Indicates the most recent significant high, useful for identifying potential reversal points.
- Last Swing Low (Orange Cross): Indicates the most recent significant low, providing insight into market structure.
- Order Block High (Purple Line): Marks the upper boundary of a detected order block, suggesting potential selling pressure.
- Order Block Low (Yellow Line): Marks the lower boundary of a detected order block, indicating potential buying pressure.
4. Set Alerts
- Utilize the alert conditions to receive notifications when the price crosses above or below the order block levels, allowing you to stay informed about potential trading opportunities.
5. Implement Risk Management
- Always use proper risk management techniques. Consider setting stop-loss orders based on the identified swing highs and lows or the order block levels to protect your capital.
Conclusion
The ICT & SMC Multi-Timeframe by indicator is an essential tool for traders looking to enhance their market analysis and decision-making process. By leveraging multi-timeframe insights, market structure visualization, and order block detection, you can navigate the complexities of the market with confidence. Start using this powerful indicator today and take your trading to the next level.
⚠️ Trade Responsibly
This tool helps you analyze the market, but it’s not a guarantee of profits. Always do your own research, manage risk, and trade with caution.

BTC Trading RobotOverview
This Pine Script strategy is designed for trading Bitcoin (BTC) by placing pending orders (BuyStop and SellStop) based on local price extremes. The script also implements a trailing stop mechanism to protect profits once a position becomes sufficiently profitable.
________________________________________
Inputs and Parameter Setup
1. Trading Profile:
o The strategy is set up specifically for BTC trading.
o The systemType input is set to 1, which means the strategy will calculate trade parameters using the BTC-specific inputs.
2. Common Trading Inputs:
o Risk Parameters: Although RiskPercent is defined, its actual use (e.g., for position sizing) isn’t implemented in this version.
o Trading Hours Filter:
SHInput and EHInput let you restrict trading to a specific hour range. If these are set (non-zero), orders will only be placed during the allowed hours.
3. BTC-Specific Inputs:
o Take Profit (TP) and Stop Loss (SL) Percentages:
TPasPctBTC and SLasPctBTC are used to determine the TP and SL levels as a percentage of the current price.
o Trailing Stop Parameters:
TSLasPctofTPBTC and TSLTgrasPctofTPBTC determine when and by how much a trailing stop is applied, again as percentages of the TP.
4. Other Parameters:
o BarsN is used to define the window (number of bars) over which the local high and low are calculated.
o OrderDistPoints acts as a buffer to prevent the entry orders from being triggered too early.
________________________________________
Trade Parameter Calculation
• Price Reference:
o The strategy uses the current closing price as the reference for calculations.
• Calculation of TP and SL Levels:
o If the systemType is set to BTC (value 1), then:
Take Profit Points (Tppoints) are calculated by multiplying the current price by TPasPctBTC.
Stop Loss Points (Slpoints) are calculated similarly using SLasPctBTC.
A buffer (OrderDistPoints) is set to half of the take profit points.
Trailing Stop Levels:
TslPoints is calculated as a fraction of the TP (using TSLTgrasPctofTPBTC).
TslTriggerPoints is similarly determined, which sets the profit level at which the trailing stop will start to activate.
________________________________________
Time Filtering
• Session Control:
o The current hour is compared against SHInput (start hour) and EHInput (end hour).
o If the current time falls outside the allowed window, the script will not place any new orders.
________________________________________
Entry Orders
• Local Price Extremes:
o The strategy calculates a local high and local low using a window of BarsN * 2 + 1 bars.
• Placing Stop Orders:
o BuyStop Order:
A long entry is triggered if the current price is less than the local high minus the order distance buffer.
The BuyStop order is set to trigger at the level of the local high.
o SellStop Order:
A short entry is triggered if the current price is greater than the local low plus the order distance buffer.
The SellStop order is set to trigger at the level of the local low.
Note: Orders are only placed if there is no current open position and if the session conditions are met.
________________________________________
Trailing Stop Logic
Once a position is open, the strategy monitors profit levels to protect gains:
• For Long Positions:
o The script calculates the profit as the difference between the current price and the average entry price.
o If this profit exceeds the TslTriggerPoints threshold, a trailing stop is applied by placing an exit order.
o The stop price is set at a distance below the current price, while a limit (profit target) is also defined.
• For Short Positions:
o The profit is calculated as the difference between the average entry price and the current price.
o A similar trailing stop exit is applied if the profit exceeds the trigger threshold.
________________________________________
Summary
In essence, this strategy works by:
• Defining entry levels based on recent local highs and lows.
• Placing pending stop orders to enter the market when those levels are breached.
• Filtering orders by time, ensuring trades are only taken during specified hours.
• Implementing a trailing stop mechanism to secure profits once the trade moves favorably.
This approach is designed to automate BTC trading based on price action and dynamic risk management, although further enhancements (like dynamic position sizing based on RiskPercent) could be added for a more complete risk management system.

Open Range Volatility (High/Low %)Overview
The Open-to-High/Low Movement Indicator helps traders visualize the percentage change between the opening price and the highest & lowest points of each trading session. This indicator is particularly useful for identifying intraday volatility, momentum strength, and potential reversals.
Key Features
✅ Real-Time High/Low Percentage Movement – Calculates and plots the percentage movement from the opening price to both the session high (green line) and session low (red line).
✅ Separate Chart Pane – Keeps your main price chart clean while displaying movements in a separate panel.
✅ Zero Reference Line – Helps distinguish upward and downward movements.
✅ +10% and -10% Threshold Lines – Assists in identifying significant price swings.
✅ Customizable & Lightweight – Efficiently tracks market movements without slowing down your chart.
How to Use
When the green line moves higher, it indicates strong buying pressure after the open.
When the red line moves lower, it shows selling pressure from the open price.
If movements stay within a small range, the market is experiencing low volatility.
Extreme movements beyond ±10% can indicate potential breakout or reversal zones.
Best for:
📈 Day traders tracking intraday momentum
📊 Swing traders spotting volatility trends
⚡ Scalpers identifying quick price movements
💡 Volatility-based strategies
This indicator works across all timeframes and asset classes, including stocks, forex, commodities, and crypto.
🚀 Add this to your chart today and stay ahead of the market!

Arbitrage Spot-Futures Don++Strategy: Spot-Futures Arbitrage Don++
This strategy has been designed to detect and exploit arbitrage opportunities between the Spot and Futures markets of the same trading pair (e.g. BTC/USDT). The aim is to take advantage of price differences (spreads) between the two markets, while minimizing risk through dynamic position management.
[Operating principle
The strategy is based on calculating the spread between Spot and Futures prices. When this spread exceeds a certain threshold (positive or negative), reverse positions are opened simultaneously on both markets:
- i] Long Spot + Short Futures when the spread is positive.
- i] Short Spot + Long Futures when the spread is negative.
Positions are closed when the spread returns to a value close to zero or after a user-defined maximum duration.
[Strategy strengths
1. Adaptive thresholds :
- Entry/exit thresholds can be dynamic (based on moving averages and standard deviations) or fixed, offering greater flexibility to adapt to market conditions.
2. Robust data management :
- The script checks the validity of data before executing calculations, thus avoiding errors linked to missing or invalid data.
3. Risk limitation :
- A position size based on a percentage of available capital (default 10%) limits exposure.
- A time filter limits the maximum duration of positions to avoid losses due to persistent spreads.
4. Clear visualization :
- Charts include horizontal lines for entry/exit thresholds, as well as visual indicators for spread and Spot/Futures prices.
5. Alerts and logs :
- Alerts are triggered on entries and exits to inform the user in real time.
[Points for improvement or completion
Although this strategy is functional and robust, it still has a few limitations that could be addressed in future versions:
1. [Limited historical data :
- TradingView does not retrieve real-time data for multiple symbols simultaneously. This can limit the accuracy of calculations, especially under conditions of high volatility.
2. [Lack of liquidity management :
- The script does not take into account the volumes available on the order books. In conditions of low liquidity, it may be difficult to execute orders at the desired prices.
3. [Non-dynamic transaction costs :
- Transaction costs (exchange fees, slippage) are set manually. A dynamic integration of these costs via an external API would be more realistic.
4. User-dependency for symbols :
- Users must manually specify Spot and Futures symbols. Automatic symbol validation would be useful to avoid configuration errors.
5. Lack of advanced backtesting :
- Backtesting is based solely on historical data available on TradingView. An implementation with third-party data (via an API) would enable the strategy to be tested under more realistic conditions.
6. [Parameter optimization :
- Certain parameters (such as analysis period or spread thresholds) could be optimized for each specific trading pair.
[How can I contribute?
If you'd like to help improve this strategy, here are a few ideas:
1. Add additional filters:
- For example, a filter based on volume or volatility to avoid false signals.
2. Integrate dynamic costs:
- Use an external API to retrieve actual costs and adjust thresholds accordingly.
3. Improve position management:
- Implement hedging or scalping mechanisms to maximize profits.
4. Test on other pairs:
- Evaluate the strategy's performance on other assets (ETH, SOL, etc.) and adjust parameters accordingly.
5. Publish backtesting results :
- Share detailed analyses of the strategy's performance under different market conditions.
[Conclusion
This Spot-Futures arbitrage strategy is a powerful tool for exploiting price differentials between markets. Although it is already functional, it can still be improved to meet more complex trading scenarios. Feel free to test, modify and share your ideas to make this strategy even more effective!
[Thank you for contributing to this open-source community!
If you have any questions or suggestions, please feel free to comment or contact me directly.

Previous Day, Week, Monday Liq + Asian, London & Ny session LiqGM Gs,
This indicator helps traders identify key liquidity levels from different market sessions (Asian, London, NY), as well as weekly and daily highs/lows. It automatically plots these levels on the chart, making it easier to spot potential support/resistance zones where price might react.
Key Features:
1. Multi-Timeframe Liquidity Zones
Previous Day High/Low – Tracks the prior day’s range.
Monday High/Low – Useful for weekly opening liquidity.
Previous Week High/Low – Helps identify broader weekly levels.
2. Customizable Session Times
Asian, London, and NY Session Highs/Lows – Automatically detects and plots key levels from each trading session.
Adjustable Time Zones – Supports multiple GMT offsets (GMT-8 to GMT+3), making it adaptable for traders worldwide.
3. Visual Customization
Color & Style Options – Each level type (e.g., London High, NY Low) can be customized in color, line style (solid, dashed, dotted), and width.
Faded Opacity for Swept Levels – When a level is swept (price breaks but closes beyond it), it becomes semi-transparent, helping traders distinguish active vs. invalidated levels.
4. Clean & Informative Labels
Each level has a clear label (e.g., "Asia High," "PW Low") for easy identification.
Adjustable label offsets prevent clutter on the chart.
Pros & Benefits for Traders:
✅ Helps Identify Key Liquidity Zones – Institutional traders often target session highs/lows for liquidity grabs. This indicator makes these levels visible at a glance.
✅ Adaptable to Different Trading Styles
Day Traders – Can use Asian/London/NY session levels for intraday setups.
Swing Traders – Can focus on weekly and Monday levels for broader trends.
✅ No Repainting – Levels are fixed once formed and do not change retroactively.
✅ Customizable for Personal Preference – Traders can adjust colors, line styles, and visibility to match their trading setup.
✅ Useful for Multiple Markets – Works well on Forex (major pairs), indices, and even crypto (due to 24/7 market structure similarities).
Suggested Use Cases:
Breakout Trading – Watch for price reactions at session highs/lows.
Mean Reversion – Fade moves into weekly or daily extremes.
Institutional Liquidity Analysis – Identify potential stop hunts or accumulation zones.
Conclusion:
This indicator is a powerful tool for traders who rely on session-based liquidity, institutional order flow, and key support/resistance levels. By automating the detection of these zones, it saves time and helps traders make more informed decisions.

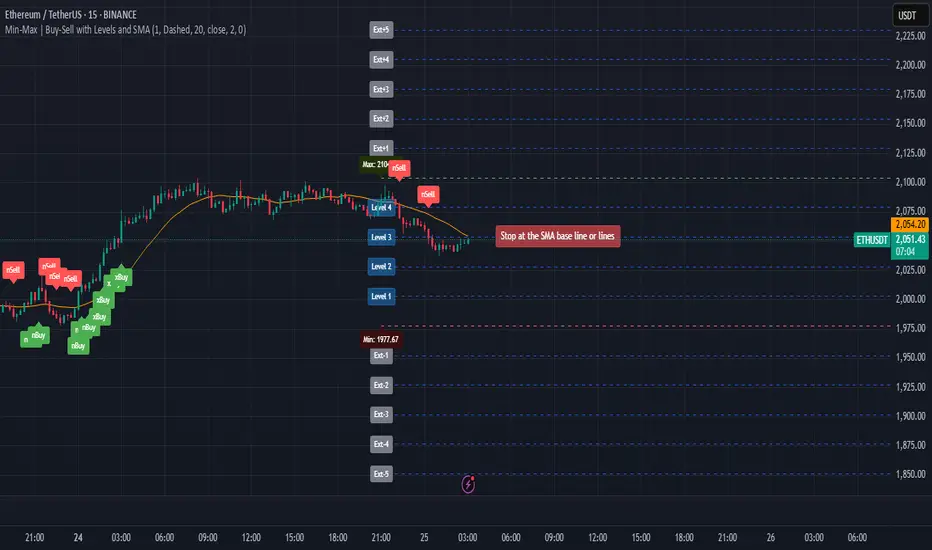
Min-Max | Buy-Sell Alert with LevelsMin-Max | Buy-Sell Alert with Levels
Description:
The Min-Max | Buy-Sell Alert with Levels indicator is a powerful tool designed to help traders identify key levels of support and resistance based on the previous day's high and low prices. It plots horizontal lines for the previous day's minimum (Min) and maximum (Max) prices, along with four intermediate levels (Stop Loss 1 to Stop Loss 4) calculated as equal percentage steps between the Min and Max.
This indicator is perfect for traders who want to:
Identify potential entry points when the price returns within the Min-Max range.
Set stop-loss levels based on the calculated intermediate levels.
Receive alerts for buy, sell, and stop-loss conditions.
Key Features:
Previous Day's Min and Max Lines:
Automatically plots the Min (red line) and Max (green line) of the previous day.
These levels act as dynamic support and resistance zones.
Intermediate Stop Loss Levels:
Calculates and plots four intermediate levels (Stop Loss 1 to Stop Loss 4) between the Min and Max.
Each level is equally spaced, representing potential stop-loss or take-profit zones.
Customizable Alerts:
Buy Alert: Triggered when the price returns within the Min-Max range after breaking below the Min.
Sell Alert: Triggered when the price returns within the Min-Max range after breaking above the Max.
Stop Loss Alerts: Triggered when the price reaches any of the four intermediate levels (Stop Loss 1 to Stop Loss 4).
Customizable Appearance:
Adjust the thickness, color, and style (solid, dashed, dotted) of the lines.
Customize the colors of the Stop Loss labels for better visualization.
Labels on the Chart:
Displays "Buy" and "Sell" labels on the chart when the respective conditions are met.
Labels for Stop Loss levels are also displayed for easy reference.
How to Use:
Add the indicator to your chart.
Customize the settings (line colors, thickness, and alert preferences) in the indicator's settings panel.
Use the Min and Max lines as dynamic support and resistance levels.
Monitor the intermediate levels (Stop Loss 1 to Stop Loss 4) for potential stop-loss or take-profit zones.
Set up alerts for Buy, Sell, and Stop Loss conditions to stay informed about key price movements.
Why Use This Indicator?
Simple and Effective: Focuses on the most important levels from the previous day.
Customizable: Tailor the indicator to match your trading style and preferences.
Alerts: Never miss a trading opportunity with customizable alerts for key conditions.
Settings:
Line Thickness: Adjust the thickness of the Min, Max, and intermediate lines.
Line Colors: Customize the colors of the Min, Max, and intermediate lines.
Line Style: Choose between solid, dashed, or dotted lines.
Stop Loss Label Colors: Customize the colors of the Stop Loss labels.
Alerts: Enable or disable alerts for Buy, Sell, and Stop Loss conditions.
Ideal For:
Day traders and swing traders.
Traders who rely on support and resistance levels.
Anyone looking for a clear and customizable tool to identify key price levels.
Disclaimer:
This indicator is for educational and informational purposes only. It does not constitute financial advice. Always conduct your own analysis and trade responsibly.
Get Started Today!
Add the Min-Max | Buy-Sell Alert with Levels indicator to your chart and take your trading to the next level. Customize it to fit your strategy and never miss a key trading opportunity again!
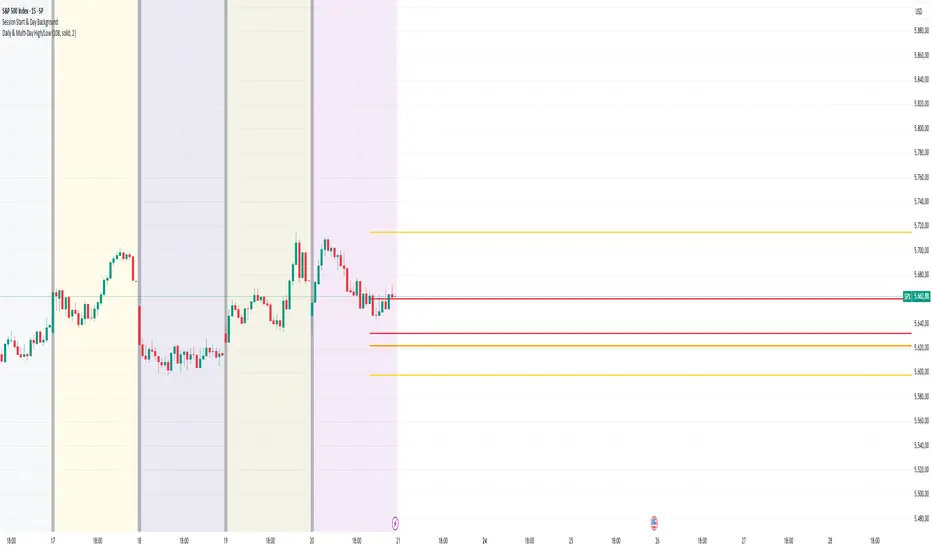
Daily & Multi-Day High/LowDaily & Multi-Candle High/Low Indicator
This indicator clearly highlights essential price levels directly on your chart, significantly improving your trading decisions:
First Candle High/Low (Session Open):
Quickly identify the high and low of the first candle each trading day, ideal for session-open traders.
Previous Day's High/Low:
Automatically plots the highest and lowest prices from the previous trading day, crucial for daily breakout or reversal strategies.
Multi-Candle High/Low (Customizable Period):
Easily track the highest and lowest points of the last X candles (default: 108 candles). Perfect for spotting key support and resistance zones.
Customization Options:
Adjust colors, line styles (solid, dashed, dotted), and line thickness directly from the settings for personalized visibility.
Ideal for day traders, swing traders, and price-action traders looking for clear and actionable daily levels on their charts.
High and Low in a Given Date/Time RangeThis Pine Script v5 indicator plots horizontal lines at both the highest and lowest price levels reached within a user-defined date/time range.
Description:
Inputs:
The user specifies a start and an end date/time by providing the year, month, day, hour, and minute for each. These inputs are converted into timestamps based on the chart’s timezone.
How It Works:
Timestamp Conversion: The script converts the provided start and end dates/times into timestamps using the chart’s timezone.
Bar Check: It examines every bar and checks if the bar’s timestamp falls between the start and end timestamps.
Price Updates:
If a bar’s time is within the specified range, the indicator updates the highest price if the current bar's high exceeds the previously recorded high, and it updates the lowest price if the current bar's low is lower than the previously recorded low.
Drawing Lines:
A red horizontal line is drawn at the highest price, and a green horizontal line is drawn at the lowest price. Both lines start from the first bar in the range and extend dynamically to the current bar, updating as new high or low values are reached.
End of Range: Once a bar's time exceeds the end timestamp, the lines stop updating.
This tool offers a clear and straightforward way to monitor key price levels during a defined period without any extra fluff.

Pivot Point Calculator PPC V2 by [KhedrFx]📈 Trade Smarter with the Pivot Point Calculator (PPC) by KhedrFx
Want to spot key price levels and make better trading decisions? The Pivot Point Calculator (PPC) by KhedrFx is your go-to TradingView tool for identifying potential support and resistance zones. Whether you’re a Scalper trader, day trader, swing trader, or long-term investor, this script helps you plan precise entries and exits with confidence.
🔹 How to Use Pivot Points in Trading
📊 Step 1: Identify Key Levels
The PPC automatically plots:
Pivot Point (P): The main level where sentiment shifts between bullish and bearish.
Support Levels (S1, S2, S3): Areas where price may bounce higher.
Resistance Levels (R1, R2, R3): Areas where price may face selling pressure.
These levels act as dynamic price zones, helping you anticipate potential market movements.
🔥 Step 2: Choose Your Trading Strategy
1️⃣ Breakout Trading
Buy when the price breaks above the pivot point (P) with strong momentum.
Sell when the price drops below the pivot point (P) with strong momentum.
Use R1, R2, or R3 as profit targets in an uptrend and S1, S2, or S3 in a downtrend.
2️⃣ Reversal (Bounce) Trading
Buy when the price pulls back to S1, S2, or S3 and shows bullish confirmation (e.g., candlestick patterns like a bullish engulfing or hammer).
Sell when the price rallies to R1, R2, or R3 and shows bearish confirmation (e.g., rejection wicks or a bearish engulfing pattern).
🎯 Step 3: Set Smart Stop-Loss & Take-Profit Levels
Stop-Loss: Place it slightly below support (for buy trades) or above resistance (for sell trades).
Take-Profit: Use the next pivot level as a target.
Extreme Zones: R3 and S3 often signal strong reversals or breakouts—watch them closely!
🚀 How to Get Started
1️⃣ Add the PPC script to your TradingView chart.
2️⃣ Choose a timeframe that fits your strategy (5m, 15m, 30m, 1H, 4H, Daily, or Weekly).
3️⃣ Use the pivot points and support/resistance levels to fine-tune your trade entries, exits, and risk management.
⚠️ Trade Responsibly
This tool helps you analyze the market, but it’s not a guarantee of profits. Always do your own research, manage risk, and trade with caution.
💡 Ready to take your trading to the next level? Try the Pivot Point Calculator (PPC) by KhedrFx and start trading with confidence today! 🚀

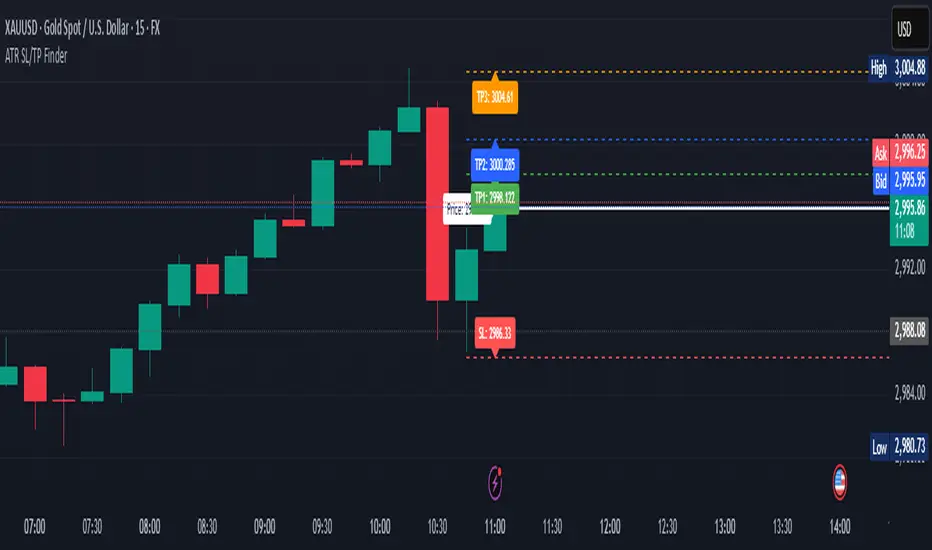
ATR Stop Loss & 3 TP FinderATR Stop Loss & 3 TP Finder - By SeehraSingh
This indicator is designed to help traders automate Stop Loss (SL) and Take Profit (TP) placement based on the Average True Range (ATR). It dynamically calculates:
Stop Loss (SL): Set based on a user-defined ATR multiplier.
Three Take Profit (TP) levels: Configurable ATR multipliers for TP1, TP2, and TP3.
Customizable Price Sources: Allows traders to choose different price sources (Open, High, Low, Close, HL2, HLC3, OHLC4, HLCC4) for both SL and TP calculations.
Visual Representation: Plots dashed lines for Entry, SL, TP1, TP2, and TP3.
Table Display: Provides an easy-to-read table at the bottom showing SL, TP1, TP2, and TP3 values.
How It Works:
Select ATR length and smoothing type (RMA, SMA, EMA, WMA).
Set ATR multipliers for SL and TP levels.
Choose the price source for SL and TP calculations.
The indicator automatically plots entry, SL, and three TP levels on the chart.
Ideal For:
Traders who use ATR-based dynamic Stop Loss and Take Profit strategies.
Those who want to avoid fixed SL/TP placements and prefer volatility-based risk management.
Scalpers, Swing Traders, and Position Traders looking for automated SL/TP visualization.
Disclaimer
⚠️ Trading involves risk. This indicator is for educational purposes only and should not be considered financial advice. Always conduct your own analysis before entering any trade. The author is not responsible for any financial losses incurred while using this tool. Past performance does not guarantee future results.
Time-Weighted Price Action IndicatorThe Time-Weighted Price Action Indicator is a simple yet effective tool designed to detect consolidation zones based on time duration and highlight potential reversal points using a contrarian breakout logic. Instead of following traditional breakout strategies, this indicator aims to capitalize on false breakouts and reversal entries.
How It Works
• The indicator identifies a price range (zone) using a configurable lookback period.
• If the price remains within this range for a specified number of bars (threshold), a consolidation zone is confirmed.
• Once a breakout or breakdown from this zone occurs, the indicator triggers a reversed signal — suggesting a potential reversal instead of a trend-following entry.
• Support and resistance levels are marked visually, and BUY/SELL labels are plotted when price re-enters the zone, indicating potential exhaustion or traps.
Key Features
• ✅ Time-based consolidation detection
• ✅ Contrarian signal logic (Buy at breakdowns, Sell at breakouts)
• ✅ Dynamic zone plotting with support/resistance visualization
• ✅ Auto-reset after each breakout for fresh zone detection
• ✅ Visual labels and alerts for BUY/SELL signals
How to Use
• Ideal for range-bound markets or identifying trap zones around support/resistance.
• Use in conjunction with volume, momentum, or trend filters to refine entries.
• Can complement mean reversion strategies or be used as a signal confirmation tool.
Why This Combination?
This approach blends time-based consolidation logic with a contrarian price action perspective, offering traders a different lens to analyze markets. Instead of blindly following breakouts, it highlights areas where price rejections and false breakouts often occur — common in algorithm-driven markets.
Why It’s Worth Using
This indicator helps you stay ahead of trap zones, identify reversal spots, and understand price behavior in consolidation zones — a critical edge, especially in sideways or choppy markets. It adds context to price movement, helping traders avoid common breakout failures.
Note:
• No performance guarantees or exaggerated claims.
• No solicitation or promotional language used.
• This is a free, open-source educational tool meant to aid price action understanding.

Cumulative New Highs - New Lows IndicatorThis indicator is designed to track market momentum by calculating and plotting the cumulative sum of 52 weeks High-Low for different indices, alongside a customizable moving average.
Index Selection:
Users can choose from multiple indices, including:
Total Stock Market (default)
NYSE Composite
Nasdaq Composite
S&P 500
Nasdaq 100
Russell 2000
Moving Average Customization:
The script allows you to select between a Simple Moving Average (SMA) or an Exponential Moving Average (EMA) for smoothing the cumulative data. The window length of the moving average is also adjustable, letting you tailor the sensitivity of the trend analysis.
Dynamic Background Plotting:
With the background plot option enabled, the indicator changes the chart's background color dynamically:
Green: When the cumulative sum is above its moving average, suggesting bullish momentum.
Red: When it is below the moving average, indicating bearish conditions.
Visual Representation:
Two key lines are plotted:
Cumulative Index Line: Displayed in a subtle blue, representing the aggregated market movement.
Moving Average Line: Shown in an orange tone, offering a smoothed perspective that aids in identifying trend shifts.
Inspiration:
I took inspiration from the indicator made by YoxTrades (I can't put links, but you can check their profile) and added a few features I wanted on top of it.

Fibonacci Pivot Points & Previous D,W&M Highs/LowsIndicator Overview
This indicator combines Fibonacci Pivot Points with previous high and low levels for different timeframes (day, week, month). It plots these levels on the chart to provide traders with key support and resistance areas, making it easier to identify potential trading opportunities.
Features
Fibonacci Pivot Points:
The indicator calculates pivot points based on the high, low, and close prices.
Fibonacci levels are used to determine support (S1, S2, S3, S4, S5) and resistance (R1, R2, R3, R4, R5) levels.
Users can customize the Fibonacci levels for both support and resistance.
Previous Highs and Lows:
The indicator plots previous day, week, and month high and low levels.
Each of these lines can be customized in terms of visibility, color, and width.
This helps traders to see key historical levels that might act as support or resistance in the future.
Inputs and Customization:
Fibonacci Time Frame:
Users can select the timeframe for calculating the pivot points (Daily, Weekly, Monthly).
Fibonacci Levels:
Customizable input fields for each Fibonacci level (R1, R2, R3, R4, R5, S1, S2, S3, S4, S5).
Previous High/Low Lines:
Day Lines:
Options to show or hide previous day's high/low lines.
Customizable color and width for these lines.
Week Lines:
Options to show or hide previous week's high/low lines.
Customizable color and width for these lines.
Month Lines:
Options to show or hide previous month's high/low lines.
Customizable color and width for these lines.
Technical Calculations:
Fibonacci Pivot Points:
Calculated as:
pp = (High + Low + Close) / 3
S1 = pp - ((High - Low) * Fibonacci Level)
R1 = pp + ((High - Low) * Fibonacci Level)
Previous High/Low Levels:
Uses request.security to fetch previous high and low values for the selected timeframe.
Plotted using line.new to draw lines across the chart.
Plotting:
The indicator plots Fibonacci Pivot Points and previous high/low lines on the chart, using distinct colors for each level.
Customizable transparency and linewidths make it easier to visually interpret the levels.
This indicator is particularly useful for traders who rely on technical analysis to identify key support and resistance levels, offering a blend of historical data and Fibonacci-based predictions.
Feel free to ask if you have any specific questions or need further adjustments!

Long and Short Term Highs and LowsLong and Short Term Highs and Lows
Overview:
This indicator is designed to help traders identify significant price points by marking new highs and lows over two distinct timeframes—a long-term and a short-term period. It achieves this by drawing optional channel lines that outline the highest highs and lowest lows over the chosen time periods and by plotting visual markers (triangles) on the chart when a new high or low is detected.
Key Features:
Dual Timeframe Analysis:
Long Term: Uses a user-defined “Time Period” (default 52) and “Time Unit” (default: Weekly) to determine long-term high and low levels.
Short Term: Uses a separate “Time Period” (default 50) and “Time Unit” (default: Daily) to compute short-term high and low levels.
Optional Channel Display:
For both long and short term periods, you have the option to display a channel by plotting the highest and lowest values as lines. This visual channel helps to delineate the range within which the price has traded over the selected period.
New High/Low Markers:
The indicator identifies moments when the highest high or lowest low is updated relative to the previous bar.
When a new high is established, an up triangle is plotted above the bar.
Conversely, when a new low occurs, a down triangle is plotted below the bar.
Separate input toggles allow you to enable or disable these markers independently for the long-term and short-term setups.
Inputs and Settings:
Long Term High/Low Period Settings:
Show New High/Low? (STW): Toggle to enable or disable the plotting of new high/low markers for the long-term period.
Time Period: The number of bars used to calculate the highest high and lowest low (default is 52).
Time Unit: The timeframe on which the long-term calculation is based (default is Weekly).
Show Channel? (SCW): Toggle to display the channel lines that connect the long-term high and low levels.
Short Term High/Low Period Settings:
Show New High/Low?: Toggle to enable or disable the plotting of new high/low markers for the short-term period.
Time Period: The number of bars used for calculating the short-term extremes (default is 50).
Time Unit: The timeframe on which the short-term calculations are based (default is Daily).
Show Channel?: Toggle to display the channel lines for the short-term highs and lows.
Indicator Logic:
Channel Calculation:
The script uses the request.security function to pull data from the specified timeframes. For each timeframe:
It calculates the lowest low over the defined period using ta.lowest.
It calculates the highest high over the defined period using ta.highest.
These values can be optionally plotted as channel lines when the “Show Channel?” option is enabled.
New High/Low Detection:
For each timeframe, the indicator compares the current high (or low) with its immediate previous value:
New High: When the current high exceeds the previous bar’s high, an up triangle is drawn above the bar.
New Low: When the current low falls below the previous bar’s low, a down triangle is drawn below the bar.
Usage and Interpretation:
Trend Identification:
When new highs (or lows) occur, they can signal the start of a strong upward (or downward) movement. The indicator helps you visually track these critical turning points over both longer and shorter periods.
Channel Breakouts:
The optional channel display offers additional context. Price movement beyond these channels may indicate a breakout or a significant shift in trend.
Customizable Timeframes:
You can adjust both the time period and time unit to fit your trading style—whether you’re focusing on longer-term trends or short-term price action.
Conclusion:
This indicator provides a dual-layer analysis by combining long-term and short-term perspectives, making it a versatile tool for identifying key highs and lows. Whether you are looking to confirm trend strength or spot potential breakouts, the “Long and Short Term Highs and Lows” indicator adds a valuable visual element to your TradingView charts.

AdvancedLines (FiboBands) - PaSKaL
Overview :
AdvancedLines (FiboBands) - PaSKaL is an advanced technical analysis tool designed to automate the plotting of key Fibonacci retracement levels based on the highest high and lowest low over a customizable period. This indicator helps traders identify critical price zones such as support, resistance, and potential trend reversal or continuation points.
By using AdvancedLines (FiboBands) - PaSKaL , traders can easily spot key areas where the price is likely to reverse or consolidate, or where the trend may continue. It is particularly useful for trend-following, scalping, and range-trading strategies.
Key Features:
Automatic Fibonacci Level Calculation :
- The indicator automatically calculates and plots key Fibonacci levels (0.236, 0.382, 0.5, 0.618, and 0.764), which are crucial for identifying potential support and resistance levels in the market.
Adjustable Parameters :
- Bands Length: You can adjust the bands_length setting to change the number of bars used for calculating the highest high and lowest low. This gives flexibility for using the indicator on different timeframes and trading styles.
- Visibility: The Fibonacci levels, as well as the midline (0.5 Fibonacci level), can be shown or hidden based on your preference.
- Color Customization: You can change the color of each Fibonacci level and background fills to suit your chart preferences.
Fibonacci Levels
- The main Fibonacci levels plotted are:
- 0.236 – Minor support/resistance level
- 0.382 – Moderate retracement level
- 0.5 – Midpoint retracement, often used as a key level
- 0.618 – Golden ratio, considered one of the most important Fibonacci levels
- 0.764 – Strong reversal level, often indicating a continuation or change in trend
Background Fill
- The indicator allows you to fill the background between the Fibonacci levels and the bands with customizable colors. This makes it easier to visually highlight key zones on the chart.
How the Indicator Works:
AdvancedLines (FiboBands) - PaSKaL calculates the range (difference between the highest high and the lowest low) over a user-defined number of bars (e.g., 300). Fibonacci levels are derived from this range, helping traders identify potential price reversal points.
Mathematical Basis :
Fibonacci retracement levels are based on the Fibonacci sequence, where each number is the sum of the previous two (0, 1, 1, 2, 3, 5, 8, 13, etc.). The ratios derived from this sequence (such as 0.618 and 0.382) have been widely observed in nature, market cycles, and price movements. These ratios are used to forecast potential price retracements or continuation points after a major price move.
Fibonacci Levels Calculation :
Identify the Range: The highest high and the lowest low over the defined period are calculated.
Apply Fibonacci Ratios: Fibonacci ratios (0.236, 0.382, 0.5, 0.618, and 0.764) are applied to this range to calculate the corresponding price levels.
Plot the Levels: The indicator automatically plots these levels on your chart.
Customizing Fibonacci Levels & Colors:
The "AdvancedLines (FiboBands) - PaSKaL" indicator offers various customization options for Fibonacci levels, colors, and visibility:
Fibonacci Level Ratios:
- You can customize the Fibonacci level ratios through the following inputs:
- Fibo Level 1: 0.764
- Fibo Level 2: 0.618
- Fibo Level 3: 0.5
- Fibo Level 4: 0.382
- Fibo Level 5: 0.236
- These levels determine key areas where price may reverse or pause. You can adjust these ratios based on your trading preferences.
Fibonacci Level Colors:
- Each Fibonacci level can be assigned a different color to make it more distinguishable on your chart:
- Fibo Level 1 Color (default: Yellow)
- Fibo Level 2 Color (default: Orange)
- Fibo Level 3 Color (default: Green)
- Fibo Level 4 Color (default: Red)
- Fibo Level 5 Color (default: Blue)
- You can change these colors to fit your visual preferences or to align with your existing chart themes.
Visibility of Fibonacci Levels:
- You can choose whether to display each Fibonacci level using the following visibility inputs:
- Show Fibo Level 1 (0.764): Display or hide this level.
- Show Fibo Level 2 (0.618): Display or hide this level.
- Show Fibo Level 3 (0.5): Display or hide this level.
- Show Fibo Level 4 (0.382): Display or hide this level.
- Show Fibo Level 5 (0.236): Display or hide this level.
- This allows you to customize the indicator according to the specific Fibonacci levels that are most relevant to your trading strategy.
Background Fill Color
- The background between the Fibonacci levels and price bands can be filled with customizable colors:
- Fill Color for Upper Band & Fibo Level 1: This color will fill the area between the upper band and Fibonacci Level 1.
- Fill Color for Lower Band & Fibo Level 5: This color will fill the area between the lower band and Fibonacci Level 5.
- Adjusting these colors helps highlight critical zones where price may reverse or consolidate.
How to Use AdvancedLines (FiboBands) - PaSKaL in Trading :
Range Trading :
Range traders typically buy at support and sell at resistance. Fibonacci levels provide excellent support and resistance zones in a ranging market.
Example: If price reaches the 0.618 level in an uptrend, it may reverse, providing an opportunity to sell.
Conversely, if price drops to the 0.382 level, a bounce might occur, and traders can buy, anticipating the market will stay within the range.
Trend-following Trading :
For trend-following traders, Fibonacci levels act as potential entry points during a retracement. After a strong trend, price often retraces to one of the Fibonacci levels before continuing in the direction of the trend.
Example: In a bullish trend, when price retraces to the 0.382 level, it could be a signal to buy, as the price might resume its upward movement after the correction.
In a bearish trend, retracements to levels like 0.618 or 0.764 could provide optimal opportunities for shorting as the price resumes its downward movement.
Scalping :
Scalpers focus on short-term price movements. Fibonacci levels can help identify precise entry and exit points for quick trades.
Example: If price is fluctuating in a narrow range, a scalper can enter a buy trade at 0.236 and exit at the next Fibonacci level, such as 0.382 or 0.5, capturing small but consistent profits.
Stop-Loss and Take-Profit Levels :
Fibonacci levels can also help in setting stop-loss and take-profit levels.
Example: In a bullish trend, you can set a stop-loss just below the 0.236 level and a take-profit at 0.618.
In a bearish trend, set the stop-loss just above the 0.382 level and the take-profit at 0.764.
Identifying Reversals and Continuations :
Reversals: When price reaches a Fibonacci level and reverses direction, it may indicate the end of a price move.
Trend Continuation: If price bounces off a Fibonacci level and continues in the same direction, this may signal that the trend is still intact.
Conclusion :
AdvancedLines (FiboBands) - PaSKaL is an essential tool for any trader who uses Fibonacci retracements in their trading strategy. By automatically plotting key Fibonacci levels, this indicator helps traders quickly identify support and resistance zones, forecast potential reversals, and make more informed trading decisions.
For Trend-following Traders: Use Fibonacci levels to find optimal entry points after a price retracement.
For Range Traders: Identify key levels where price is likely to reverse or bounce within a range.
For Scalpers: Pinpoint small price movements and take advantage of quick profits by entering and exiting trades at precise Fibonacci levels.
By incorporating AdvancedLines (FiboBands) - PaSKaL into your trading setup, you will gain a deeper understanding of price action, improve your decision-making process, and enhance your overall trading performance.

Hammer Detector### Hammer Pattern Detector
The Hammer Pattern Detector is a specialized technical analysis tool designed to identify high-probability hammer candlestick patterns. This indicator uses precise mathematical calculations to detect hammer patterns that meet specific criteria, helping traders identify potential market reversals.
#### Key Features
- Precise detection of hammer patterns based on shadow-to-body ratios
- Customizable parameters for fine-tuning pattern recognition
- Visual alerts with markers above qualifying candles
- Built-in alert functionality for real-time notifications
#### Parameters
1. **Shadow Length Multiplier (min)**: Controls how many times longer the lower shadow must be compared to the candle body (default: 2.0)
2. **Maximum Upper Shadow (%)**: Sets the maximum allowed length for the upper shadow as a percentage of total candle length (default: 10%)
3. **Minimum Body to High Distance (%)**: Defines how close the body must be to the high of the candle (default: 90%)
#### Detection Criteria
The indicator identifies hammer patterns based on three main conditions:
- Lower shadow must be at least twice the length of the body (adjustable)
- Upper shadow must be minimal (max 10% of total candle length by default)
- Candle body must be positioned near the high of the candle
#### Use Cases
- Identifying potential trend reversals
- Finding entry points in oversold conditions
- Confirming support levels
- Part of a broader reversal strategy
#### Tips for Best Results
- Use in conjunction with support/resistance levels
- Combine with volume analysis for confirmation
- Consider overall market context and trend
- Adjust parameters based on your trading timeframe
#### Installation
1. Add the indicator to your chart
2. Adjust the parameters according to your trading style
3. Optional: Set up alerts for real-time notifications
#### About
Created by WK
Version: 1.0
All rights reserved ©WK
For questions or suggestions, please reach out through TradingView.

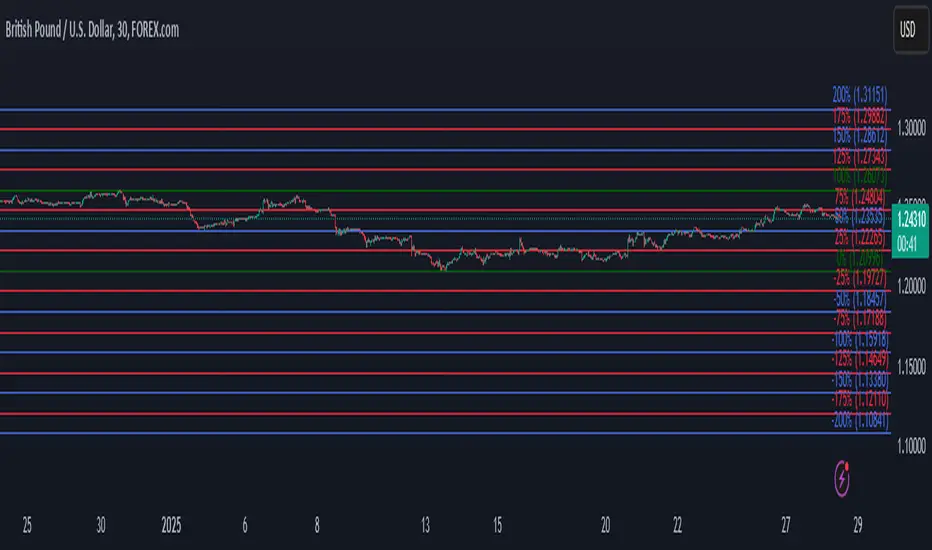
Automatic Fibonacci retracement based on the highest high and loThe chart is fractal, meaning that what happens can always be broken down into smaller portions.
This is often seen in various AR (Algorithmic Rules) concepts, such as breakers, order blocks, etc., where the price reacts.
I’ve visualized this behavior with this indicator.
This indicator takes the highest high and the lowest low from the past 5 weeks, excluding the current week.
The lowest low will represent 0%, and the highest high will represent 100% (green lines).
It then divides this range into 25%, 50%, 75%, and 100% levels (red and blue lines).
The indicator works on all charts and all timeframes, automatically adjusting when you switch charts or timeframes. No manual input is required.
Additionally, above 100%, it will create levels at 125%, 150%, 175%, and 200%, while below 0%, it will create levels at -25%, -50%, -75%, and -100%.
Your chart will now be divided into these 25% levels, allowing you to observe how the price either respects or breaks through them.
Again, this isn’t something “groundbreaking,” but simply a visual aid to identify levels where the price finds support/resistance or breaks through.
It helps me gain a broader perspective and determine whether my trade is moving in the right direction or if I should remain cautious.