NeoChartLabs Hull Moving AverageOne of our Favorite Indicators - The NeoChart Labs Hull Moving Average
Shout out to r0m3 for creating the original Hull Momentum
This indicator changes green when the Stochastic RSI moves into Bullish territory , white when Neutral, and red when Bearish.
Smoothed out and sped up to be more compatible with the fast paced Crypto market.
HMA

Supertrend + MACD + HMAIndicator Description: Supertrend + MACD + HMA
General Summary
It is a composite technical indicator that combines three analysis tools to generate buy and sell signals in institutional trading. It uses confirmation from multiple indicators to increase the precision of market entries.
Components
1. Supertrend (ST)
Function: Identifies the main market trend (bullish or bearish)
Parameters: ATR Length 10, Factor 3.0
Visualization:
Green line = Bullish trend
Red line = Bearish trend
Semi-transparent green/red background that fills the area according to direction
How it works: Uses ATR (Average True Range) to calculate dynamic support and resistance bands
2. MACD (Moving Average Convergence Divergence)
Function: Measures price momentum and direction
Parameters: Fast 18, Slow 144, Signal Smoothing 9
Components:
MACD Line (orange): Difference between two EMAs
Signal Line (purple): EMA of the MACD
Histogram (green/red columns): Difference between MACD and its signal
Green = Positive histogram (bullish momentum)
Red = Negative histogram (bearish momentum)
3. HMA 100 (Hull Moving Average)
Function: Identifies support/resistance level and price direction
Parameters: Length 100
Visualization: Blue thick line
Characteristics:
Less lag than traditional moving averages
Price > HMA = Bullish trend
Price < HMA = Bearish trend
Signal Logic
🟢 BUY SIGNAL
Generated when ANY of these conditions is met:
Total Confluence:
MACD positive (histogram > 0)
Price above HMA 100
Supertrend in Bullish mode
Supertrend Change:
Supertrend changes from Bearish to Bullish
MACD remains positive
Price above HMA
Price Crossover:
Price crosses above HMA (at candle close)
Supertrend is in Bullish mode
MACD is positive
🔴 SELL SIGNAL
Generated when ANY of these conditions is met:
Total Confluence:
MACD negative (histogram < 0)
Price below HMA 100
Supertrend in Bearish mode
Supertrend Change:
Supertrend changes from Bullish to Bearish
MACD remains negative
Price Crossover:
Price crosses below HMA (at candle close)
Supertrend is in Bearish mode
MACD is negative
Important Features
✅ Single Signal Per Type
Once a BUY is generated, no other BUY is generated until a SELL appears
Avoids multiple entries in the same direction
✅ Crossover Detection
The indicator generates signals at candle close when price crosses HMA
Allows capturing quick market moves
✅ Trend Changes
Detects when Supertrend changes direction
Provides early exits from the market
✅ Automatic Alerts
Push notifications when BUY or SELL is generated
Ideal for automated trading

HMA 34 Dual-Fractal Projections - VdubusVdubus MacD Divergence Trend Break Signal Generator :Here:-
HMA 18 Dual-Fractal Projections
Overview
The HMA 18 Dual-Fractal Projections is a technical analysis tool designed to identify market structure and potential breakout patterns by analyzing the pivots of a Hull Moving Average (HMA).
Unlike standard trendline indicators that struggle to balance "big picture" trends with immediate price action, this indicator utilizes a Dual-Fractal approach. It simultaneously calculates two separate timelines—Macro and Micro—to visualize both the dominant channel and the developing chart patterns (such as wedges or triangles) in real-time.
Visual Guide
The indicator plots three key elements on the main chart:
The HMA Line (Blue): A smooth, fast-acting moving average (default length 34) that serves as the baseline for all calculations.
Macro Structure (Solid, Thick Lines):
Red (Solid): Major Resistance.
Green (Solid): Major Support.
Purpose: Identifies the long-term trend channel. These lines react slowly and filter out noise.
Micro Structure (Dashed, Thin Lines):
Red (Dashed): Immediate Resistance.
Green (Dashed): Immediate Support.
Purpose: Identifies the short-term market structure. These lines react quickly to show forming wedges, triangles, or flags.
How It Works
The indicator applies a "Pivot High/Low" algorithm directly to the HMA data rather than raw price data. This filters out candle wicks and volatility, ensuring lines are drawn based on established momentum shifts.
Layer 1 (Macro): Uses a large "Lookback" period (default 44 bars) to find significant peaks and valleys. It connects the most recent major pivot to the previous one, projecting a line forward to show where the major trend channel lies.
Layer 2 (Micro): Uses a small "Lookback" period (default 10 bars) to find local peaks and valleys. This allows you to see how price is behaving within the larger channel.
Settings & Configuration
HMA Settings
HMA Length: The length of the Hull Moving Average.
Default: 34 (Matches the "visually pleasing" setting from recent testing).
Note: Set to 18 for a faster, more reactive baseline (scalping).
Layer 1: Macro (Big Channel)
Macro Lookback: Determines how many bars must pass before a peak is confirmed.
Default: 44. High values find broad, established channels.
Max Macro Lines: How many historical lines to keep on the chart.
Default: 1 (Keeps the chart clean, showing only the current structure).
Extend Macro Lines: Projects the lines infinitely to the right to predict future support/resistance zones.
Layer 2: Micro (Current Pattern)
Micro Lookback: A lower sensitivity setting to catch immediate structure.
Default: 10. Low values will pinpoint the exact boundaries of small wedges or flags forming right now.
Trading Strategy & Interpretation
1. The "Squeeze" (Wedge Identification) This is the primary use case.
Look for scenarios where the Macro Lines (Solid) are wide/parallel, but the Micro Lines (Dashed) are rapidly converging (pointing towards each other).
This indicates that while the main trend is intact, momentum is compressing. A breakout is imminent where the dashed lines intersect.
2. Trend Channels
When both Solid and Dashed lines are roughly parallel and sloping in the same direction, the trend is healthy and strong. Price is respecting both the short-term and long-term momentum.
3. Divergence / Early Reversal Warning
If the Macro Line is sloping UP, but the Micro Line starts sloping DOWN (crossing inside), it indicates a loss of momentum and a potential reversal before the price actually breaks the major trendline.
===========================================================================
2. Micro/Macro Cross Alert
A new input, Enable Micro/Macro Cross Alert, has been added under the "Alerts & Features" section.
This alert condition is triggered when the momentum of the Micro Structure exceeds the momentum of the Macro Structure, which is a high-probability signal for a breakout:
Bullish Alert: The Micro High (dashed red line) crosses above the Macro High (solid red line).
Bearish Alert: The Micro Low (dashed green line) crosses below the Macro Low (solid green line).
To set up the actual alert on your chart:
Right-click on the chart.
Select "Add alert on HMA 34 Dual-Fractal Projections".
In the Condition dropdown, select the indicator's name.
For the main alert criteria, choose "Any alert()".
Select your preferred alert actions (e.g., notification, email).

RT-Custom Clouds|RSI|HMA|GPIntroduction
The RT-Custom Clouds|RSI|HMA|GP indicator is a multipurpose toolkit that combines custom Ichimoku clouds, custom RSI-based overlays, RSI Top/Bottom signals, Hull Moving Averages and automated Fibonacci Golden Pocket zones into a single indicator. It is designed to give traders flexible ways to view trend, momentum, and key zones on the chart.
This publication walks through each major component of the RT-Custom Clouds|RSI|HMA|GP indicator and how traders commonly use them.
Custom Ichimoku Clouds
The top section of RT Custom Clouds focuses on Ichimoku-style clouds. Traders can choose between different cloud variants and control whether they want the full Ichimoku toolkit or only the cloud itself on the chart.
A single toggle controls the cloud display: Cloud Only (All Versions) - When enabled, only the selected cloud is displayed. Core Ichimoku lines are hidden so traders who prefer a clean cloud view can keep their charts simple. Traders can select between three cloud styles: Josh Olszewicz Cloud (Preferred) - Uses a doubled parameter set inspired by the well-known Ichimoku variant popularized by Josh Olszewicz.
Standard Cloud - Uses the classic Ichimoku settings familiar from most charting platforms.
Custom Cloud - Allows full control over the main Ichimoku inputs:
Custom Conversion Line Length
Custom Base Line Length
Custom Leading Span Length
Custom Displacement
These options let traders move between a standard Ichimoku view, a doubled parameter variant, or a fully customized configuration tuned to their own style.
Custom RSI X's and RSI Bot Signals
The RT-Custom Clouds|RSI|HMA|GP indicator also includes an RSI X overlay that plots RSI information directly onto price candles instead of keeping it in a separate lower pane. This makes it easier to see momentum shifts and extended conditions without constantly looking down at another indicator. RSI Colors
Instead of drawing RSI as a line, the tool places colored X markers on candles to reflect RSI behavior. These markers use an adapted version of the Rainbow Trends color system. To keep candle colors and RSI markers visually distinct, the original Rainbow Trends color code is inverted for RSI. This inversion helps traders quickly distinguish between the underlying trend colors and the RSI-driven overlays: RSI Settings
The RSI section includes a focused set of options to tune how the X markers behave and how the RSI Bot interprets momentum:
RSI "X" Marker Sensitivity - Adjusts how sensitive the X markers are to RSI changes. Higher or lower values will change how often markers appear.
RSI Length - Controls how many candles are used when calculating RSI. The default value is similar to traditional 14-period RSI, but can be adjusted.
RSI Markers On/Off - Toggles the colored X markers on or off.
RSI Top/Bottom Signals On/Off - Toggles the RSI Bot signals that mark potential tops and bottoms.
RSI Overbought On/Off - Enables or disables overbought style X markers.
RSI Oversold On/Off - Enables or disables oversold style X markers.
RSI Bot - Tops And Bottoms
Over time, traders using this tool wanted a way to summarize longer stretches of RSI activity into clear signals. The RSI Top/Bottom Bot does this by watching runs of RSI X markers and waiting for those runs to pause.
Conceptually, the RSI Bot: Monitors when a strong sequence of RSI X markers is printing in one direction.
Waits for a candle where no RSI X marker appears after that run.
Marks that candle as a potential RSI Top or RSI Bottom, since the prior RSI pressure has paused and a reversal may start. These signals can be tied to TradingView alerts using standard alert conditions so traders can monitor major shifts in RSI behavior without watching every bar. Alerts can be set for either RSI Top signals or RSI Bottom signals. Hull Moving Average (HMA)
The RT-Custom Clouds|RSI|HMA|GP indicator also includes a Hull Moving Average component inspired by early users of Rainbow Trends tools who relied on tuned HMAs for trend context. The HMA implementation follows common definitions of the Hull Moving Average and can be configured with user-defined lengths. Many traders using this tool treat the HMA as a secondary trend filter or confirmation layer alongside other Rainbow Trends indicators. For example: Watching whether price is trading above or below a longer HMA to frame bullish or bearish bias.
Studying how price interacts with the HMA during extended trends or range rotations.
HMA Cross Alerts And Divergences
The tool can also draw and alert on HMA cross events and divergence style patterns: HMA Cross Alerts - Alerts can be configured when price or multiple HMAs cross, allowing traders to automate notifications for potential trend shifts.
HMA Divergences - An optional divergence mode looks for conditions similar to RSI divergence style setups, but applied to the HMA logic. These are intended as context layers around trend behavior, not as automatic entry and exit rules.
HMA Settings
The HMA module of this indicator can be tuned to meet each trader's preference.
Plot HMA - On/Off - Toggles the HMA Line on/off.
HMA Alerts - On/Off - Toggles HMA Alerts on/off.
Plot HMA Alerts - On/Off - Toggles HMA Alerts on/off.
Plot Divergences - On/Off - Toggles Divergences on/off so the trader can choose which specific ones they want to display.
HMA Period - Adjusts the period of candles the HMA is calculated off of.
HMA Source - Changes the base calculation of the HMA.
Pivot Lookbacks - Adjusts the candle lookback range for the HMA Divergences.
Max/Min of Lookback Range - Adjusts the min & max lookback range for the HMA Divergences. Fibonacci Golden Pockets
The RT-Custom Clouds|RSI|HMA|GP indicator also includes an automated Fibonacci Golden Pocket module. Instead of manually drawing Fibonacci retracements and marking the Golden Pocket region for each swing, the tool scans the chart and plots these zones for the trader.
The Golden Pocket module can be configured using:
Golden Pocket On/Off - Toggles automatic plotting of golden pocket zones.
Golden Pocket Colors - Controls line and fill appearance so zones can be made more or less prominent.
Lookback Period - Defines how far back the algorithm studies price action when searching for swings and drawing golden pocket zones.
Invert Fibs - Inverts the Golden Pocket measurement.
Extend Lines - Allows for the Fib lines to be plotted further across the chart.
Display Prices/Levels - Toggles plotting of the prices and Fib levels on and off. Some traders prefer to work with both traditional and inverted golden pockets at the same time. This can be done by adding RT Custom Clouds to the chart twice, running one instance with standard golden pocket settings and the second instance with inverted settings.
How Traders Commonly Use The RT-Custom Clouds|RSI|HMA|GP Indicator
Because the RT-Custom Clouds|RSI|HMA|GP indicator offers several tools into a single script, traders often use it as a multipurpose context layer rather than a one-dimensional indicator. Common patterns include: Using custom Ichimoku clouds to frame overall trend and support or resistance zones.
Overlaying RSI X markers and RSI Top/Bottom signals onto price to highlight momentum shifts and exhaustion areas.
Adding HMA and HMA cross alerts as a secondary trend confirmation tool.
Letting the Golden Pocket module continuously plot Fibonacci based zones to study how price reacts around them over time.
In all cases, RT Custom Clouds is designed to provide structured context that can be combined with other Rainbow Trends tools, price action, and volume analysis.
Important Note
The RT-Custom Clouds|RSI|HMA|GP indicator is intended to provide additional context around trend structure, momentum, and potential support or resistance zones. It is not a standalone signal generator and should always be used together with your own analysis, testing, and risk management. Historical examples or past interactions with clouds, RSI markers, HMAs, or golden pockets do not guarantee future results.
🐋 Tight lines and happy trading!

paigep.llc - SuperMASuperMA is a multi-layered moving-average and candle-coloring system that combines SMA, EMA, and optional HMA logic to help traders visualize trend shifts, pullbacks, and momentum changes in a clean, structured way.
The script includes multiple modules: trend-based moving averages, pullback signals, exit logic, and an optional HMA cross engine.
📌 Core Features
1. Full SMA + EMA Framework
The indicator plots multiple moving averages (8, 9, 13, 20, 50, 200) using both SMA and EMA calculations. Each line automatically colors bullish or bearish based on its relationship to the 200-period baseline.Users can toggle SMAs and EMAs independently for clearer chart control.
2. Main Trend Entry & Exit Logic (8×200 and 8×20)
Built-in crossover logic detects:
Main Entry: SMA 8 crossing above/below EMA 200
Main Exit: SMA 8 and SMA 20 cross (with an option to choose which SMA is treated as the “fast” leg)
A “first exit only” option allows the script to ignore additional exit signals until a new trend regime begins.
3. Pullback Module (20 SMA Interaction)
Pullback entries and exits occur when price crosses the 20 SMA during existing trend conditions.
This includes:
Pullback entries through the 20 SMA
Pullback exits back across the 20 SMA
Labels and candle colors are available for all pullback events.
4. Optional HMA Cross Module
A separate module allows traders to use two Hull Moving Averages (HMA) with customizable:
Lengths
Independent timeframes
Line colors
Cross-based entries and exits
This module has its own events, labels, and optional candle coloring.
5. Advanced Candle Coloring System
Candle coloring is layered in priority order, based on:
Main trend entries
Main exits
HMA entries
HMA exits
Pullback entries
Pullback exits
Trend-only candles (based on SMA 8 relative to EMA 200)
Users may also independently color wicks and borders.
6. Configurable Alerts (Fully Decoupled from Visuals)
Alerts are available for all major events, including:
Main Entries (8×200)
Main Exits (8×20)
Pullback Entries and Exits
HMA Entries and Exits
Bull or Bear Trend candles
Any colored candle event
Alerts can fire on bar close only or intrabar, depending on user preference.
📌 Use Cases
SuperMA helps traders visualize:
Trend direction using SMA/EMA structure
Momentum shifts through HMA crosses
Pullback zones around the 20 SMA
Early regime transitions based on the 8×200 relationship
Candle-level context through color-coded bars
The indicator works across all markets and timeframes.
⚠️ Note
This tool is for visual and analytical assistance only. It does not guarantee future performance and should be combined with additional analysis and risk management.

paigep.llc - SuperMA
SuperMA is a multi-layered moving-average and candle-coloring system that combines SMA, EMA, and optional HMA logic to help traders visualize trend shifts, pullbacks, and momentum changes in a clean, structured way.
The script includes multiple modules: trend-based moving averages, pullback signals, exit logic, and an optional HMA cross engine.
📌 Core Features
1. Full SMA + EMA Framework
The indicator plots multiple moving averages (8, 9, 13, 20, 50, 200) using both SMA and EMA calculations. Each line automatically colors bullish or bearish based on its relationship to the 200-period baseline. Users can toggle SMAs and EMAs independently for clearer chart control.
2. Main Trend Entry & Exit Logic (8×200 and 8×20)
Built-in crossover logic detects:
Main Entry: SMA 8 crossing above/below EMA 200
Main Exit: SMA 8 and SMA 20 cross (with an option to choose which SMA is treated as the “fast” leg)
A “first exit only” option allows the script to ignore additional exit signals until a new trend regime begins.
3. Pullback Module (20 SMA Interaction)
Pullback entries and exits occur when price crosses the 20 SMA during existing trend conditions.
This includes:
Pullback entries through the 20 SMA
Pullback exits back across the 20 SMA
Labels and candle colors are available for all pullback events.
4. Optional HMA Cross Module
A separate module allows traders to use two Hull Moving Averages (HMA) with customizable:
Lengths
Independent timeframes
Line colors
Cross-based entries and exits
This module has its own events, labels, and optional candle coloring.
5. Advanced Candle Coloring System
Candle coloring is layered in priority order, based on:
Main trend entries
Main exits
HMA entries
HMA exits
Pullback entries
Pullback exits
Trend-only candles (based on SMA 8 relative to EMA 200)
Users may also independently color wicks and borders.
6. Configurable Alerts (Fully Decoupled from Visuals)
Alerts are available for all major events, including:
Main Entries (8×200)
Main Exits (8×20)
Pullback Entries and Exits
HMA Entries and Exits
Bull or Bear Trend candles
Any colored candle event
Alerts can fire on bar close only or intrabar, depending on user preference.
Use Cases
SuperMA helps traders visualize:
Trend direction using SMA/EMA structure
Momentum shifts through HMA crosses
Pullback zones around the 20 SMA
Early regime transitions based on the 8×200 relationship
Candle-level context through color-coded bars
The indicator works across all markets and timeframes.
⚠️ Note
This tool is for visual and analytical assistance only. It does not guarantee future performance and should be combined with additional analysis and risk management.

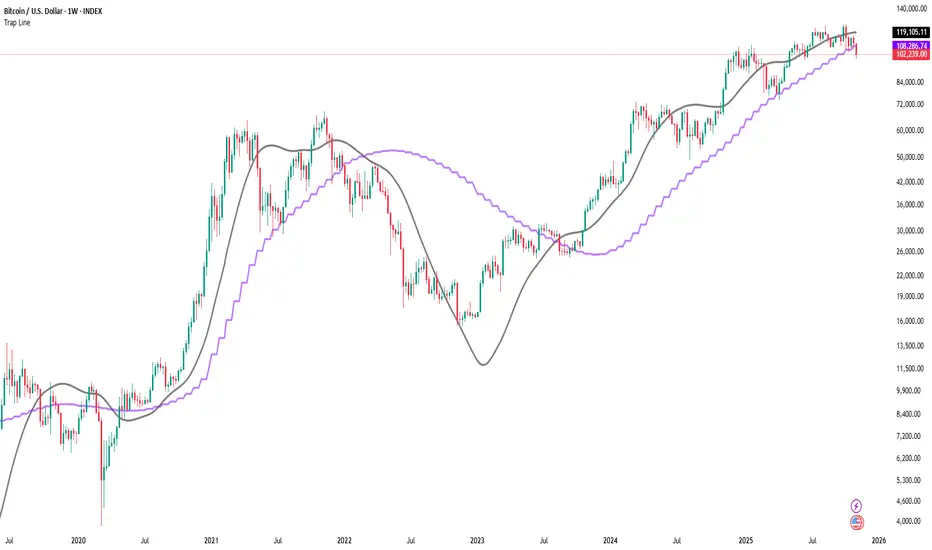
Trap LineOverview
Trap Line is a higher-timeframe trend framework designed to define market regimes using smoothed weekly (1W) and three-week (3W) baselines. Price trading above the line reflects a bullish regime; price below the line reflects a bearish one. The goal is regime discipline—stay aligned with the dominant higher-timeframe direction and avoid late, emotional entries. All parameters are fixed to ensure consistent behavior across symbols.
Core logic (concepts, not full code)
• Computes a Hull-type moving average on 1W and 3W closes (with optional linear-regression pre-filtering) and projects them onto lower timeframes via interpolation.
• Produces a smooth, lag-reduced structural baseline that tracks the weekly trend path.
• Observing price vs. the baseline highlights potential trap zones—temporary breaches that often fail without a confirmed weekly close.
• The 3-Week Trap Line adds a macro confirmation layer and is hidden by default in the Style tab to keep charts clean.
Inputs
• Parameters (length, smoothing type, regression toggle, interpolation mode) are fixed to prevent overfitting and preserve repeatability.
How to read it
• Above the line => bullish regime.
• Below the line => bearish regime.
• A confirmed weekly close through the line suggests a regime transition.
• A weekly close above the line with a green candle supports bullish continuation; a weekly close below the line with a red candle supports bearish continuation.
• Intraweek deviations near the line are often noise and may fade.
Practical use cases
• Weekly bias filter for swing/position frameworks.
• Regime confirmation across related assets or sectors.
• Portfolio overlay: favor long exposure in bullish regimes; reduce risk in bearish regimes.
• Combine with volume or ATR-based tools to assess trend quality.
Best practices
• Wait for the weekly close before declaring regime flips.
• Avoid overreacting to intraweek moves around the baseline.
• Combine with structure analysis (HH/HL vs. LH/LL) and higher-timeframe S/R.
• Use standard time-based candles; avoid interpreting signals on Heikin Ashi, Renko, Kagi, Point & Figure, or Range charts.
Technical notes
• Built on locked higher-timeframe data (1W and 3W).
• Interpolation is used to render HTF structure smoothly on lower charts.
• Non-repainting : values finalize when the higher timeframe closes; lower-TF plotting is interpolated, not forward-looking.
Who it is for
• Traders who want a consistent, rules-based higher-timeframe bias filter.
• Systematic users who prefer fixed-parameter baselines for regime context.
Limitations & disclosures
• Closed-source; educational and analytical use only.
• Not financial advice. Markets involve risk; past performance does not guarantee future results.
Release notes
• Includes the 3-Week Trap Line (3W). It is hidden by default in the Style tab; enable it if you want an additional macro confirmation layer.
• Fixed-parameter design (no user-tweakable inputs) for consistent behavior across symbols.
• Non-repainting values finalize on 1W/3W candle close.
Originality & why closed-source
This is not a reimplementation of public open-source scripts. Trap Line uses a specific combination of higher-timeframe Hull smoothing, optional linear-regression pre-filtering, and lower-timeframe interpolation designed to expose trap zones (temporary regime breaches that often fail without a confirmed weekly close). The integration and thresholds are proprietary and tuned to retain weekly structure with reduced lag. The source is closed to protect this implementation.
Integration, not a mashup
Trap Line is a single, self-contained framework. It does not merely merge other indicators; its components are integrated to produce a unified higher-timeframe baseline (1W/3W) with a defined reading protocol (above/below line, weekly-close confirmation, optional candle-color confirmation).
Indicator, not a strategy
This publication provides an indicator overlay , not a trading strategy. It includes no backtests, position logic, performance claims, or risk assumptions. Use it as an analytical bias filter within your own risk management.
Comparison to common tools
Compared to standard MAs or SuperTrend-style bands, Trap Line prioritizes (1) higher-timeframe structure fidelity, (2) reduced lag via HMA-type smoothing, and (3) explicit weekly-close confirmation to avoid premature regime flips. The optional 3-Week line acts as a macro confirmation layer and is hidden by default in the Style tab.
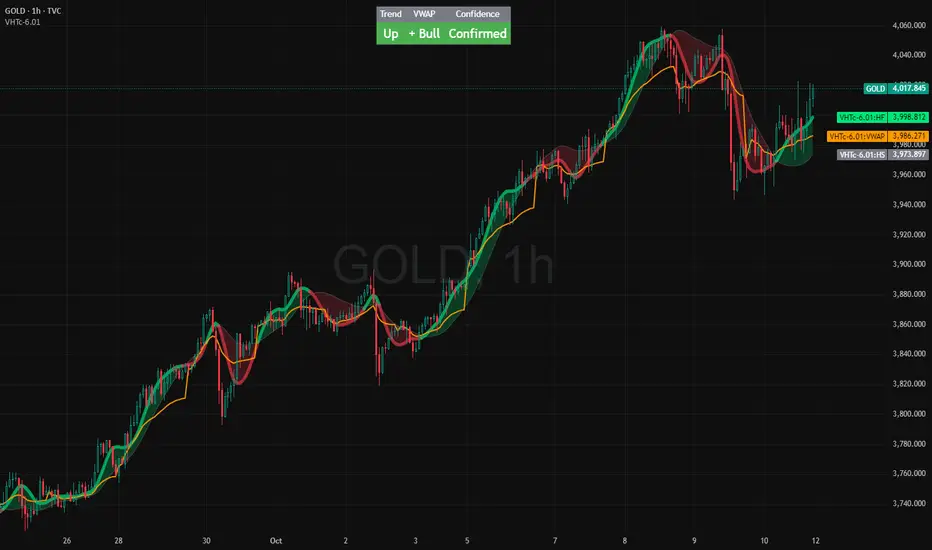
VWAP HMA Trends
It visually syncs Trend, VWAP, and Confidence — giving you instant clarity to trade with calm precision.
⚙️ The Three Core Gauges:
1. 📈 Trend Green for up, Red for down (Trend: Confirms direction)
2. 💰 VWAP Price vs. Volume Weighted Average Price. Institutional Fair Value. (Bull or Bear)
3. 🎯 Confidence Agreement between trend & VWAP. Dont fight the trend.
Bonus Feature: Confidence Turns 🟢 Confident when aligned, 🟡 Cautious when mixed.
Together, these create a clean, visual readout of the market’s health.
🧩 How to Use
Watch the Color Flow:
🟢 Green Cloud → Buyers in control.
🔴 Red Cloud → Sellers in control.
Check VWAP (Orange Line):
Price above VWAP → bullish strength.
Price below VWAP → bearish control.
Hovering at VWAP → indecision. Wait.
---
Act With Discipline:
Trade only when all gauges agree.
Add size only in Confident conditions.
Trim or tighten stops when it shifts to Cautious.
⚡ Quick Reference:
🟢 Green cloud + above VWAP + Confident | Uptrend continuation | Favor long bias
🔴 Red cloud + below VWAP + Confident | Downtrend continuation | Favor short bias
Mixed colors or Cautious: Wait or scale back
Cloud flips color: Possible shift. Reassess bias next bar
⚖️ Disclaimer: Educational and informational use only. Not financial advice. Always use independent judgment and position sizing.
Dominance Signal Apex [CHE]]Dominance Signal Apex — Triple-confirmed entry markers with stateful guardrails
Summary
This indicator focuses on entry timing by plotting markers only when three conditions align: a closed-bar Heikin-Ashi bias, a monotonic stack of super-smoother filters, and the current HMA slope. A compact state machine provides guardrails: it starts a directional state on closed-bar Heikin-Ashi bias, maintains it only while the smoother stack remains ordered, and renders a marker only if HMA slope agrees. This design aims for selective signals and reduces isolated prints during mixed conditions. Markers fade over time to visualize the age and persistence of the current state.
Motivation: Why this design?
Common triggers flip frequently in noise or react late when regimes shift. The core idea is to gate entry markers through a closed-bar state plus independent filter alignment. The state machine limits premature prints, removes markers when alignment breaks, and uses the HMA as a final directional gate. The result is fewer mixed-context entries and clearer clusters during sustained trends.
What’s different vs. standard approaches?
Reference baseline: Single moving-average slope or classic MA cross signals.
Architecture differences:
Multi-length two-pole super-smoother stack with strict ordering checks.
Closed-bar Heikin-Ashi bias to start a directional state.
HMA slope as a final gate for rendering markers.
Time-based alpha fade to surface state age.
Practical effect: Entry markers appear in clusters during aligned regimes and are suppressed when conditions diverge, improving selectivity.
How it works (technical)
Measurements: Four recursive super-smoother series on price at short to medium horizons. Up regime means each shorter smoother sits below the next longer one; down regime is the inverse.
State machine: On bar close, positive Heikin-Ashi bias starts a bull state and negative bias starts a bear state. The state terminates the moment the smoother ordering breaks relative to the prior bar.
Rendering gate: A marker prints only if the active state agrees with the current HMA slope. The HMA is plotted and colored by slope for context.
Normalization and clamping: Marker transparency transitions from a starting to an ending alpha across a fixed number of bars, clamped within the allowed range.
Initialization: Persistent variables track state and bar-count since state start; Heikin-Ashi open is seeded on the first valid bar.
HTF/security: None used. State updates are closed-bar, which reduces repaint paths.
Bands: Smoothed high, low, centerline, and offset bands are computed but not rendered.
Parameter Guide
Show Markers — Toggle rendering — Default: true — Hides markers without changing logic.
Bull Color / Bear Color — Visual colors — Defaults: bright green / red — Aesthetic only.
Start Alpha / End Alpha — Transparency range — Defaults: one hundred / fifty, within zero to one hundred — Controls initial visibility and fade endpoint.
Steps — Fade length in bars — Default: eight, minimum one — Longer values extend the visual memory of a state.
Smoother Length — Internal band smoothing — Default: twenty-one, minimum two — Affects computed bands only; not drawn.
Band Multiplier — Internal band offset — Default: one point zero — No impact on markers.
Source — Input for HMA — Default: close — Align with your workflow.
Length — HMA length — Default: fifty, minimum one — Larger values reduce flips; smaller values react faster.
Reading & Interpretation
Entry markers:
Bull marker (below bar): Closed-bar Heikin-Ashi bias is positive, smoother stack remains aligned for up regime, and HMA slope is rising.
Bear marker (above bar): Closed-bar Heikin-Ashi bias is negative, smoother stack remains aligned for down regime, and HMA slope is falling.
Fade: Transparency progresses over the configured steps, indicating how long the current state has persisted.
Practical Workflows & Combinations
Trend following: Focus on marker clusters aligned with HMA color. Add structure filters such as higher highs and higher lows or lower highs and lower lows to avoid counter-trend entries.
Exits/Stops: Consider exiting or reducing risk when smoother ordering breaks, when HMA color flips, or when marker cadence thins out.
Multi-asset/Multi-TF: Suitable for liquid crypto, FX, indices, and equities. On lower timeframes, shorten HMA length and fade steps for faster response.
Behavior, Constraints & Performance
Repaint/confirmation: State transitions and marker eligibility are decided on closed bars; live bars do not commit state changes until close.
security()/HTF: Not used.
Resources: Declared max bars back of one thousand five hundred; recursive filters and persistent states; no explicit loops.
Known limits: Some delay around sharp turns; brief states may start in noisy phases but are quickly revoked when alignment fails; HMA gating can miss very early reversals.
Sensible Defaults & Quick Tuning
Start here: Keep defaults.
Too many flips: Increase HMA length and raise fade steps.
Too sluggish: Decrease HMA length and reduce fade steps.
Markers too faint/bold: Adjust start and end alpha toward lower or higher opacity.
What this indicator is—and isn’t
A selective entry-marker layer that prints only under triple confirmation with stateful guardrails. It is not a full system, not predictive, and does not handle risk. Combine with market structure, risk controls, and position management.
Disclaimer
The content provided, including all code and materials, is strictly for educational and informational purposes only. It is not intended as, and should not be interpreted as, financial advice, a recommendation to buy or sell any financial instrument, or an offer of any financial product or service. All strategies, tools, and examples discussed are provided for illustrative purposes to demonstrate coding techniques and the functionality of Pine Script within a trading context.
Any results from strategies or tools provided are hypothetical, and past performance is not indicative of future results. Trading and investing involve high risk, including the potential loss of principal, and may not be suitable for all individuals. Before making any trading decisions, please consult with a qualified financial professional to understand the risks involved.
By using this script, you acknowledge and agree that any trading decisions are made solely at your discretion and risk.
Best regards and happy trading
Chervolino

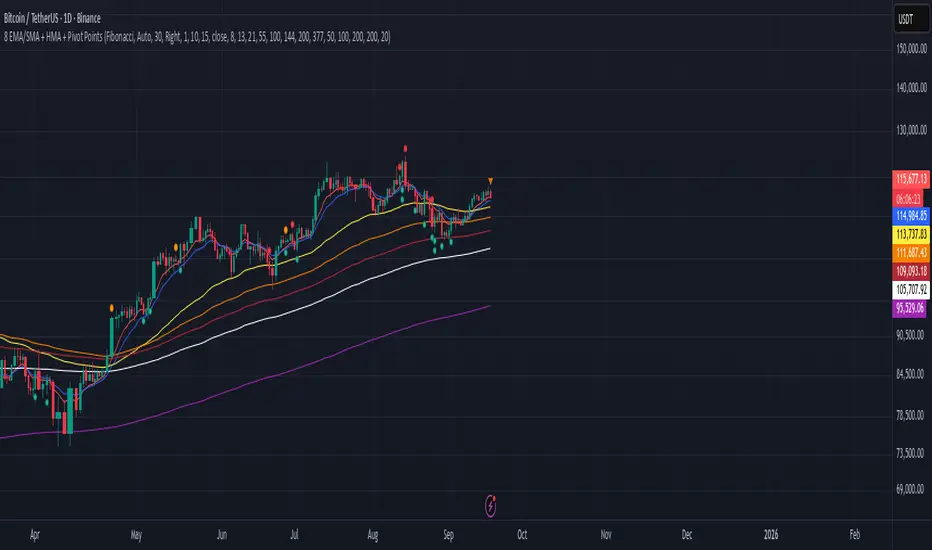
8 EMA/SMA + HMA + Pivot PointsMultiple customizeable Moing average indictors including Hall moving average, Exponential Moving average. Also includes Pivot Point indicator as an all-in-one indicator
Multiple Colored Moving AveragesMULTIPLE COLORED MOVING AVERAGES - USER GUIDE
DISCLAIMER
----------
Both the code and this documentation were created heavily using artificial intelligence. I'm lazy...
This indicator was inspired by repo32's "Moving Average Colored EMA/SMA" indicator. *
What is this indicator?
-----------------------
This is a TradingView indicator that displays up to 4 different moving averages on your chart simultaneously. Each moving average can be customized with different calculation methods, colors, and filtering options.
Why would I use multiple moving averages?
-----------------------------------------
- See trend direction across different timeframes at once
- Identify support and resistance levels
- Spot crossover signals between fast and slow MAs
- Reduce false signals with filtering options
- Compare how different MA types react to price action
What moving average types are available?
----------------------------------------
11 different types:
- SMA: Simple average, equal weight to all periods
- EMA: Exponential, more weight to recent prices
- WMA: Weighted, linear weighting toward recent data
- RMA: Running average, smooth like EMA
- DEMA: Double exponential, reduced lag
- TEMA: Triple exponential, even less lag
- HMA: Hull, fast and smooth combination
- VWMA: Volume weighted, includes volume data
- LSMA: Least squares, based on linear regression
- TMA: Triangular, double-smoothed
- ZLEMA: Zero lag exponential, compensated for lag
How do I set up the indicator?
------------------------------
Each MA has these settings:
- Enable/Disable: Turn each MA on or off
- Type: Choose from the 11 calculation methods
- Length: Number of periods (21, 50, 100, 200 are common)
- Smoothing: 0-10 levels of extra smoothing
- Noise Filter: 0-5% to ignore small changes
- Colors: Bullish (rising) and bearish (falling) colors
- Line Width: 1-5 pixels thickness
What does the smoothing feature do?
-----------------------------------
Smoothing applies extra calculations to make the moving average line smoother. Higher levels reduce noise but make the MA respond slower to price changes. Use higher smoothing in choppy markets, lower smoothing in trending markets.
What is the noise filter?
--------------------------
The noise filter ignores small percentage changes in the moving average. For example, a 0.3% filter will ignore any MA movement smaller than 0.3%. This helps eliminate false signals from minor price fluctuations.
When should I use this indicator?
---------------------------------
- Trend analysis: See if market is going up, down, or sideways
- Entry timing: Look for price bounces off MA levels
- Exit signals: Watch for MA slope changes or crossovers
- Support/resistance: MAs often act as dynamic levels
- Multi-timeframe analysis: Use different lengths for different perspectives
What are some good settings to start with?
-------------------------------------------
Conservative approach:
- MA 1: EMA 21 (short-term trend)
- MA 2: SMA 50 (medium-term trend)
- MA 3: SMA 200 (long-term trend)
- Low noise filtering (0.1-0.3%)
Active trading:
- MA 1: HMA 9 (very responsive)
- MA 2: EMA 21 (short-term)
- MA 3: EMA 50 (medium-term)
- Minimal or no smoothing
How do I interpret the colors?
------------------------------
Each MA changes color based on its direction:
- Bullish color: MA is rising (upward trend)
- Bearish color: MA is falling (downward trend)
- Gray: MA is flat or unchanged
What should I look for in crossovers?
-------------------------------------
- Golden Cross: Fast MA crosses above slow MA (bullish signal)
- Death Cross: Fast MA crosses below slow MA (bearish signal)
- Multiple crossovers in same direction can confirm trend changes
- Wait for clear separation between MAs after crossover
How do I use MAs for support and resistance?
---------------------------------------------
- In uptrends: MAs often provide support when price pulls back
- In downtrends: MAs may act as resistance on rallies
- Multiple MAs create support/resistance zones
- Stronger levels where multiple MAs cluster together
Can I use this with other indicators?
-------------------------------------
Yes, it works well with:
- Volume indicators for confirmation
- RSI or MACD for timing entries
- Bollinger Bands for volatility context
- Price action patterns for setup confirmation
What if I get too many signals?
-------------------------------
- Increase smoothing levels
- Raise noise filter percentages
- Use longer MA periods
- Focus on major crossovers only
- Wait for multiple MA confirmation
What if signals are too slow?
-----------------------------
- Reduce smoothing to 0
- Lower noise filter values
- Switch to faster MA types (HMA, ZLEMA, DEMA)
- Use shorter periods
- Focus on the fastest MA only
Which MA types work best in different markets?
----------------------------------------------
Trending markets: EMA, DEMA, TEMA (responsive to trends)
Choppy markets: SMA, TMA, HMA with smoothing (less whipsaws)
High volatility: Use higher smoothing and noise filtering
Low volatility: Use minimal filtering for better responsiveness
Do I need all the advanced features?
------------------------------------
No. Start with basic settings:
- Choose MA type and length
- Set colors you prefer
- Leave smoothing at 0
- Leave noise filter at 0
Add complexity only if needed to improve signal quality.
How do I know if my settings are working?
-----------------------------------------
- Backtest on historical data
- Paper trade the signals first
- Adjust based on market conditions
- Keep a trading journal to track performance
- Be willing to modify settings as markets change
Can I save different configurations?
------------------------------------
Yes, save different indicator templates in TradingView for:
- Different trading styles (scalping, swing trading)
- Different market conditions (trending, ranging)
- Different instruments (stocks, forex, crypto)

HMA super trade by @arkancapMulti-HMA with five customizable moving averages: visual colors, transparency via picker, flexible line styles, and label/alert for HMA50↔HMA100 crossovers. Lightweight, readable, and ready for trading templates.
Мульти-HMA с пятью настраиваемыми скользящими: визуальные цвета, прозрачность через пикер, гибкие стили линий и метка/алерт для пересечений HMA50↔HMA100. Лёгкий, читабельный и готовый к торговым шаблонам.
Five Hull moving averages that show the trend and indicate key crossovers. Customize colors, thickness, and get accurate alerts. Suitable for scalping and multi-timeframes. Support for filling between moving averages to visually highlight areas of strength or weakness.
Пять Hull-скользящих, которые показывают тренд и подсказывают ключевые пересечения. Настраивай цвета, толщину и получай аккуратные алерты. Подходит для скальпа и мульти-таймфрейма. Поддержка заливки между скользящими для наглядного выделения зон силы или слабости.

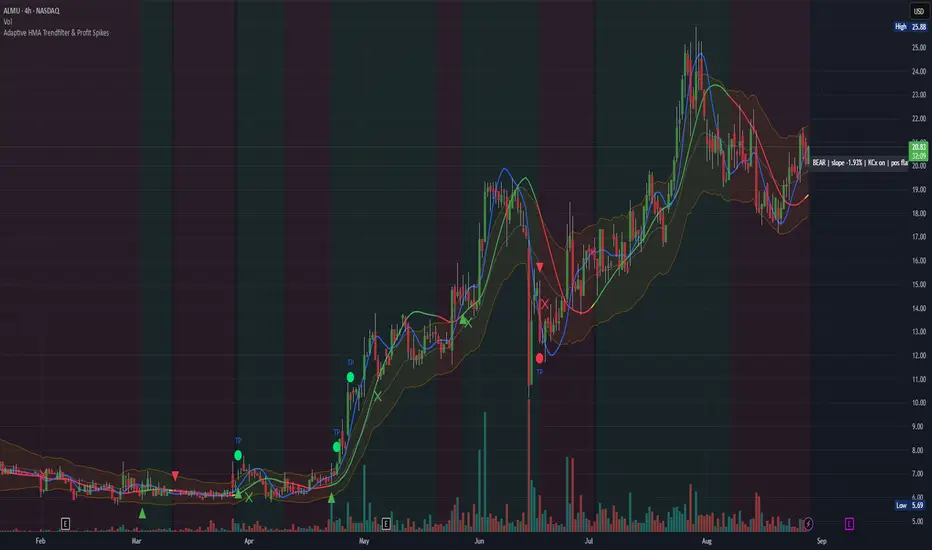
Adaptive HMA Trendfilter & Profit SpikesShort Description
Adaptive trend-following filter using Hull Moving Average (HMA) slope.
Includes optional Keltner Channel entries/exits and dynamic spike-based take-profit markers (ATR/Z-Score).
Optional Fast HMA for early entry visualization (not included in logic).
USER GUIDE:
1) Quick Overview
Trend Filter: Slow HMA defines Bull / Bear / Sideways (via slope & direction).
Entries / Exits:
Entry: Color change of the slow HMA (red→green = Long, green→red = Short), optionally filtered by the Keltner basis.
Exit: Preferably via Keltner Band (Long: Close under Upper Band; Short: Close above Lower Band).
Fallback: exit on opposite HMA color change.
Take-Profit Spikes: Marks abnormal moves (ATR, Z-Score, or both) as discretionary TP signals.
Fast HMA (optional): Purely visual for early entry opportunities; not part of the core trading logic (see §5).
2) Adding & Basic Setup
Add the indicator to your chart.
Open Settings (gear icon) and configure:
HMA: Slow HMA Length = 55, Slope Lookback = 10, Slope Threshold = 0.20%.
Keltner: KC Length = 20, Multiplier = 1.5.
Spike-TP: Mode = ATR+Z, ATR Length = 14, Z Length = 20, Cooldown = 5.
Optionally: enable Fast HMA (e.g., length = 20).
3) Input Parameters – Key Controls
Slow HMA Length: Higher = smoother, fewer but cleaner signals.
Slope Lookback: How far back HMA slope is compared against.
Slope Threshold (%): Minimum slope to avoid “Sideways” regime.
KC Length / Multiplier: Width and reactivity of Keltner Channels.
Exits via KC Bands: Toggle on/off (recommended: on).
Entries only above/below KC Basis: Helps filter out chop.
Spike Mode: Choose ATR, Z, or ATR+Z (stricter, fewer signals).
Spikes only when in position: TP markers show only when you’re in a trade.
4) Entry & Exit Logic
Entries
Long: Slow HMA turns from red → green, and (if filter enabled) Close > KC Basis.
Short: Slow HMA turns from green → red, and (if filter enabled) Close < KC Basis.
Exits
KC Exit (recommended):
Long → crossunder(close, Upper KC) closes trade.
Short → crossover(close, Lower KC).
Fallback Exit: If KC Exits are off → exit on opposite HMA color change.
Spike-TP (Discretionary)
Marks unusually large deviations from HMA.
Use for partial profits or tightening stops.
⚠️ Not auto-traded — only marker/alert.
5) Early Entry Opportunities (Fast HMA Cross – visual only)
The script can optionally display a Fast HMA (e.g., 20) alongside the Slow HMA (e.g., 55).
Bullish early hint: Fast HMA crosses above Slow HMA, or stays above, before the Slow HMA officially turns green.
Bearish early hint: opposite.
⚠️ These signals are not part of the built-in logic — they are purely discretionary:
Advantage: Earlier entries, more profit potential.
Risk: Higher chance of whipsaws.
Practical workflow (early long entry):
Fast HMA crosses above Slow HMA AND Close > KC Basis.
Enter small position with tight stop (under KC Basis or HMA swing).
Once Slow HMA confirms green → add to position or trail stop tighter.
6) Recommended Presets
Crypto (1h/2h):
HMA: 55 / 10 / 0.20–0.30%
KC: 20 / 1.5–1.8
Spikes: ATR+Z, ATR=14, Z=20, Cooldown 5
FX (1h/4h):
HMA: 55 / 8–10 / 0.10–0.25%
KC: 20 / 1.2–1.5
Indices (15m/1h):
HMA: 50–60 / 8–12 / 0.15–0.30%
KC: 20 / 1.3–1.6
Fine-tuning:
Too noisy? → Raise slope threshold or increase HMA length.
Too sluggish? → Lower slope threshold or shorten HMA length.
7) Alerts – Best Practice
Long/Short Entry – get notified when trend color switches & KC filter is valid.
Long/Short Exit – for KC exits or fallback exits.
Long/Short Spike TP – for discretionary profit-taking.
Set via TradingView: Create Alert → Select this indicator → choose condition.
8) Common Pitfalls & Tips
Too many false signals?
Raise slope threshold (more “Sideways” filtering).
Enable KC filter for entries.
Entries too late?
Use Fast HMA cross for early discretionary entries.
Or lower slope threshold slightly.
Spikes too rare/frequent?
More frequent → ATR mode or lower ATR multiplier / Z-threshold.
Rarer but stronger → ATR+Z with higher thresholds.
9) Example Playbook (Long Trade)
Regime: Slow HMA still red, Fast HMA crosses upward (early hint).
Filter: Close > KC Basis.
Early Entry: Small size, stop below KC Basis or recent swing low.
Confirmation: Slow HMA turns green → scale up or trail stop.
Management: Partial profits at Spike-TP marker; full exit at KC upper band break.
Dynamic Trend Bands [ChartPrime]The Dynamic Trend Bands is a versatile trend-following indicator that uses a double-smoothed Hull Moving Average (HMA) to detect market trends, combined with dynamic bands that provide insight into potential momentum shifts and volatility-based price zones.
⯁ KEY FEATURES
Double HMA Trend Filter
Utilizes a double-smoothed HMA for a smoother and more responsive trend line, reducing noise while highlighting clear market trends.
float base = ta.hma(ta.hma(close, length - 10), length)
Dynamic Volatility Bands
Plots upper and lower bands based on volatility, positioned above the price in a downtrend and below the price in an uptrend.
Momentum Shift Detection
Highlights bars in orange when a potential momentum shift occurs:
- During a downtrend, if the high breaks above the upper band.
- During an uptrend, if the low breaks below the lower band.
Customizable Band Appearance
Users can adjust the size, distance, and colors of the bands, as well as choose whether to display the mid-band line and fill the area between bands.
Timeframe Flexibility
Allows selection of different calculation timeframes, enabling traders to adapt the indicator to various trading strategies.
⯁ HOW TO USE
Identify Trend Direction
Use the double HMA line to confirm the prevailing trend:
- Above the bands: downtrend.
- Below the bands: uptrend.
Spot Potential Momentum Shifts
Watch for orange-highlighted bars signaling potential reversals or weakening trends.
Optimize Entries and Exits
Enter trades on trend continuation signals while using band breaks to spot potential reversal zones.
Customize to Fit Your Strategy
Adjust the bands’ size, distance, and calculation timeframe to suit scalping, swing, or position trading.
⯁ CONCLUSION
The Dynamic Trend Bands is an all-in-one tool that helps traders assess trend strength, detect momentum shifts, and identify key price zones. Its customizable features make it adaptable for various trading styles and market conditions.

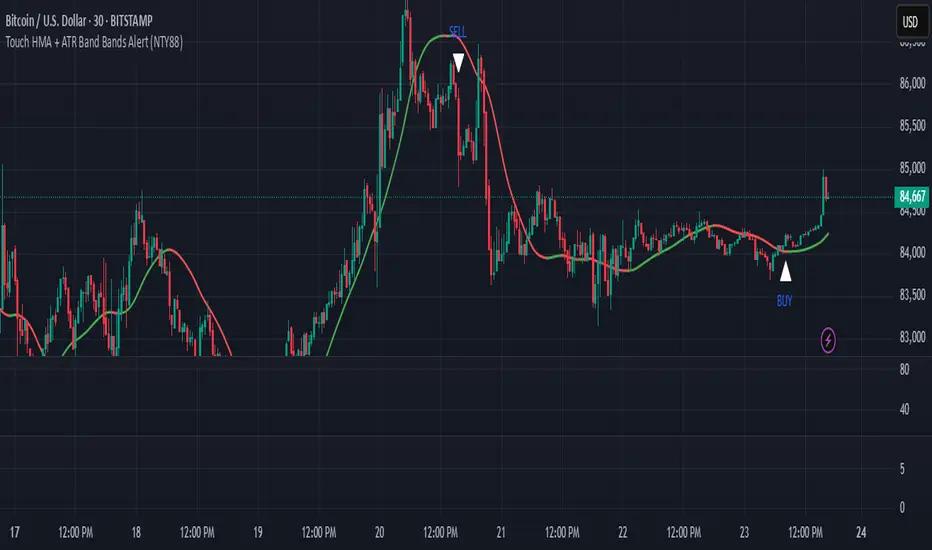
Touch HMA + ATR Band Bands Alert (NTY88)🔔 Precision Alerts | No Repainting | ATR-Based Touch Detection | HMA Trend Coloring
This script is a clean and powerful tool designed to help you catch precise market reversals using ATR Band touches combined with trend-following logic.
📌 How It Works
A custom Hull Moving Average (HMA) is used to track the trend.
Two dynamic ATR-based bands are drawn above and below the HMA.
A signal is generated when the closing price touches the upper or lower ATR band within a small tolerance zone.
✅ Key Features
🔁 Alternating Signals: Only one Buy → then one Sell → then Buy again. No signal spam.
🟢🔴 Color-Changing HMA Line: Green = HMA rising | Red = HMA falling
📏 Price Tolerance Input: Define how close the candle must be to the ATR band to trigger a signal.
🔔 Real-Time Alerts: Easily set alerts for Buy and Sell signals — works in live markets.
🚫 No Repainting: All signals are confirmed at candle close and will not change afterward.
🎯 When to Use
Great for trend reversals, scalping zones, or identifying potential exhaustion points.
Works well on any timeframe or market (crypto, stocks, forex).
💬 Pro Tip:
Combine this with RSI, Volume, or ADX filters to build a complete confluence system.
📈 Built for traders who love clean logic, precision entries, and visual clarity.
Triple HMA Colored [Chichomax]Triple HMA Colored Indicator Description
The Triple HMA Colored indicator is a sophisticated technical analysis tool designed to enhance trend identification by displaying three Hull Moving Averages (HMAs) on your chart, each with fully customizable periods and dynamic color settings. This indicator is built on the refined HMA calculation method, which leverages weighted moving averages (WMAs) to generate smooth and responsive trend lines with minimal lag.
Key Features:
- Triple HMA Setup:
Displays three HMAs, each computed with different, user-configurable periods, enabling multi-timeframe analysis in a single indicator.
- Dynamic Color Coding:
Each HMA line is color-coded based on its directional movement. When the current HMA value exceeds the previous value, the line is drawn in the designated "up" color, and when it falls below, it switches to the "down" color. This provides immediate visual cues for trend shifts.
- Customizable Inputs:
Users can adjust the period lengths for each of the three HMAs and select from six different color options (two for each HMA) directly from the indicator’s settings panel, ensuring that the tool can be tailored to match various trading strategies and visual preferences.
- Efficient Trend Detection:
By combining the speed of WMAs with the smoothness of the Hull Moving Average, this indicator offers a reliable method to detect market momentum changes, making it a valuable asset for both trend-following and counter-trend strategies.
Ideal for traders who demand flexibility and clarity in their chart analysis, the Triple HMA Colored indicator simplifies the process of tracking market trends across multiple timeframes while providing clear, visual signals for potential entry and exit points.

BK Multiple MA, RMA, SMA, HMA, VWAP, Rolling VWAP **Indicator Description**
I’m incredibly proud to introduce my third indicator to the TradingView community: **BK Multiple MA with HMA, VWAP, and Rolling VWAP**! This tool has been a game-changer in my trading strategy, and I’m excited to share it with others who are navigating the markets.
This indicator holds a special place in my heart because it represents the first technical analysis concept introduced to me by my mentor when I began apprenticing under him. His wisdom, guidance, and passion for trading—and for life—left an indelible mark on my journey. I dedicate this work, and every indicator I introduce, to the foundation he helped me build, while giving glory first and foremost to God.
**Moving Averages (MAs)** are one of the most widely used tools in technical analysis, and this indicator takes them to the next level. It allows you to plot **six fully customizable moving averages simultaneously**, with options including:
- **Exponential Moving Average (EMA)**
- **Simple Moving Average (SMA)**
- **Relative Moving Average (RMA)**
- **Hull Moving Average (HMA)**
- **Volume Weighted Average Price (VWAP)**
- **Rolling VWAP**
This flexibility makes the indicator highly versatile, whether you’re a day trader, swing trader, or long-term investor. By customizing periods, colors, and line widths for each MA, you can tailor the indicator to perfectly suit your trading style.
**Key Features**
1. **Six Fully Customizable MAs**:
- Adjust periods, line colors, and widths to match your preferences.
- Select from EMA, SMA, RMA, HMA, VWAP, or Rolling VWAP for each line.
2. **Unique Rolling VWAP Option**:
- Rolling VWAP calculates the volume-weighted average price over a user-defined period, such as 200 candles.
- This feature is ideal for traders seeking volume-weighted levels that don’t reset with each session, making it invaluable for trend-following and swing trading.
3. **HMA for Smoother Trends**:
- The Hull Moving Average (HMA) is designed to reduce lag and provide a responsive, noise-free view of price trends.
- It’s a powerful tool for spotting reversals and confirming directional momentum.
4. **Session VWAP**:
- Traditional VWAP resets with each trading session, making it a reliable benchmark for intraday support and resistance levels.
**How It Works**
- **VWAP**: Reflects the average price weighted by volume for the current trading session, commonly used by institutional traders to identify key price levels.
- **Rolling VWAP**: Extends VWAP functionality by calculating over a user-defined period, allowing for flexible multi-timeframe analysis.
- **HMA**: A fast, smooth moving average that reacts quickly to price changes while filtering out noise.
The combination of these options provides traders with a comprehensive view of market dynamics, enabling better decision-making.
**Final Thoughts**
This indicator is deeply meaningful to me because it represents the first concept my mentor introduced when I began apprenticing under him. His wisdom, guidance, and passion for trading—and for life—left an indelible mark on my journey. I dedicate this work, and every indicator I introduce, to the foundation he helped me build, while giving glory first and foremost to God.
If this indicator helps you succeed, I humbly ask that you honor the blessings in your life by giving back—whether through acts of kindness, philanthropy, or helping others in need.
May the Almighty guide us all toward wisdom and success in our endeavors. All glory belongs to God!
Wave Smoother [WS]The Wave Smoother is a unique FIR filter built from the interaction of two trigonometric waves. A cosine carrier wave is modulated by a sine wave at half the carrier's period, creating smooth transitions and controlled undershoot. The Phase parameter (0° to 119°) adjusts the modulating wave's phase, affecting both response time and undershoot characteristics. At 30° phase the impulse response starts at 0.5 and exhibits gentle undershoot, providing balanced smoothing. Higher phase values reduce ramp-up time and increase undershoot - this undershoot in the impulse response creates overshooting behavior in the filter's output, which helps reduce lag and speed up the response. The default 70° phase setting provides maximum speed while maintaining stability, though practical settings can range from 30° to 70°. The filter's impulse response consists entirely of smooth curves, ensuring consistent behavior across all settings. This design offers traders flexible control over the smoothing-speed trade-off while maintaining reliable signal generation.

HMA Buy Sell Signals - Profit ManagerNote : Settings should be adjusted according to the selected time frame. Try to find the best setting according to the profitability rate
Overall Functionality
This script combines several trading tools to create a comprehensive system for trend analysis, trade execution, and performance tracking. Users can identify market trends using specific moving averages and RSI indicators while managing profit and loss levels automatically.
Trend Detection and Trade Signals
Hull Moving Averages (HMA):
Two HMAs (a faster one and a slower one) are used to determine the market trend.
A buy signal is generated when the faster HMA crosses above the slower HMA.
Conversely, a sell signal is triggered when the faster HMA crosses below the slower one.
Visual Feedback:
Trend lines on the chart change color to reflect the trend direction (e.g., green for upward trends and red for downward trends).
Trade Levels and Management
Entry, Take-Profit, and Stop-Loss Levels:
When the trend shifts upwards, the script calculates entry, take-profit, and stop-loss levels based on the opening price.
Similarly, for downward trends, these levels are determined for short trades.
Commission Tracking:
Each trade includes a commission cost, which is factored into net profit and loss calculations.
Dynamic Labels:
Entry, take-profit, and stop-loss levels are visually marked on the chart for easier tracking.
Performance Tracking
Profit and Loss Tracking:
The script keeps a running total of profits, losses, and commissions for both long and short trades.
It also calculates the net profit after all costs are considered.
Performance Table:
A table is displayed on the chart summarizing:
The number of trades.
Total profit and loss for long and short positions.
Commission costs.
Net profit.
Fractal Support and Resistance
Dynamic Lines:
The script identifies the most recent significant highs and lows using fractals.
It draws support and resistance lines that automatically update as new fractals form.
Simplified Visuals:
The chart always shows the last two support and resistance lines, keeping the visualization clean and focused.
RSI-Based Signals
Overbought and Oversold Levels:
RSI is used to identify overbought (above 80) and oversold (below 20) conditions.
The script generates buy signals at oversold levels and sell signals at overbought levels.
Chart Indicators:
Arrows and labels appear on the chart to highlight these RSI-based opportunities.
Customization
The script allows users to customize key parameters such as:
Moving average lengths for trend detection.
Take-profit and stop-loss percentages.
Timeframes for backtesting.
Starting capital and commission rates.
Conclusion
This script is a versatile tool for traders, combining trend detection, automated trade management, and visual feedback. It simplifies decision-making by providing clear signals and tracking performance metrics, making it suitable for both beginners and experienced traders.
* The most recently drawn fractals represent potential support and resistance levels. If the price aligns with these levels at the time of entering a trade, it may indicate a likelihood of reversal. In such cases, it’s advisable to either avoid entering the trade altogether or proceed with increased caution.

Moving AveragesWhile this "Moving Averages" indicator may not revolutionize technical analysis, it certainly offers a valuable and efficient solution for traders seeking to streamline their chart analysis process. This all-in-one tool addresses a common frustration among traders: the need to constantly search for and compare different types and lengths of moving averages.
Key Features
The indicator allows for the configuration of up to 5 moving averages simultaneously, providing a comprehensive view of price trends. Users can choose from 7 types of moving averages for each line, including SMA, EMA, WMA, VWMA, HMA, SMMA, and TMA. This variety ensures that traders can apply their preferred moving average types without the need for multiple indicators.
Each moving average can be fully customized in terms of length, color, line style, and thickness, allowing for clear visual differentiation. However, what sets this indicator apart is its "Smart Opacity" feature. When activated, this option dynamically adjusts the transparency of the moving average lines based on their direction, with ascending lines appearing more opaque and descending lines more transparent. This subtle yet effective visual cue aids in quickly identifying trend changes and potential trading signals.
Advantages
The primary benefit of this indicator lies in its convenience. By consolidating multiple moving averages into a single, customizable tool, it saves traders valuable time and reduces chart clutter. The Smart Opacity feature, while not groundbreaking, does offer an intuitive way to visualize trend strength and direction at a glance.
Moreover, the indicator's flexibility makes it suitable for various trading styles and experience levels. Whether you're a novice trader learning to interpret basic trend signals or an experienced analyst fine-tuning a complex strategy, this tool can adapt to your needs.
In conclusion, while this "Moving Averages" indicator may not be a game-changer in the world of technical analysis, it represents a thoughtful refinement of a fundamental trading tool. By focusing on user convenience and visual clarity, it offers a practical solution for traders looking to optimize their chart analysis process and make more informed trading decisions.

HMA Fibonacci Rainbow Waves[FibonacciFlux]HMA Fibonacci Rainbow Waves
Overview
The HMA Fibonacci Rainbow Waves script is designed for traders who strive for simplicity in their trading strategies while navigating the complexities of chart analysis. By utilizing the Hull Moving Average (HMA) for smoothing, this indicator provides a refined view of price action. However, over-smoothing can sometimes filter out essential market noise. To address this, the indicator incorporates a unique approach by applying Fibonacci weighting to seven HMA200 calculations. This enables traders to capture noise while effectively following market trends.
BTCUSDT 4hour
Key Features
1. Hull Moving Average (HMA)
- The HMA is known for its responsiveness and ability to filter out noise, providing a clear view of the underlying trend.
- The indicator balances smoothness with responsiveness, making it suitable for various trading styles, from day trading to swing trading and scalping.
2. Fibonacci Weighting
- By applying Fibonacci numbers to the HMA calculations, the indicator enhances its ability to adapt to market dynamics.
- This unique approach allows traders to maintain clarity while accommodating fluctuations in price action, ensuring they do not miss critical entry points.
3. Multi-Timeframe Functionality
- The HMA Fibonacci Rainbow Waves indicator operates effectively across multiple timeframes, including daily, 4-hour, 5-minute, and 1-minute charts.
- This adaptability makes it a valuable tool for traders, regardless of their preferred trading style, facilitating seamless transitions between different market conditions.
4. Noise Capture and Trend Following
- The indicator is designed to capture essential market movements while filtering out excessive noise.
- It helps traders follow trends without being overwhelmed by market fluctuations, allowing them to act on advantageous entry conditions that might otherwise be obscured.
Signal Generation and Alerts
- The indicator generates buy and sell signals based on the relationship between the HMAs, providing clear entry and exit points.
- Customizable alerts keep traders informed of significant changes in market conditions, enabling timely decisions that reflect the nuances of market behavior.
BTCUSDT 15min
Benefits
1. Simplified Trading Approach
- Traders can focus on core market movements without being distracted by excessive noise, enhancing decision-making efficiency and minimizing emotional trading.
2. Flexibility Across Timeframes
- The ability to function across different timeframes allows traders to apply the same principles in various trading scenarios, from quick scalps to strategic swing trades.
3. Enhanced Market Insights
- The combination of HMA smoothing and Fibonacci weighting offers a comprehensive view of market trends, aiding traders in identifying potential opportunities, including those that institutional investors might exploit.
4. Resolving Complexity with Simplicity
- This indicator elegantly bridges the gap between simplicity and complexity, providing a single tool that addresses the inherent contradictions in trading psychology. It allows traders to simplify their strategies while still capturing the dynamic nature of the market.
BTCUSDT 1min
Conclusion
The HMA Fibonacci Rainbow Waves script is a powerful tool for traders seeking to streamline their analysis while effectively capturing market dynamics. By integrating advanced smoothing techniques with Fibonacci weighting, this indicator empowers traders to follow market trends confidently across various timeframes. Its design makes it an essential asset for both novice and experienced traders alike, offering insights that can reveal entry points often missed by traditional indicators.
Open Source Collaboration
This script is released as an open-source project on TradingView, inviting the global trading community to contribute and enhance its functionality. By collaborating on this project, traders can help improve its capabilities, ensuring it remains a valuable resource for market participants around the world.
Important Note
As with any trading tool, it is crucial to conduct thorough analysis and risk management when using this indicator. Past performance does not guarantee future results, and traders should always be prepared for potential market fluctuations.

Multi-Average Trend Indicator (MATI)[FibonacciFlux]Multi-Average Trend Indicator (MATI)
Overview
The Multi-Average Trend Indicator (MATI) is a versatile technical analysis tool designed for traders who aim to enhance their market insights and streamline their decision-making processes across various timeframes. By integrating multiple advanced moving averages, this indicator serves as a robust framework for identifying market trends, making it suitable for different trading styles—from scalping to swing trading.
MATI 4-hourly support/resistance
MATI 1-hourly support/resistance
MATI 15 minutes support/resistance
MATI 1 minutes support/resistance
Key Features
1. Diverse Moving Averages
- COVWMA (Coefficient of Variation Weighted Moving Average) :
- Provides insights into price volatility, helping traders identify the strength of trends in fast-moving markets, particularly useful for 1-minute scalping .
- DEMA (Double Exponential Moving Average) :
- Minimizes lag and quickly responds to price changes, making it ideal for capturing short-term price movements during volatile trading sessions .
- EMA (Exponential Moving Average) :
- Focuses on recent price action to indicate the prevailing trend, vital for day traders looking to enter positions based on current momentum.
- KAMA (Kaufman's Adaptive Moving Average) :
- Adapts to market volatility, smoothing out price action and reducing false signals, which is crucial for 4-hour day trading strategies.
- SMA (Simple Moving Average) :
- Provides a foundational view of the market trend, useful for swing traders looking at overall price direction over longer periods.
- VIDYA (Variable Index Dynamic Average) :
- Adjusts based on market conditions, offering a dynamic perspective that can help traders capture emerging trends.
2. Combined Moving Average
- The MATI's combined moving average synthesizes all individual moving averages into a single line, providing a clear and concise summary of market direction. This feature is especially useful for identifying trend continuations or reversals across various timeframes .
3. Dynamic Color Coding
- Each moving average is visually represented with color coding:
- Green indicates bullish conditions, while Red suggests bearish trends.
- This visual feedback allows traders to quickly assess market sentiment, facilitating faster decision-making.
4. Signal Generation and Alerts
- The indicator generates buy signals when the combined moving average crosses above its previous value, indicating a potential upward trend—ideal for quick entries in scalping.
- Conversely, sell signals are triggered when the combined moving average crosses below its previous value, useful for exiting positions or entering short trades.
Insights and Applications
1. Scalping on 1-Minute Charts
- The MATI excels in fast-paced environments, allowing scalpers to identify quick entry and exit points based on short-term trends. With dynamic signals and alerts, traders can react swiftly to price movements, maximizing profit potential in brief price fluctuations.
2. Day Trading on 4-Hour Charts
- For day traders, the MATI provides essential insights into intraday trends. By analyzing the combined moving average and its relation to individual moving averages, traders can make informed decisions on when to enter or exit positions, capitalizing on daily price swings.
3. Swing Trading on Daily Charts
- The MATI also serves as a valuable tool for swing traders. By evaluating longer-term trends through the combined moving average, traders can identify potential swing points and adjust their strategies accordingly. The flexibility of adjusting the lengths of the moving averages allows for tailored approaches based on market volatility.
Benefits
1. Clarity and Insight
- The combination of diverse moving averages offers a clear visual representation of market trends, aiding traders in making informed decisions across multiple timeframes.
2. Flexibility and Customization
- With adjustable parameters, traders can adapt the MATI to their specific strategies, making it suitable for various market conditions and trading styles.
3. Real-Time Alerts and Efficiency
- Built-in alerts minimize response times, allowing traders to capitalize on opportunities as they arise, regardless of their trading style.
Conclusion
The Multi-Average Trend Indicator (MATI) is an essential tool for traders seeking to enhance their technical analysis capabilities. By seamlessly integrating multiple moving averages with dynamic color coding and real-time alerts, this indicator provides a comprehensive approach to understanding market trends. Its versatility makes it an invaluable asset for scalpers, day traders, and swing traders alike.
Important Note
As with any trading tool, thorough analysis and risk management are crucial when using this indicator. Past performance does not guarantee future results, and traders should always be prepared for market fluctuations.

Adaptive Fibonacci Trend Ribbon[FibonacciFlux]Adaptive Fibonacci Trend Ribbon (FibonacciFlux)
Overview
The Adaptive Fibonacci Trend Ribbon is a versatile technical analysis tool designed for traders who want to leverage the power of multiple moving averages while integrating Fibonacci numbers. This indicator provides a dynamic visual representation of market trends, enhancing decision-making processes in trading.
Key Features
1. Multi-Moving Averages
- The indicator calculates eight different moving averages based on user-defined periods, including Fibonacci numbers such as 5, 8, 13, 21, 34, 55, 89, and 144.
- Traders can choose from various moving average types, including EMA, HMA, WMA, VWMA, ALMA, SMA, RMA, and TMA , allowing for tailored analysis based on market conditions.
2. Trend Detection
- Each moving average is color-coded based on its trend direction, with green indicating an upward trend and red indicating a downward trend.
- This visual clarity helps traders quickly assess market sentiment and make informed decisions.
3. Fill Areas for Enhanced Insight
- The indicator features fill areas between the moving averages, which dynamically change color according to their relative positions.
- This provides a clear visual cue of trend strength and potential reversal points, allowing traders to identify key areas of interest.
4. Customizable Inputs
- Users can easily adjust the source data, moving average lengths, and ALMA parameters (offset and sigma) to fit their trading strategies.
- This flexibility ensures that traders can adapt the tool to various market conditions and personal preferences.
Insights and Applications
1. Fibonacci Integration
- By incorporating Fibonacci numbers into the moving average periods, this indicator allows traders to align their strategies with key levels of support and resistance.
- This can enhance the accuracy of entry and exit points, particularly in trending markets.
2. Trend Continuation and Reversal Analysis
- The adaptive nature of the moving averages provides insights into potential trend continuations or reversals.
- Traders can use the indicator to identify when to enter or exit positions based on the interaction between the moving averages.
3. Visual Clarity for Quick Decisions
- The color-coded moving averages and fill areas offer immediate visual feedback on market conditions, helping traders react swiftly to changing dynamics.
- This is especially useful in fast-moving markets where timely decisions are critical.
Conclusion
The Adaptive Fibonacci Trend Ribbon is an essential tool for traders looking to enhance their technical analysis capabilities. By combining multiple moving averages with Fibonacci integration and dynamic visual cues, this indicator offers a robust framework for understanding market trends. Its flexibility and clarity make it an invaluable asset for both novice and experienced traders alike.
Open Source Contribution
This indicator is open source, inviting contributions and improvements from the trading community. Feel free to fork, enhance, and share your insights with the world, helping to foster a collaborative environment for traders everywhere.
