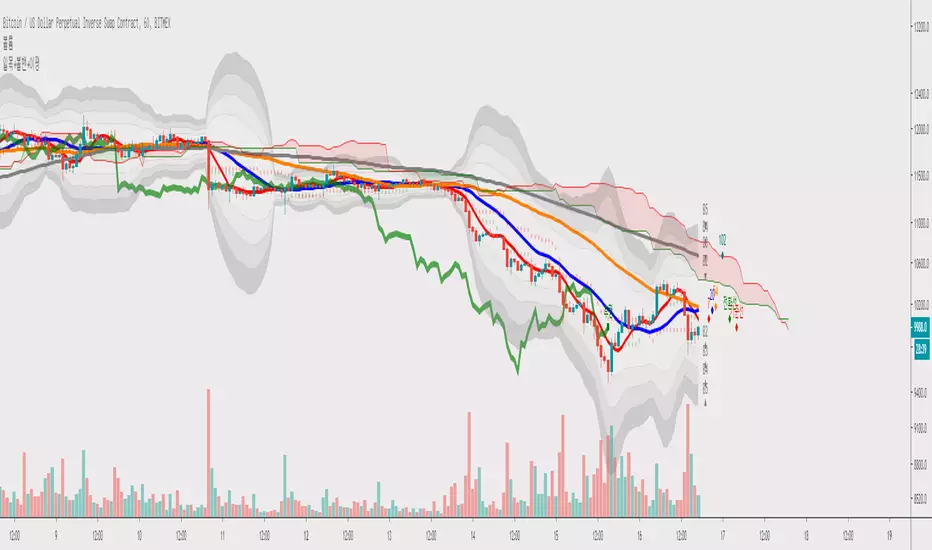
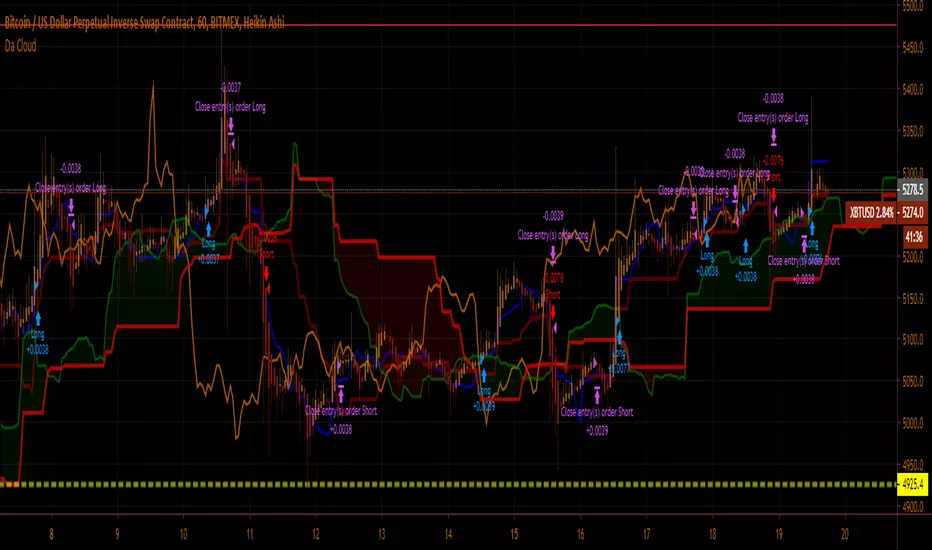
Triple Timeframe IchimokuVi presento il Triple Timeframe Ichimoku.
Questo indicatore applica tre Ichimoku completi al vostro grafico usando fino a ben 3 timeframe diversi:
Timeframe Attuale (quello impostato sul grafico che state visualizzando)
Timeframe B (personalizzabile tra i seguenti TF : 1m, 5m, 15m, H1, H2, H4, D, W, M)
Timeframe C (personalizzabile tra i seguenti TF : 1m, 5m, 15m, H1, H2, H4, D, W, M)
Il risultato è quello di avere immediatamente sott'occhio l'andamento dei prezzi senza dover fare zapping tra i vari timeframe: tutto chiaro subito!
L'indicatore è completamente personalizzabile, potete infatti:
Decidere quanti (da 1 a 3) e quali Ichimoku visualizzare
Scegliere per ogni Ichimoku se visualizzare o meno le linee dell'indicatore (Tenkan, Kijun e Laggin)
Scegliere per ogni Ichimoku se visualizzare o meno le nuvole dell'indicatore (SSA, SSB e Kumo)
Personalizzare i colori di ogni singola linea di ogni singolo Ichimoku
L'indicatore è estremamente utile per strategie basare sull'indicatore Ichimoku che richiedono il controllo su diversi Timeframe.
Buon trading a tutti!
سحابة إيتشيموكو
Wobbly (Swing) This Script contain ichimoku's Cloud, Kijunsan, Takensan in multi different Time_Frames ( 30', 60', 240', 1D ) as Resistance and Support
It is useful for Swing in time_frames less than 1H
You can easily understand which line related to which time_frame by Width of lines ( Thicker lines shows Higher Time_Frame )
U can also disable the one might not useful for u on Settings
HoPe U aLl EnJoY NeW_YeAr & This ScRiPt
Ichimoku Cloud - AppachaniSimple Ichimoku Strategy Build for Zenbot - Kumo Breakouts and Tenkan Kijun Crossover for Signals
Thank You - Amal Appachan Abraham for your inspiration
Ichimoku signals by Jean-Philippe COQINDICATORS:
Show Yellow zone when oversold/overbought
Show splits : white when to come, yellow when occurs, red when flat with ssb, blue when flat with ssb and kj
Show probable range when appears in white lines
Show last higher highs lower lows in orange lines
Show probable next Kj values in thin aqua lines
checkChikou = blue diamond on price when close to chikou in TF or upper one
checkVol = show "V" when volume is higher than last 9 periods avg
checkRot = show "Z" when potential partial rotation in range is at work
checkHaram = take Harami pattern into account
SIGNALS (when ichimoku meet candle patterns)
L/H = rebound signals on higher highs / Lower Lows
C = potential rebound on overbought oversold zone
R = rebound signal on range edges
P = pullback rebound after break out of probable range
K = rebound on Kj in a trend (out of range)
Trend following and reversal strategy for cryptoThe idea of this indicator comes from Jim Brown's book.
using the "MACD Platinum" and "QQE advanced" and multi-timeframe.
The difference to the original idea is that I use Ichimoku cloud for trend detection.
13/21 EMA + Ichimoku Kinko Hyo StrategyThis trading strategy uses combination of the Ichimoku Kinko Hyo system with Fibonacci numbers based 13/21 exponential moving average ( EMA ) crossover, giving excellent results in trending assets !
EMA + Ichimoku Kinko Hyo StrategyThis trading strategy uses combination of the Ichimoku Kinko Hyo system with Fibonacci numbers based exponential moving average(EMA) and RSI 12/24 crossover, giving excellent results in trending stocks !
Ichimoku Cloud [Eric]Phase 1: Ichimoku Cloud
Phase 2: Dynamic Ichimoku Cloud
Phase 3: Artificial Intelligence Ichimoku Cloud
Combination Ichimoku CloudThis indicator allows you to display two Ichimoku Cloud settings simultaneously. Each variable can be set independently, including its visibility.
Basically a way to combine two "Ichimoku Cloud" indicators into one slot.
Quad Moving Avarage-Ichimoku Cloud-ALMA-Bollinger BandsAll-in-One
Ingradients:
* Ichimoku Cloud,
* 2 Simple Moving Avarage (SMA),
* 2 Exponential Moving Avarage (EMA),
* 2 Arnoud Legoux Moving Avarage (ALMA),
* Bollinger Bands and
* Volume Based Colored Bars (developed by KIVANÇ fr3762).
Compiled for limitations. Thank you.
Trend Master CryptoFeatures:
Show price trend very clearly.
Mark entry signals on candles.
Getting Started:
Green candle is time to buy or long.
Red candle is time to sell or short.
Set your stoploss around cloud upper or lower ranges.
Contributing:
You can report bugs or issues under this page.
Any advice would be helpful for improving this indicator's accuracy.
Application:
This is an invite only indicator.
[astropark] Power Tools Overlay//******************************************************************************
// Power Tools Overlay
// Inner Version 1.2 20/12/2018
// Developer: iDelphi
// Developer: astropark (Ichimoku Cloud), SMA EMA & Cross tools
//------------------------------------------------------------------------------
// 21/11/2018 Added EMA SMA WMA
// 21/11/2018 Added SMA-EMA EMA-WMA WMA-SMA (Thanks to mariobros1 for the idea of the Simultaneous MA)
// 21/11/2018 Added Bollinger Bands
// 21/11/2018 Added Ichimoku Cloud (Thanks to astropark for all the code of the Ichimoku Cloud)
// 23/11/2018 Show all the indicator as default
// 23/11/2018 Added a cross when single Moving Averages crossing (Thanks to astropark for the idea)
// 24/11/2018 Descriptions Fix
// 24/11/2018 Added Option to enable/disable all Moving Averages
// 10/12/2018 Added EMAs and Crosses
//******************************************************************************
CryptocloudHere's a cloud witn both, original & crypto settings.
I had to make some little tweaks in order to get the cloud accurate.
Works well & has more fun in low timeframes. 3D effect :)
two Ichimoku ITNG
with this indicator you can have 2 ichimoku clouds on chart
first one with chart timeframe
and second one with your choosen timeframe
Enjoy
two Ichimoku ITNG
with this indicator you can have 2 ichimoku clouds on chart
first one with chart timeframe
and second one with your choosen timeframe
Enjoy
Ichimoku Strategy(lirshah)The Ichimoku Cloud, also known as Ichimoku Kinko Hyo, is a versatile indicator that defines support and resistance, identifies trend direction, gauges momentum and provides trading signals.
this strategy has been written according to cloud and has good results on crypto currencies pairs and some other Forex pairs.
CryptologicxThis script includes the following indicators:
Bollinger Bands
SMA 5 10 20 50 100 200
EMA 14 50 55 100 200
HMA 20 / 50
Ichimoku Cloud
The MA have fixed inputs, if you wish to see different you can contact me.
Ichimoku Cloud + 3MASimple combination of Ichimoku and 3 moving averages. You can show/hide the MA's change their types and sources
[Delphi] Power Tools OverlayFEATURE
3EMA 3MA 3WMA 3MA-3EMA 3EMA-3WMA 3WMA-3MA
Bollinger Bands
Ichimoku Cloud
//******************************************************************************
// Power Tools Overlay
// Inner Version 1.0 21/11/2018
// Developer: iDelphi
// Developer: astropark (Ichimoku Cloud)
//------------------------------------------------------------------------------
// 21/11/2018 Added EMA MA WMA
// 21/11/2018 Added MA-EMA EMA-WMA WMA-MA (Thanks to mariobros1 for the idea of the Simultaneous MA)
// 21/11/2018 Added Bollinger Bands
// 21/11/2018 Added Ichimoku Cloud (Thanks to astropark for all the code of the Ichimoku Cloud)
//******************************************************************************
JPCOQ Ichimoku V2INDICATORS:
Show Yellow zone between price and tenkan when oversold/overbought
Show splits : white when to come, yellow when occurs, red when occurs with a flat Senkou Span B, blue when occurs with a flat Senkou Span B and kijun
Show probable range in white lines
Show last higher highs & lower lows in orange lines
SIGNALS (when ichimoku meet candle patterns)
L/H = rebound signals on higher highs / Lower Lows, target can be lower kj flat
C = potential rebound on overbought oversold zone, target can be lower kj flat
R = rebound signal on range edges, target can be last split
B = pullback/throwback rebound after break out of probable range, target can be last higher high (lower low)
K = rebound on Kj in a trend (out of range), target can be last higher high (lower low)
OTHER PARAMETERS
checkHaram = take Harami pattern into account
CheckallCandle = include all candle patterns
checkVol = show "V" when volume is higher than last 9 periods average
showFuture = next kijun/ssa/ssb values in thin lines
closeToChikou = the greater the value close to ichimoku lines is the test
showChikou = red cross on price when close to chikou in TF or upper one
Flatlen = bars of same value to validate an ichimoku flat
CheckSignal1 = check and show upper TF signals => manual check because not perfect, to unset when study error message !!
ShowEntry = green buy signal (red sell) when buy signal and chikou free and ratio >=2