مؤشر Pine Script®
سحابة إيتشيموكو

All in one indicator[psyche_ky]main indicator with mother B.B theory.
this indicator has MA / EMA , ichimoku , Basic Bollinger Band and Mother band theory.
مؤشر Pine Script®

Ichi Trend Follow SystemBased on RSI, CCI, and Ichimoku Cloud. Bars are colored according to bullish or bearish potential.
مؤشر Pine Script®

مؤشر Pine Script®

استراتيجية Pine Script®

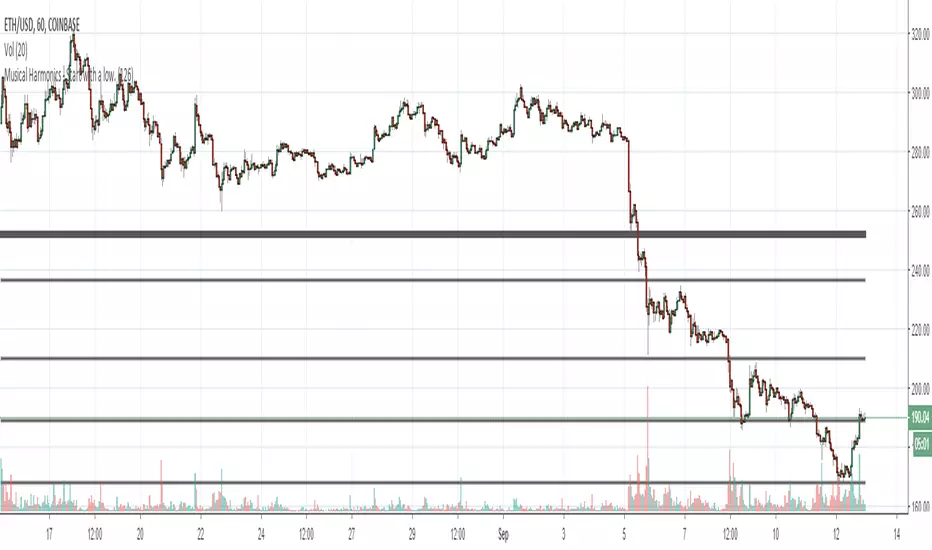
Musical Harmonics - Start with a low.Octaves double from one octave to another, so start with octaves beginning with the number one, for example:
1 doubled is 2, 2 doubled is 4, 4 double is 8 and then we go on to this sequence:
1,2,4,8,16,32,64,126,256,512,1024,2048,etc,etc
Find one of the numbers near a range, so for example on this chart Ethereum was trading at 190.31. That price is in between the octaves of 126 and 256. The number I use as the low for the indicator is 126.
Working on updating with labels and such
مؤشر Pine Script®
استراتيجية Pine Script®

استراتيجية Pine Script®

مؤشر Pine Script®

مؤشر Pine Script®

EMA analysis with Stoch OverSold/Bought indicator + IchimokuThe script will analyze trend around EMAs (configurable periods) and let you know when to short or long the market.
It will also tell you when there is a Overbought / Oversold Cross over Stochastic indicator
The script also includes a Ichimoku cloud so you can add this to your analysis for a trading action.
There will be more indicators coming into this script since im constantly working on Trading view scripts and analysing new strategys.
If you want access to it, contact me. (Its not free but also not expensive)
Best Regards.
مؤشر Pine Script®

Covengers Ichimoku Cloud ver 0.4Covegers Ichimoku Cloud ver 0.4 Released !
Middle Price Line Updated !
IF,
High Price Line head Downward = Sell
Low Price Line head Upward = Buy
EASY WORK.
//
코벤져스 일목구름 0.4 버전이 출시되었습니다.
중간값 선이 추가되었습니다.
만약,
고가의 중간선이 하향한다면 매도
저가의 중간선이 상향한다면 매수
정말 간단한 개념인데 결과가 재밌습니다.
0.41 버전이 추가업데이트 될 예정입니다.
مؤشر Pine Script®

استراتيجية Pine Script®

Ichimoku + Adx Strategy FinalA strategy based on ichimoku and dmi optimized for crypto trading
long
tenkan/kijun
chikou > close
dmi+/dmi-
dmi > thold
adx > thold
short
opposite of first 3
dmi- > thold
you should enable short trading from the settings if you wish to see it
Cheers!
استراتيجية Pine Script®

BadaBing IchimokuUses a combination of entry parameters to define a very strict entry criterion
Uses a simple criteria to close trades
Intended for long-term trending trades
استراتيجية Pine Script®

2xIchimoku Cloud + 4xMA + Williams FractalUpdated version of the previously published multi-indicator which includes
4x Moving Averages
2x Ichimoku Clouds
Bill Williams Fractals
Changes:
-Toggle switches for each indicator on input tab for easy on/off
-MA Type Selector (EMA/SMA/WMA/VWMA)
-Various default style change
Many thanks to both redwraith and jedireza for helping me work out the MA section
www.tradingview.com
www.tradingview.com
Next improvements: Ichimoku settings
مؤشر Pine Script®

مؤشر Pine Script®

استراتيجية Pine Script®

Ichimoku + Adx StrategyA strategy based on ichimoku and dmi optimized for crypto trading
Signals created with
tenkan/kijun
chikou > close
dmi+/dmi-
dmi > thold
adx > thold
sell
tenkan/kijun
chikou
استراتيجية Pine Script®

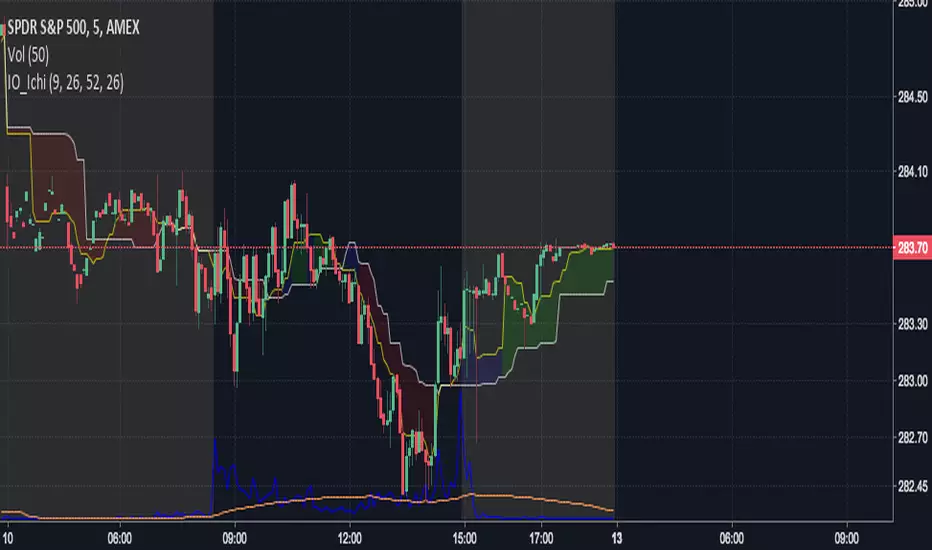
IO_Ichimoku_Simplev1.0
This is a simplified version of Ichimoku cloud: Chikou and Senkou A and B clouds removed
Tenkan and Kijun is color coded based on the following rules:
1. If both Tenkan and Chikou are above Senkou then bullish
2. If both Tenkan and Chikou are below Senkou then bearish
The chart shows a plot of Tenkan and Kijun color coded with the above rules
مؤشر Pine Script®
مؤشر Pine Script®

umo Ichimoku CloudYou can see an Ichimoku Cloud in another time frame than the current time frame in which the bars are displayed.
When the cloud's time frame is larger than the bars', the cloud is not filled with solid color(I don't know why). Therefore the cloud is filled with bars instead.
مؤشر Pine Script®

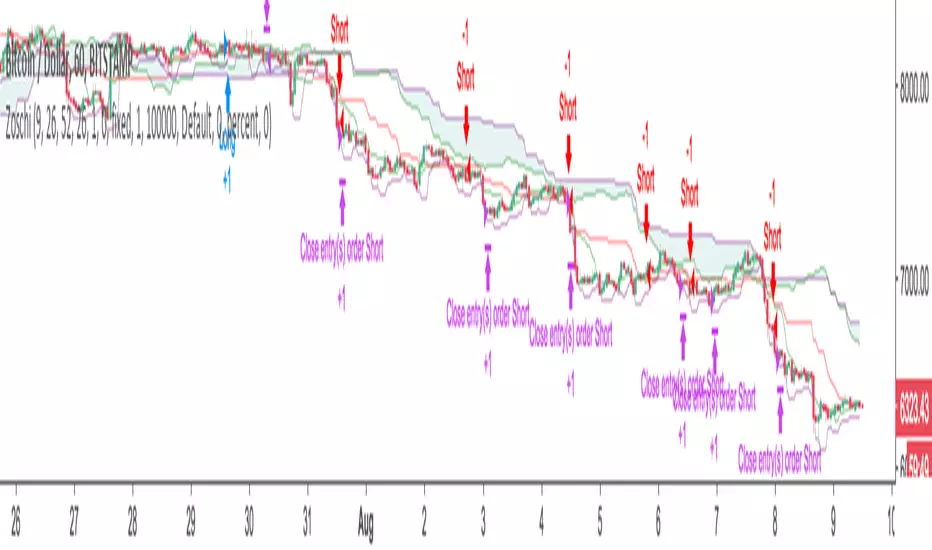
Zos Ichimoku Trading SystemFully automated Ichimoku Cloud based trading system. Automated entry and exits.
Message me on Telegram for access. @zacharyo
(c) Bronte Capital
استراتيجية Pine Script®