Ichimoku Kinkō HyōThe Ichimoku Kinko Hyo is an trading system developed by the late Goichi Hosoda (pen name "Ichimokusanjin") when he was the general manager of the business conditions department of Miyako Shinbun, the predecessor of the Tokyo Shimbun. Currently, it is a registered trademark of Economic Fluctuation Research Institute Co., Ltd., which is run by the bereaved family of Hosoda as a private research institute.
The Ichimoku Kinko Hyo is composed of time theory, price range theory (target price theory) and wave movement theory. Ichimoku means "At One Glace". The equilibrium table is famous for its span, but the first in the equilibrium table is the time relationship.
In the theory of time, the change date is the day after the number of periods classified into the basic numerical value such as 9, 17, 26, etc., the equal numerical value that takes the number of periods of the past wave motion, and the habit numerical value that appears for each issue is there. The market is based on the idea that the buying and selling equilibrium will move in the wrong direction. Another feature is that time is emphasized in order to estimate when changes will occur.
In the price range theory, there are E・V・N・NT calculated values and multiple values of 4 to 8E as target values. In addition, in order to determine the momentum and direction of the market, we will consider other price ranges and ying and yang numbers.
If the calculated value is realized on the change date calculated by each numerical value, the market price is likely to reverse.
転換線 (Tenkansen) (Conversion Line) = (highest price in the past 9 periods + lowest price) ÷ 2
基準線 (Kijunsen) (Base Line) = (highest price in the past 26 periods + lowest price) ÷ 2
It represents Support/Resistance for 16 bars. It is a 50% Fibonacci Retracement. The Kijun sen is knows as the "container" of the trend. It is prefect to use as an initial stop and/or trailing stop.
先行スパン1 (Senkou span 1) (Lagging Span 1) = {(conversion value + reference value) ÷ 2} 25 periods ahead (26 periods ahead including the current day, that is)
先行スパン2 (Senkou span 2) (Lagging Span 2) = {(highest price in the past 52 periods + lowest price) ÷ 2} 25 periods ahead (26 periods ahead including the current day, that is)
遅行スパン (Chikou span) (Lagging Span) = (current candle closing price) plotted 26 periods before (that is, including the current day) 25 periods ago
It is the only Ichimoku indicator that uses the closing price. It is used for momentum of the trend.
The area surrounded by the two lagging span lines is called a cloud. This is the foundation of the system. It determines the sentiment (Bull/Bear) for the insrument. If price is above the cloud, the instrument is bullish. If price is below the cloud, the instrument is bearish.
-
The wave theory of the Ichimoku Kinko Hyo has the following waves.
All about the rising market. If it is the falling market, the opposite is true.
I wave rise one market price.
V wave the market price that raises and lowers.
N wave the market price for raising, lowering, and raising.
P wave the high price depreciates and the low price rises with the passage of time. Leave either.
Y wave the high price rises and the low price falls with the passage of time. Leave either.
S wave A market in which the lowered market rebounds and rises at the previous high level.
There are the above 6 types but the basis of the Ichimoku Kinko Hyo is the N wave of 3 waves.
In Elliott wave theory and similar theories, basically there are 5 waves but 5 waves are a series of 2 and 3 waves N, 3 for 7 waves, 4 for 9 waves and so on.
Even if it keep continuing, it will be based on N wave. In addition, since the P wave and the Y wave are separated from each other, they can be seen as N waves from a large perspective.
-
There are basic E・V・N・NT calculated values and several other calculation methods for the Ichimoku Kinko Hyo. It is the only calculated value that gives a concrete value in the Ichimoku Kinko Hyo, which is difficult to understand, but since we focus only on the price difference and do not consider the supply and demand, it is forbidden to stick to the calculated value alone.
(The calculation method of the following five calculated values is based on the rising market price, which is raised from the low price A to the high price B and lowered from the high price B to the low price C. Therefore, the low price C is higher than the low price A)
E calculated value The amount of increase from the low price A to the high price B is added to the high price B. = B + (BA)
V calculated value Adds the amount of decline from the high price B to the low price C to the high price B. = B + (BC)
N calculated value The amount of increase from the low price A to the high price B is added to the low price C. = C + (BA)
NT calculated value Adds the amount of increase from the low price A to the low price C to the low price C. = C + (CA)
4E calculated value (four-layer double / quadruple value) Adds three times the amount of increase from the low price A to the high price B to the high price B. = B + 3 × (BA)
Calculated value of P wave The upper price is devalued and the lower price is rounded up, and the price range of both is the same.
Calculated value of Y wave The upper price is rounded up and the lower price is rounded down, and the price range of both is the same.
سحابة إيتشيموكو

IKH Signals v2Hi,
I'm happy to release this new update after few weeks working.
Fixes
Fix kumo break-out of Chiku span and close price
Fix buy trigger and strong buy trigger
Improvement
Signals take now the kumo thickness and kumo angle
Signals does not trigger on doji candles
Multi time frame validation is now available
I hope this fixes and new features will improve the signals for you too.
Let me know if you find strange behavior or possible improvments.
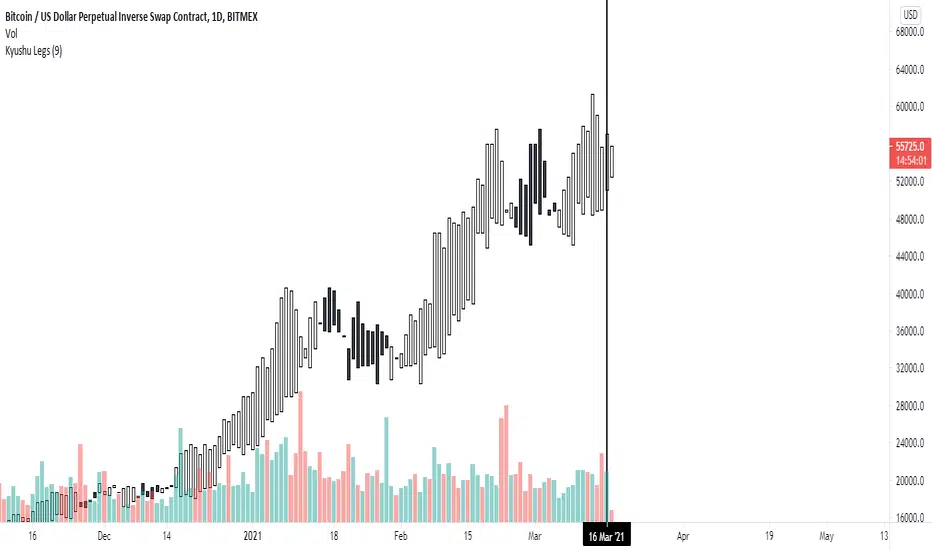
Ichimoku by HosodaWritten from scratch Ichimoku indicator, based on original calculations from Hosoda books. All formulas are exactly the same as Hosoda put them in his books, it contains additionally analysis from Higher Timeframe allowing to display Chikou trend, Kijun and Senkou-span B which are crucial in determining trend. It also contains overlay of Kyushu Legs. This is initial version of script and will be contanstly improved.
Some Ichimoku scripts have basic bugs in calculations and I ensure that formulas in this indicator are fully correct in relation to formulas provided by Hosoda.

Kyushu LegsKyushu Legs is part of the Ichimoku strategy. Kyushu Legs shows new candle bars which help to find a change of trend.
Legs Kyushu is created every candle based on close 9 candles before the actual open candle. Also, there is a possibility of changing the settings of counting the Legs Kyushu.
Colors change based on trend: the white candles show that the market is bullish, black candles that the market is bearish.
source of the code:
Ichimoku + 2 base linesIchimoku + 2 base line
This indicator is a combination of Ichimoku cloud indicator with two base lines.
The first base line is the same as the Ichimoku default settings but the baseline 2 indicates an average of 108 candles in the past and it acts as a strong support and resistance level.
How to use this indicator?
You can use this indicator to see if a break out is true or is a false break. For example if the price broke up the Ichimoku cloud and base line 2 is above the price, it will probably react to that area but if it's below the price, it is a good opportunity to buy. (for sell/short position it is in the opposite way the base line 2 should be above the price)
If you want to trade in support zones base line 2 (108) is a very good area that you can wait for a good candlestick pattern to enter a position.
Caution: before using this indicator please back test it and if the results were good enough, use it as a confirmation.

Multi Timeframe Silent IchimokuMulti Timeframe Silent Ichimoku
Is an upgrade on my previous Silent Ichimoku indicator witch attempts to filter out the noise from the Ichimoku indicator By only coloring the bars
Green if the Ichimoku spots an uptrend
Red if Ichimoku spots a downtrend
And Gray if Ichimoku spots consolidation
This Indicator adds the ability to filter out some bad signals by taking the Ichimoku from the higher time frame into consideration and providing a visual back test
Huge shout out to fareidzulkifli for the Quick Backtest Framework Awesome tool to add to your framework


LTF Signal with KTS ConfirmationLTF Signal with Ichimoku KTS Confirmation
If you cant to learn more about ichimoku and KTS strategy from Forex Kei trader.
This indicator is based in multiple indicators. I will try to explain how it works.
Input
The only input is the major trend resolution. This is for Ichimoku and KTS trend confirmation
Signals
This script provide sell or buy signals provided on some condition explained just below
Mandatory conditions
Ichimoku KTS : kumo up, SSA or SSB up and kijun up or kumo down, SSA or SSB down and kijun down
RSI or Accumulation/Distribution should be rising or falling
Price should be moving up or down
Price should have break previous 6 candles high or low
2 optional conditions explained below
optional conditions
EMA 9 should have crossed EMA 21
Price should have crossed SMA 50
Stochastic 30 10 10 should have gold cross
Price should have cross vwap
The signals are triggered if all mandatory conditions are filled and at least 2 optional conditions

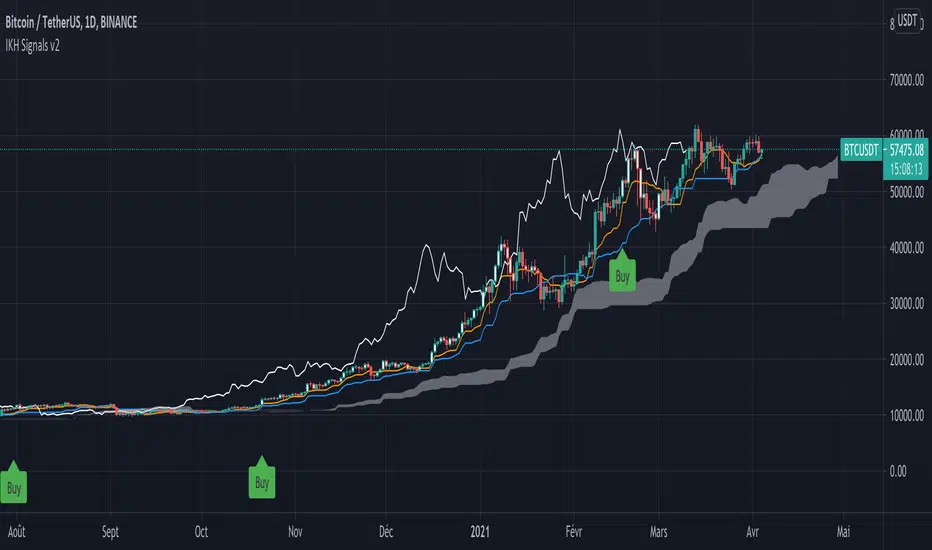
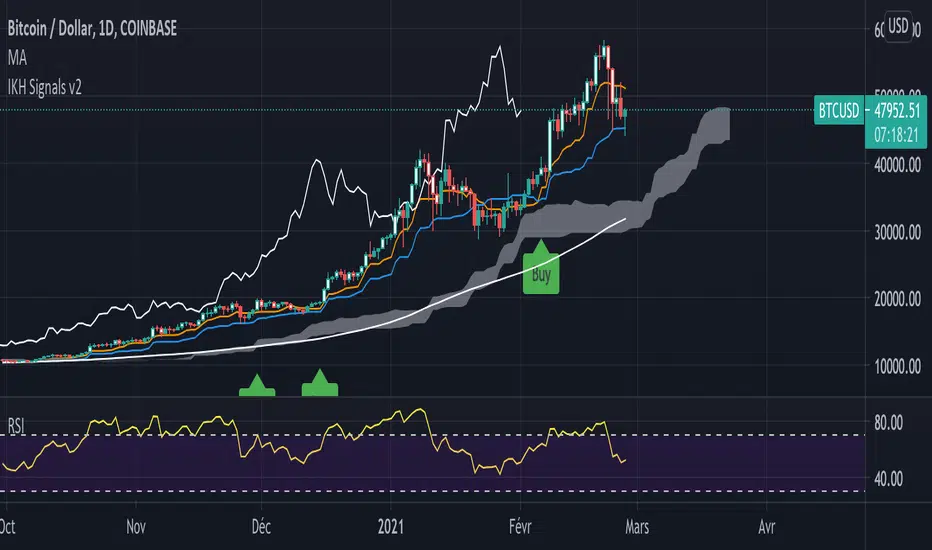
IKH Signals v2Ichimoku Kinko Hyo Signals
This script show signals based on my understanding in Ichimoku Kinko Hyo and is an evolution of this script
Instead of using my own functions, I use now the ones provided by pine script
/!\ Please do not follow signals blindly and always make your own analysis /!\
Signals explanation
Buy : Price above kumo, tenkan above kijun, chikou span above candles and kumo and price break previous 9 candles high
Strong Buy : Is a Sanyaku Kouten and can show a potential reverse in current tendance
Sell : Price below kumo, tenkan below kijun, chikou span below candles and kumo and price break previous 9 candles low
Strong Sell : Is a Sanyaku Gyakuten and can show a potential reverse in current tendance
Exit : Show a potential time to take profit based on previous Sell, Strong Sell, Buy, or Strong Buy signal
Buy Colored bard : bar a colored between a buy signal and an buy exit signal, based on this conditions : kumo up, SSA or SSB up and kijun up
Sell Colored bard : bar a colored between a sell signal and an sell exit signal, based on this conditions : kumo down, SSA or SSB down and kijun down
How to use it
When a signal is triggered
A signal ( strong or not ) show a new entry point. You can start looking for an entry in lower timeframe according to the signal direction.
A colored bar means that the price is pushing in a direction according to the previous signals, It's a good moment to look for an entry in lower timeframes.
Alerts
You can configure alerts for Strong buy, buy, Strong sell, sell and both exit signals
Silent IchimokuSilent Ichimoku
attempts to filter out the noise from the Ichimoku indicator By only coloring the bars
Green if the Ichimoku spots an uptrend
Red if Ichimoku spots a downtrend
And Gray if Ichimoku spots consolidation

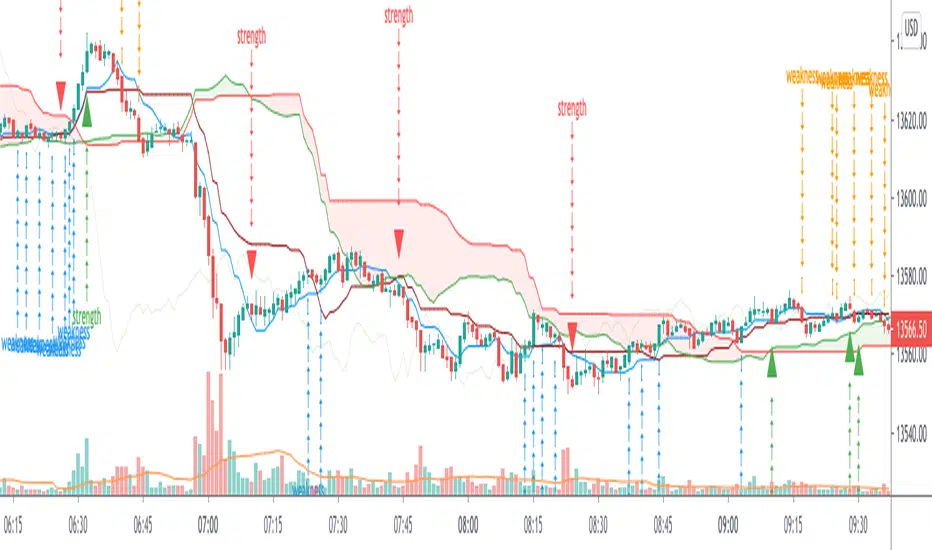
Ichimoku Trader ToolkitThe Ichimoku Cloud
is a collection of technical indicators that show support and resistance levels, as well as momentum and trend direction. It does this by taking multiple averages and plotting them on the chart. It also uses these figures to compute a "cloud" which attempts to forecast where the price may find support or resistance in the future. The Ichimoku cloud was developed by Goichi Hosoda, a Japanese journalist, and published in the late 1960s.
It provides more data points than the standard candlestick chart. While it seems complicated at first glance, those familiar with how to read the charts often find it easy to understand with well-defined trading signals.
The Ichimoku Cloud is useful for day traders and others who need to make quick decisions. The cloud is often paired with other technical indicators, such as the Relative Strength Index , in order for traders to get a complete picture of resistance and support. Many traders will also look out for crossovers in order to determine when trends have reversed.
Ichimoku cloud trading requires a lot of self-discipline. This is because you have to wait for the best trade signals.
What is this Ichimoku Trader Toolkit ?
Since Ichimoku is a reliable Indicator, but its very populated on charts, Its bit complicated to find the Sign of Strength {SOS} and Sign of Weaknesses {SOW} at first glance,
The Toolkit is an attempt to make Ichimoku much more Intutive to trade and visualize the potential SOS and SOW early in the charts
What timeframes can it be used?
Any Timeframe
Provision for Alerts
Strength_alerts
Weakness_alerts
All_Alerts
How can you get access?
Private message me only, use comment box for constructive comments
Ichimoku BaselineVersion 1.0 with some possible updates in the future.
Based on Ichimoku Cloud, this indicator pulls information about Tenkan, Kijun, as well as the Cloud Spans to calculate an immediate to short-term level of support or resistance, depending on whether price is above or below it.
Breaking across the line can be a good indicator of when to be long or short on the market, as well as a good way to have a "Baseline" to filter out other signals.
By default it is set to a modest 5 bar displacement/offset. Feel free to experiment with this value.
Enjoy!

Ichimoku LiteIchimoku Kinko Hyo (often called Ichimoku Cloud) is a technical analysis method and trading system developed by Hosoda Goichi in 1935 and first published in 1975 under the pen-name Ichimoku Sanjin. The indicator shows the overall market state and reveals the equilibrium point of the price movement. The key idea of developing this indicator is to know the presence of the market. However, most of the default setting of this indicator is difficult to its elaborate visual presentation. Here, I modify the indicator by removing the lagging span and applying a lower color contrast of the cloud. This indicator can be combined with the turbulence indicator to provide a better confirmation of breakout signals.

MTF Ichimoku Signal [Takazudo]A multi timeframe Ichimoku Signal indicator. This indicator shows the status of each Ichimoku Signals.
1. TK-Cross
Tenkan-Sen & Kijun-Sen cross status
2. Future Kumo
The newest Kumo color
3. Kumo & Current Relation
The relation between current price & Kumo.
4. Kumo & Chikou-Span Relation
The relation between Kumo & Chikou-Span.
5. Chikou-Span & Candle Cross
Chikou-Span & Candle cross status

Ichimoku Basic AlertsStarted with Ichimoku Kinko Hyo by Mizuki32. Converted to study and added alerting and cloud confirmation.
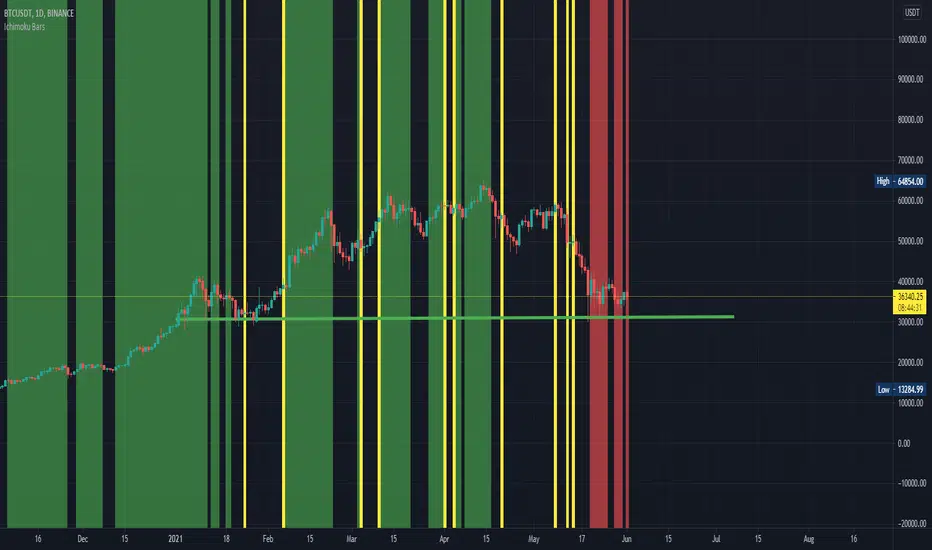
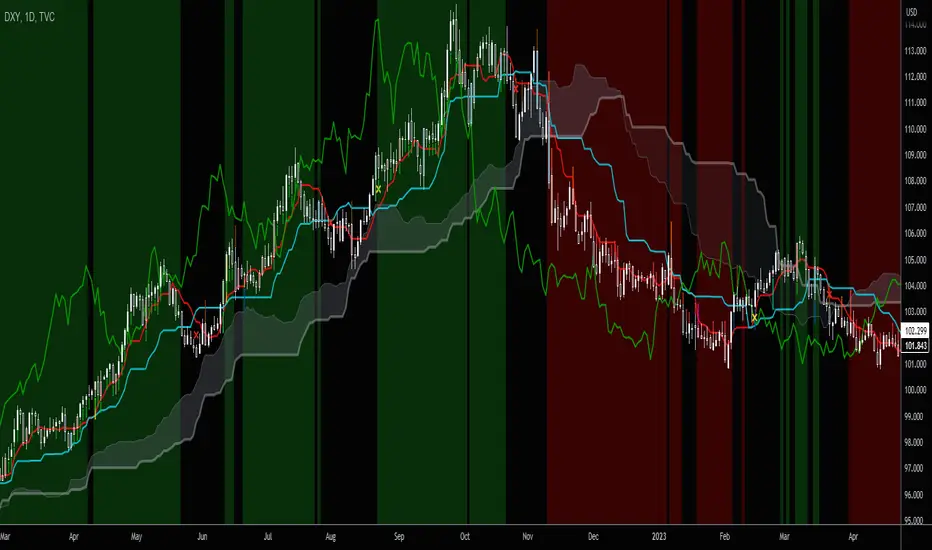
Ichimoku BarsThis script follows off the principles of the Ichimoku Cloud indicator. The green zones display optimal time to buy according to the Ichimoku model. The red zones show optimal time to sell according to the Ichimoku model inverse. The yellow zones show where the conversion line meets the base line (potential up or down movement at this point). Feel free to contact me to fix any problems or add additional info.
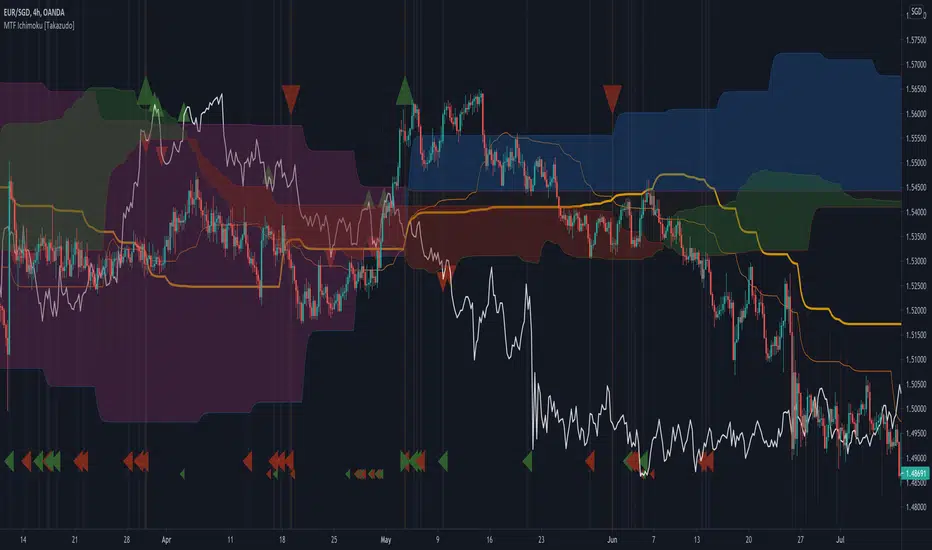
MTF Ichimoku [Takazudo]- A multi time frame Ichimoku with messy hint highlights.
- Most of MTF Ichimoku scripts doesn't handle Chikou-span's place correctly. This script does.
- This script was made to refer the 1day timeframe Ichimoku in lower timeframes.
- I use 1day timeframe mainly. But my entry is always in 4h or 1h timeframe.
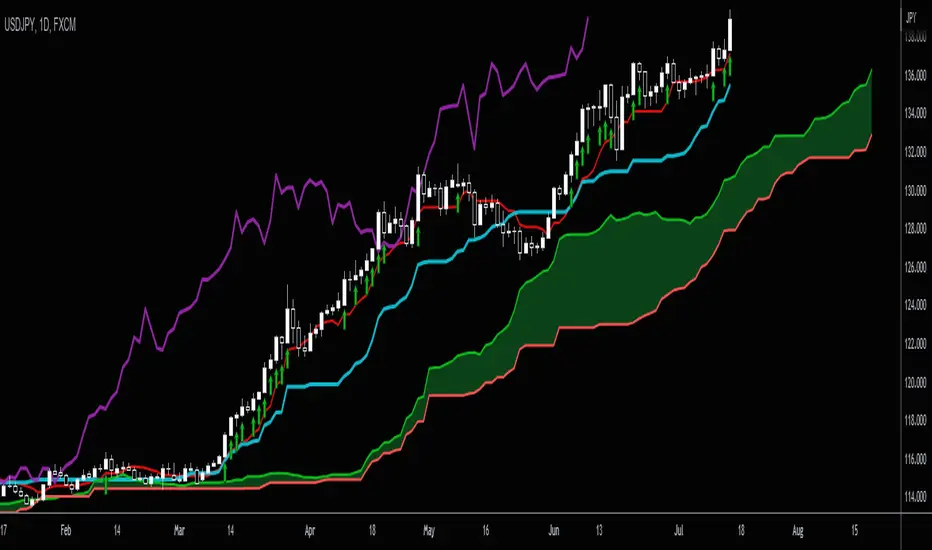
OANDA:USDJPY
Ichimoku with shift (Pink)Hello traders you can easy shift cloud and chikou span(Apply positive and negative shifts)
Kind regards Ehsan(pinklove)

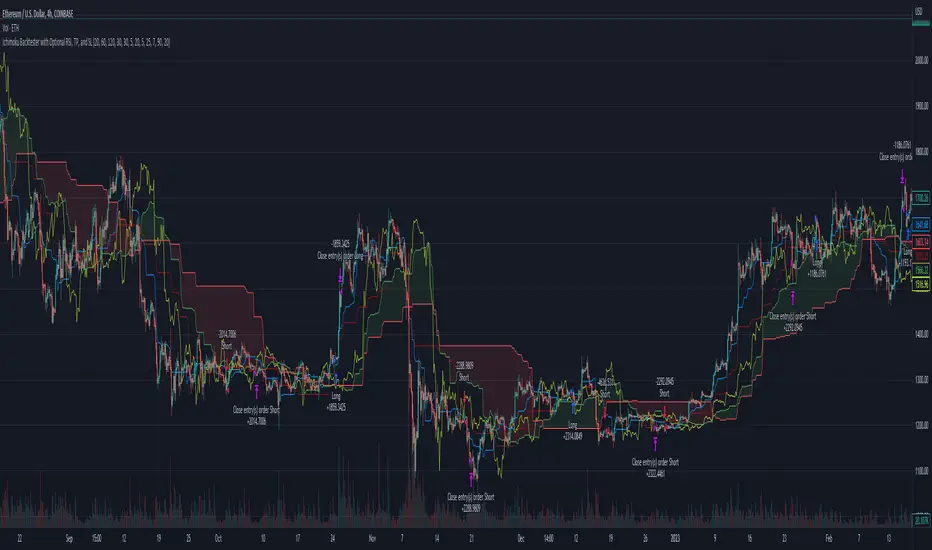
Crack_RSI_Cloud_Ver_1.0.0
(주식/Stocks) 삼성전자 Samsung Electronics
(선물/Futures) 나스닥 NASDAQ
(코인/Cryptocurrency) 비트코인 BTCKRW
Hello my dear traders.
My team has recently developed a technical indicator that surprises ourselves every time we observe a price action caused by this very indicator.
Relative Strength Index has been developed by a scholar named Welles Wilder. Just like me, he turned himself into a technical analyst from a mechanical engineer after realizing how powerful and beautiful technical analysis is. As most of you know, RSI is a technical indicator that measures and visualizes the strength of bulls or bears objectively, in a percentage unit. This index, which oscillates between 0~100, is useful when identifying the general trend of the market
Here is the equation that computes RSI.
RSI(%) = (Average of Upward Price Change within N /( Average of Upward Price Change within N + Average of Downward Price Change within N))*100
* N = Time period/length or the number of candlesticks that are being considered
RSI is one of the most popular indicators used by daily traders these days. However, since default setting of the RSI only considers the closed price of candles, many limitations and weak points have been spotted recently. Since current financial market (such as crypto, stocks, futures, and forex) is heavily volatile and unstable, candle’s tails are not being considered properly on RSI (and also any other indicators that are computed using closed price).
To handle this problem, our team has worked very hard to achieve applying candle’s tails on our indicators.
After numerous tries and updates, we have finally come up with a very decent one that plots RSI that reflects both the candle's wick and body. This indicator can be interpreted as a cloud of RSI just like Ichimoku.
Traders can consider this indicator as overbought/oversold only if all of the RSI lines, (or the whold cloud) enters to the zones. Moreover, plotting channels and trendline on this cloud works very well.
We have also made it to show divergence signals so that traders can refer when the relative strength of bulls/bears starts to resolve.
If you wish to obtain access to this indicator, please comment or DM to this account.
We will give you guys an update soon for a newer version!
Thanks.
안녕하세요 트레이더 여러분. 토미 트레이딩 팀입니다.
오늘은 요즘 많은 트레이더들이 유용하게 사용하는 RSI와 해당 지표의 한계점에 대해서 알려드리겠습니다. 또한 본 한계점을 극복하기 위해 저희 개발팀이 최근에 개발한 RSI 클라우드 지표에 대해서 소개해드리겠습니다.
RSI , Relative Strength Index (상대강도지수)는 1978년에 웰레스 월더라는, 저처럼 원래 공학자였지만 기술적분석이라는 학문에 푹 빠져 이쪽 분야로 발을 돌린 한 학자에 의해 개발됐습니다. 해당 지수는 주가의 상승/하락 압력 간의 상대적인 강도를 보여주는 보조지표로 추세의 강도세를 백분율로 표기해줍니다.
RSI를 산출하는 공식은 다음과 같습니다.
RSI (%) = (N의 상승폭 합계/(N의 상승폭 합계 + N의 하락폭 합계))*100
* N = Time period/length, 시간(캔들봉) 단위
본 공식에서 N은 RSI의 민감도를 조절하는 Parameter(설정값)로 보편적으로 Default(기본)값인 14, 조금 덜 민감한 값으로는 25가 사용됩니다. RSI의 단위는 %로 과매수 구간은 70~80%, 과매도 구간은 20~30%으로 사용됩니다. 즉 RSI가 70~80% 이상일 때 강세 혹은 과매수, 20~30%일 때 약세 혹은 과매도라고 판단할 수 있습니다.
정말로 직관적이면서도 참으로 쉽고 유용한 지표이죠.
하지만 아쉽게도 이 RSI도 크나 큰 한계점이 존재합니다. 해당 지수가 산정될 때 사용하는 소스값은 Closed, 즉 캔들의 종가로, 고가와 저가가 지수에 반영되지 않습니다. 즉 캔들의 꼬리는 해당 지수에 고려되지 않는다는 점입니다. 요즘에 누가 캔들 종가만 보고, 혹은 라인차트로만 매매하나요? 허구한날 미친 스캠무빙이 툭하면 나오는 현대 장에 종가만 가지고 매매하면 골로간다는건 다들 아실 거라 생각합니다. 요즘처럼 고변동성의, 툭하면 길고 뾰족한 꼬리들이 난무하는 현대 금융 시장에 적용시키기엔 문제가 너무 많습니다.
게다가 요즘에 너무나도 많은 개인투자자들이 RSI 지표를 사용합니다. 모두가 같은 자리, 같은 기법, 혹은 같은 지표를 쓰면 어떻게 된다고 했죠? 제가 매번 강조 드렸듯이 3~5% 개미 생종률은 불변의 법칙입니다. 모두가 롱을 외치면 숏자리를, 모두가 숏을 외치면 롱자리를 찾아야하는 금융시장. 높은 통찰력과 안목을 지닌 소수의 현명한 투자자들만 살아남는다고 제가 누누이 강조 드렸습니다.
이 문제를 해결하고자 최근 저희 팀은 캔들의 모든 가격들을 RSI지표에 반영시키기 위해, 그리고 종가를 기준이 아닌 다른 기준으로 다이버전스를 모색하는 매우 다양한 시도들을 해왔습니다.
수많은 연구, 실험 및 고찰 끝에 마침내 캔들의 모든 가격을 반영하는 RSI 지표를 만들고 말았습니다. 이름하여 RSI 클라우드! RSI를 하나의 라인이 아닌 범위로 표기를 함으로써 조금 더 보수적이고 정확하게 강도지수를 파악할 수 있게 되었습니다. 본 지표는 일목구름과 마찬가지로 RSI를 하나의 선이 아닌 구름대로 해석하시면 됩니다.
다수의 라인(라인들의 범주를 구름으로 표기함)으로 구성된 이 지표는 고려하는 모든 선들이 과매수/과매도 구역에 진입해야 과열로 간주함으로써 더 보수적으로 확실한 과열 상황들을 포착할 수 있습니다. 그리고 해당 지표에 평행 채널 및 추세선들이 기가 막히게 잘 들어맞습니다. 주가에 추세선/채널 작도하는 것처럼 활용하시면 됩니다. 이탈 방향 나올 때, 그리고 심지어 이탈 이후 리테스트도 나옵니다.
또한 다이버전스 역시 종가가 아닌 캔들의 평균값을 사용하여 시그널이 나오게끔 했습니다. 때문에 중간중간에 긴 꼬리들 혹은 말도 안되는 무빙이나 노이즈들로 발생되는 주가 <-> 지표 다이버전스의 괴리감을 최소화시켰습니다. 이 또한 자동으로 다이버전스를 잡도록 로직을 짰으니 상승/하락세의 과열이 점차 해소되기 시작할 때, 즉 변곡 잡으실 때 매우 유용하게 사용하실 수 있습니다.
물론 당연한 말이지만 이 지표 하나만 가지고 매매를 하면 안되겠죠? 본인만의 여러 기법 및 지표들의 튼튼한 조합을 구성할 때 하나의 기준으로써 참고를 해야합니다.
아래는 비트코인이 아닌 선물과 주식 차트입니다. 해당 차트들은 예전 차트도 아닌 최근 차트입니다. 이와 같이 종목/상품과 타임프레임을 불문하고 다 잘 맞습니다.
그러면 이상, 급변하는 21세기 현대 금융시장에 최적화된 기법, 지표 및 전략들을 꾸준히 연구하고 개발하는 토미 트레이딩 팀이었습니다.
감사합니다.

Ichimoku Trend DirectionThis script will help you detect the current trend of market use Ichimoku trading system. We use the default parameters.
To reduce risk, ONLY trade follow the trend of high time frame!
Very simple to use:
- Green background when market Up trend
- Red background when market Down trend
Have a nice trade! :P
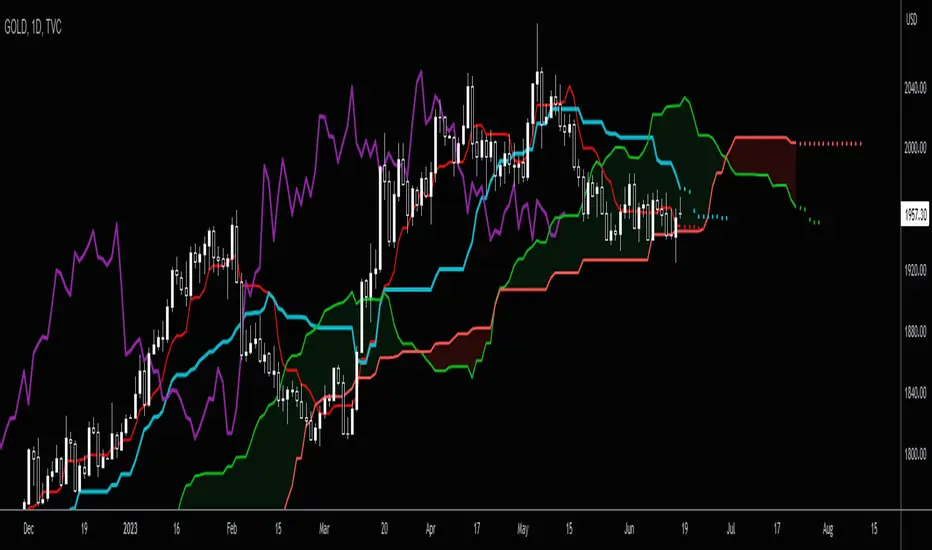
Future Ichimoku LinesFuture Ichimoku Lines Plot: Tenkan-sen next 5 days, Kijun-sen next 10 days, Kumo A next 5 days and Kumo B next 14 days will be display
This will help you forecast the future of price and increase winning probability!
Always remember, risk management is the key of a successful trader
Have a nice trade! :D
Ichimoku Line CounterThis simple script will help you seen the range of Kijun-sen, Tenkan-sen and Senkou span B. You can use it to analyze the direction of Ichimoku components. Very useful for Ichimoku trader!
Example: how many days Kijun, Kumo, ... still flat or become flat?
We use the default number: 9, 26 and 52. You absolutely can modify it if your system use different numbers :P
Have a nice trade! :D
Simple Ichimoku Signal v1Simple Ichimoku Signal v1 - Use Original Japanese Ichimoku System
You can set alert to get notify on your phone when the signals appear:
- BUY signal (green arrow): when all lines of Ichimoku system have bullish
- SELL signal (red arrow): when all lines of Ichimoku system have bearish
Very easy to use for everyone expecially people who has less time for trading. Simple but very effective!
Please remember: all trading system can be right/wrong so the risk management is super important!
Good luck!