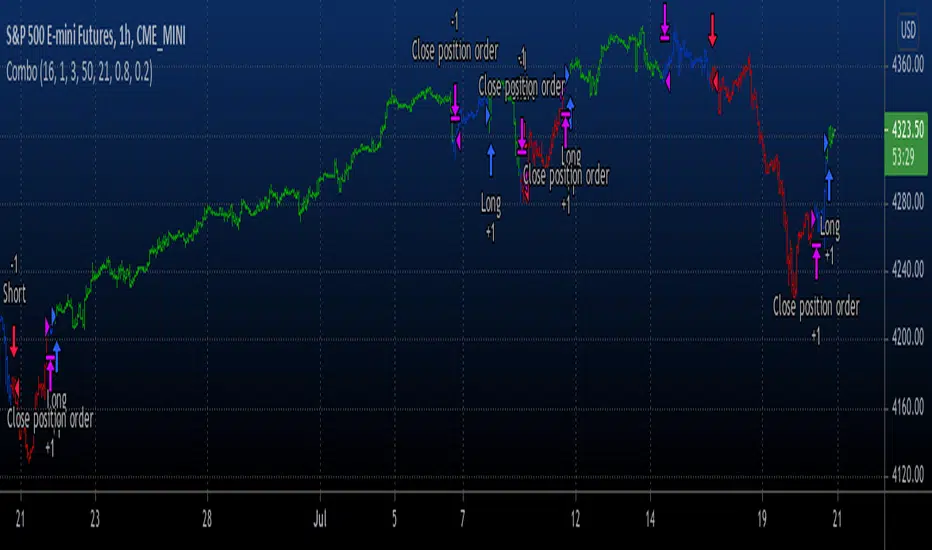
Combo Backtest 123 Reversal & Awesome Oscillator (AO) This is combo strategies for get a cumulative signal.
First strategy
This System was created from the Book "How I Tripled My Money In The
Futures Market" by Ulf Jensen, Page 183. This is reverse type of strategies.
The strategy buys at market, if close price is higher than the previous close
during 2 days and the meaning of 9-days Stochastic Slow Oscillator is lower than 50.
The strategy sells at market, if close price is lower than the previous close price
during 2 days and the meaning of 9-days Stochastic Fast Oscillator is higher than 50.
Second strategy
This indicator is based on Bill Williams` recommendations from his book
"New Trading Dimensions". We recommend this book to you as most useful reading.
The wisdom, technical expertise, and skillful teaching style of Williams make
it a truly revolutionary-level source. A must-have new book for stock and
commodity traders.
The 1st 2 chapters are somewhat of ramble where the author describes the
"metaphysics" of trading. Still some good ideas are offered. The book references
chaos theory, and leaves it up to the reader to believe whether "supercomputers"
were used in formulating the various trading methods (the author wants to come across
as an applied mathemetician, but he sure looks like a stock trader). There isn't any
obvious connection with Chaos Theory - despite of the weak link between the title and
content, the trading methodologies do work. Most readers think the author's systems to
be a perfect filter and trigger for a short term trading system. He states a goal of
10%/month, but when these filters & axioms are correctly combined with a good momentum
system, much more is a probable result.
There's better written & more informative books out there for less money, but this author
does have the "Holy Grail" of stock trading. A set of filters, axioms, and methods which are
the "missing link" for any trading system which is based upon conventional indicators.
This indicator plots the oscillator as a histogram where periods fit for buying are marked
as blue, and periods fit for selling as red. If the current value of AC (Awesome Oscillator)
is over the previous, the period is deemed fit for buying and the indicator is marked blue.
If the AC values is not over the previous, the period is deemed fir for selling and the indicator
is marked red.
WARNING:
- For purpose educate only
- This script to change bars colors.
M-oscillator
Ichimoku with MACD/ CMF/ TSIThis is a very powerful trend strategy designed for markets such as stocks market , stock index and crypto.
For time frames I found out that 1h seems to do the trick.
Components:
Ichimoku full pack
MACD histogram
CMF oscillator
TSI oscillator
Rules for entry
Long :
For Ichimoku:Tenkan part of cloud is bigger than kijun, Chikou is above 0 , close of a candle is above the Senkou
MACD histogram is above 0
CMF oscillator is positive and bigger than 0.1
TSI oscillator is above 0
Short:
For Ichimoku:Tenkan part of cloud is smaller than kijun, Chikou is below 0 , close of a candle is belowthe Senkou
MACD histogram is below 0
CMF oscillator is negative and below -0.1
TSI oscillator is below 0
Rules for exit
This strategy does not have any risk management inside. Instead it exits whenver it receives an opposite signal form the original one used for entry.
If you have any questions let me know !

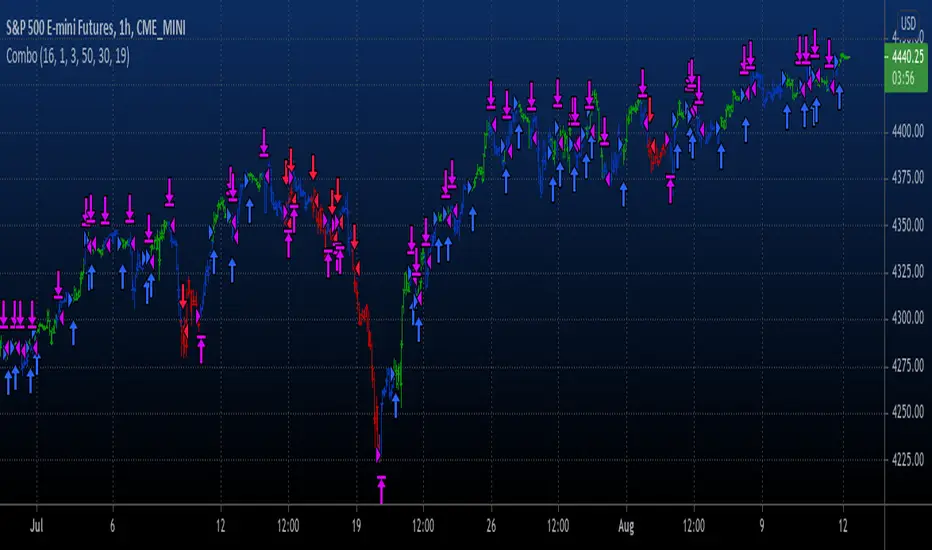
Combo Backtest 123 Reversal & Awesome Oscillator (AC) This is combo strategies for get a cumulative signal.
First strategy
This System was created from the Book "How I Tripled My Money In The
Futures Market" by Ulf Jensen, Page 183. This is reverse type of strategies.
The strategy buys at market, if close price is higher than the previous close
during 2 days and the meaning of 9-days Stochastic Slow Oscillator is lower than 50.
The strategy sells at market, if close price is lower than the previous close price
during 2 days and the meaning of 9-days Stochastic Fast Oscillator is higher than 50.
Second strategy
This indicator plots the oscillator as a histogram where blue denotes
periods suited for buying and red . for selling. If the current value
of AO (Awesome Oscillator) is above previous, the period is considered
suited for buying and the period is marked blue. If the AO value is not
above previous, the period is considered suited for selling and the
indicator marks it as red.
WARNING:
- For purpose educate only
- This script to change bars colors.
Extremely high win rate FOREX swing strategyTHis is a very simple yet extremely efficient FOREX strategy .
In general it tends to work the best against NZD and AUD pairs, however other major pairs and crosses can work as well.
It's made of a time management, together with MACD , moving average , a price action rule and a risk management.
THe logic behind is the next one :
For LONG:
We have 3 ascending candles.
Histogram of MACD is positive.
Last close of a candle is was above moving average.
If all those previous condition happened before 17/18 UTC time depending if its summer time or not, we enter the trade.
For Short:
We have 3 descending candles.
Histogram of MACD is negative.
Last close of a candle is was below moving average.
If all those previous condition happened before 17/18 UTC time depending if its summer time or not, we enter the trade.
RIsk management
For risk management, since we aim to have a 95%+ win rate, we aim to have a 5:1 or 10:1 risk to reward ratio. Meaning that for each $ we can win, we can lose 5-10$.
THats why I recommend to be extremely careful when playing with leverage with this strategy.

Full Forex scalper StrategyTHis is a FOREX scalping system that can be optimized with almost all majors and crosses pairs.
Its made of multiple elements such as :
MACD
Stochastic RSI
Fast VW moving average
Slow VW moving average
Time management( forex sessions as inputs)
Rules for entry
Long
Last 2 MACD values were ascending, fast moving average is below moving average and stochastic RSI is below 30 level. At the same time we are either into London or NY session.
Short
Last 2 MACD values were descending, fast moving average is above moving average and stochastic RSI is above 70 level. At the same time we are either into London or NY
Rules for exit
WE have 2 exit possibilities: we can exit either at the end of NY/London Session or based on a TP/SL risk management calculating % in movement.
If you have any questions let me know !

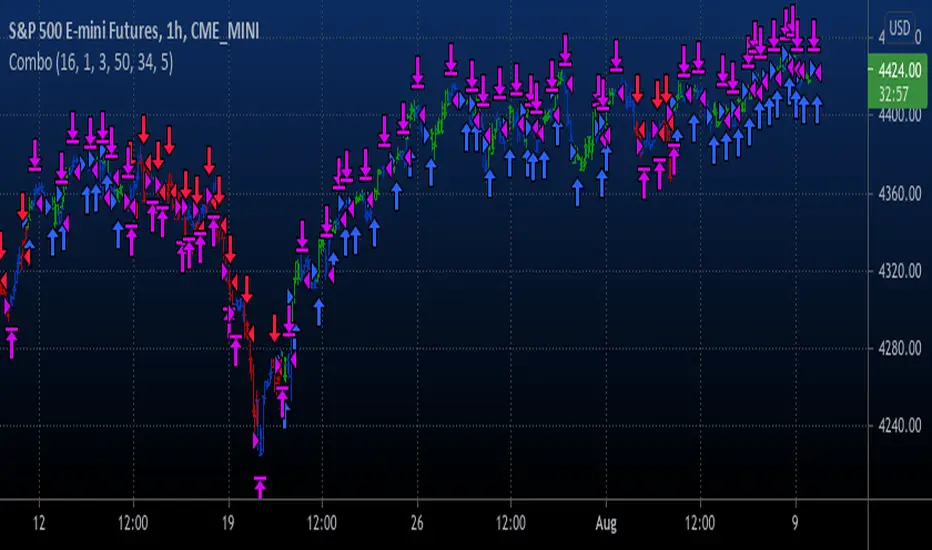
Combo Backtest 123 Reversal & 2/20 Exponential MA This is combo strategies for get a cumulative signal.
First strategy
This System was created from the Book "How I Tripled My Money In The
Futures Market" by Ulf Jensen, Page 183. This is reverse type of strategies.
The strategy buys at market, if close price is higher than the previous close
during 2 days and the meaning of 9-days Stochastic Slow Oscillator is lower than 50.
The strategy sells at market, if close price is lower than the previous close price
during 2 days and the meaning of 9-days Stochastic Fast Oscillator is higher than 50.
Second strategy
This indicator plots 2/20 exponential moving average. For the Mov
Avg X 2/20 Indicator, the EMA bar will be painted when the Alert criteria is met.
WARNING:
- For purpose educate only
- This script to change bars colors.

Fake Out StrategyA trading strategy of finding false breakouts to enter trades with high RR, low winrates, but still effective if the market has many false breakouts.
Example using 10 contract size with XAUUSD, slippage is 100, and commission per order is 3$ with actual capital of 10000$, you can adjust other contract size for other pairs to consistent with reality.

Scalping EURUSD, GPBUSDShort-term trading strategy on the M5 frame, looking for excessive areas of the price to enter orders. Exit before the price reaches the next overextended area.
Only trade from the Asian session to the end of the American session.
Example using 25000 contract size with EURUSD , slippage is 1 and commission per order is 0.9$ with actual capital of 10000$, you can adjust other contract size for other pairs to consistent with reality.

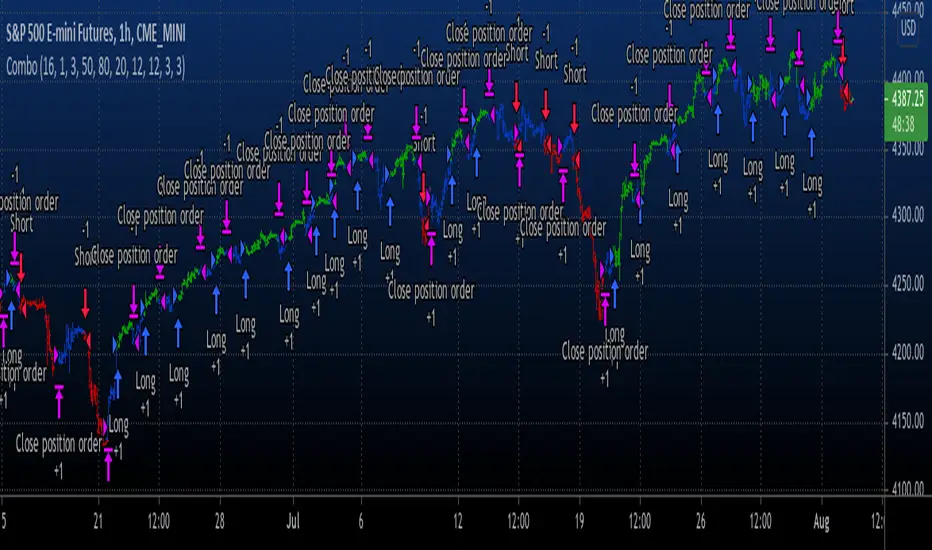
Combo Backtest 123 Reversal & Stochastic RSIThis is combo strategies for get a cumulative signal.
First strategy
This System was created from the Book "How I Tripled My Money In The
Futures Market" by Ulf Jensen, Page 183. This is reverse type of strategies.
The strategy buys at market, if close price is higher than the previous close
during 2 days and the meaning of 9-days Stochastic Slow Oscillator is lower than 50.
The strategy sells at market, if close price is lower than the previous close price
during 2 days and the meaning of 9-days Stochastic Fast Oscillator is higher than 50.
Second strategy
This strategy used to calculate the Stochastic RSI
WARNING:
- For purpose educate only
- This script to change bars colors.
[Advanced] Hilega-Milega IndicatorThis Indicator Name is Hilega Milega, and the original Idea given by Nitish Kumar, I just coded it and add some signals for backtesting.
it works on RSI + WMA and EMA plotted.
Default Values Used :
RSI = 9
WMA = 21
EMA = 3
But i added some extra, now everyone can change the Type of WMA and EMA, also SMA for trend confirmation,
How it works ??
Buy : When RSI crossover WMA or any Type of Moving Average you choose,
Sell : When RSI crossunder WMA or any Type of Moving Average you choose,
also:
Buy : When EMA crossover WMA or any Type of Moving Average you choose,
Sell : When EMA crossunder WMA or any Type of Moving Average you choose,
also:
Buy : When RSI + EMA crossover WMA or any Type of Moving Average you choose at the Same time,
Sell : When RSI + EMA crossunder WMA or any Type of Moving Average you choose at the Same time,
and Much More...! hope so you like it,

Combo Backtest 123 Reversal & Statistical Volatility This is combo strategies for get a cumulative signal.
First strategy
This System was created from the Book "How I Tripled My Money In The
Futures Market" by Ulf Jensen, Page 183. This is reverse type of strategies.
The strategy buys at market, if close price is higher than the previous close
during 2 days and the meaning of 9-days Stochastic Slow Oscillator is lower than 50.
The strategy sells at market, if close price is lower than the previous close price
during 2 days and the meaning of 9-days Stochastic Fast Oscillator is higher than 50.
Second strategy
This indicator used to calculate the statistical volatility, sometime
called historical volatility, based on the Extreme Value Method.
Please use this link to get more information about Volatility.
WARNING:
- For purpose educate only
- This script to change bars colors.

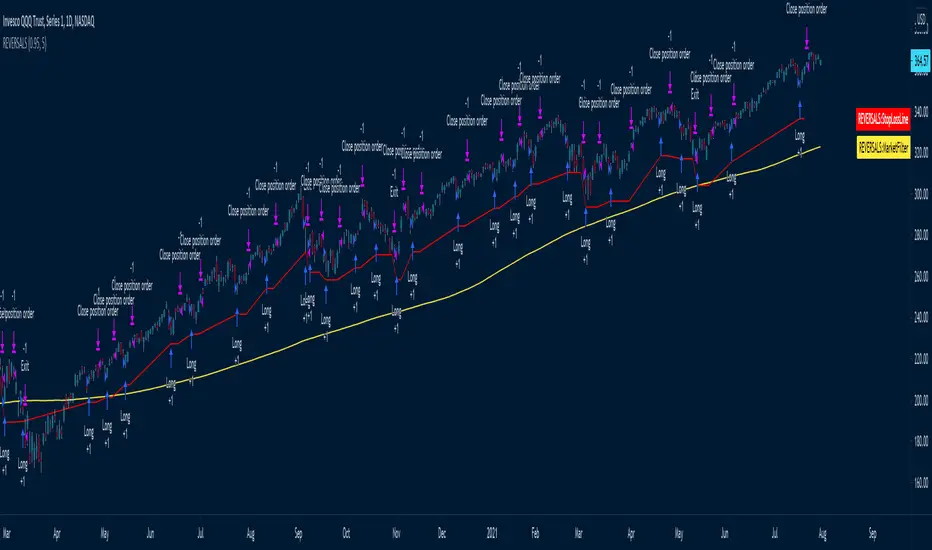
REVERSALS
The systems basically play reversals, it enters when the close is lower than its low of 5 bars ago to enter
It exits when the price is higher than the high of 5 days ago
Uses a 200 MA as a market filter, does not trade when the price is below its 200 Moving average
Uses a 5% stop, as per the red Stop Loss Line -- can be adjusted
The amount of bars it uses to look for reversals is set to 5 by default, but can be adjusted in settings.
Best to use on directional instruments where you know that the long term direction is up, for example:
TQQQ, SSO, SPX, SPY, or sector tickers -- but it would be best to include some more advanced filtering for sectors
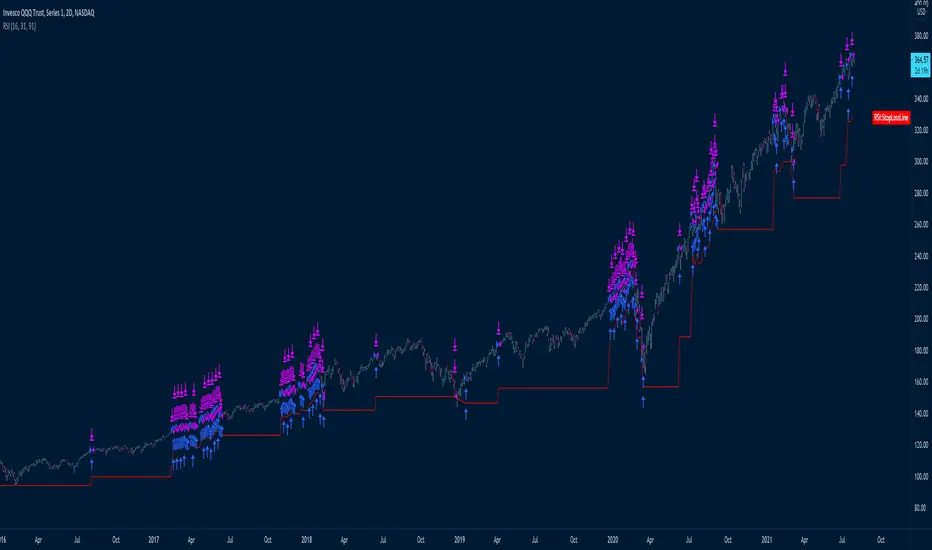
DUAL RSI
This system uses two RSI's with different settings
Fast RSI Lenght is 16, buys when RSI price is oversold @ 91 or lower, and sells when RSI price is overbought at 70
Slow RSI Lenght is 31, buys when RSI price is oversold @ 91 or lower, and sells when RSI price is overbought at 68
Pyramiding is set to 2 since each system should be able to trade in the same direction on the same day
The Red StopLine is a stop loss of 10% based on the combined strategic position average entry price.
I've used a 2D chart because I prefer longer-term charts for higher quality signals
The way I trade all the systems is to set up alerts to let me know when to look at what setups
The system also has a market filter and does not trade when the close is lower than its 200 days moving average
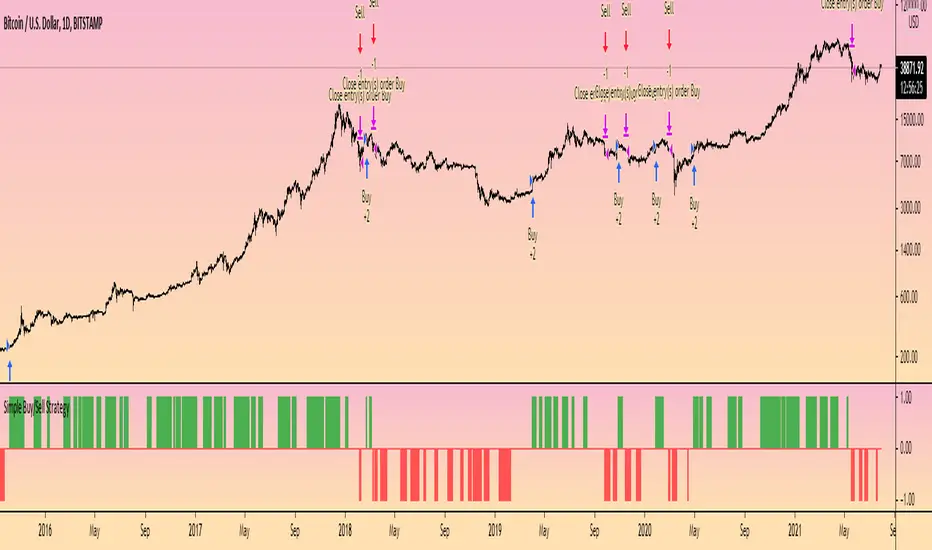
Simple Buy/Sell StrategyThis is the strategy version of the original 'Simple Buy/Sell Indicator' by @Shizaru .
The original indicator description explains the logic behind the strategy:
"The original script was posted on ProRealCode by user Doctrading.
This little and simple code allows you to draw an indicator, which show you when buy or sell conditions are met.
For "buy" conditions, I did just set :
close > MM200
close > Parabolic SAR
MACD > 0
RSI7 > 50
For "sell" conditions : the opposite.
Of course, you can set what you want, in order to test your strategies.
Of course, to be profitable, you must also set your trading rules (entry, stop loss, trailing stop, take profit, etc.)
It's only an indicator, which doesn't show entry or exit rules."
Hope this helps someone!
Multi-X by HamidBoxHello to All, introducing Multi Types Crossover strategy,
simply the best way of trading with Crossover and Crossunder Strategy, How it Works???
I added 5 types of Moving Averages,
1: Simple Moving Average ( SMA )
2: Exponential Moving Average ( EMA )
3: Weighted Moving Average ( WMA )
4: Volume Weighted Moving Average ( VWMA )
5: Relative Moving Average (RMA)
With this indicator, you can do scalping, You can trade not only with similar types of Moving Average indicators but also with different types of Moving Average indicators.
what is mean? like: Normal Condition is:
( Simple Moving Average ) Crossover to ( Simple Moving Average ), SMA x SMA
( Exponential Moving Average ) Crossover to ( Exponential Moving Average ), EMA x EMA
But we can Crossover with:
( Exponential Moving Average ) Crossover to ( Simple Moving Average ), EMA x SMA
( Simple Moving Average ) Crossover to ( Weighted Moving Average ), SMA x WMA
( Weighted Moving Average ) Crossover to ( Weighted Moving Average ), WMA x WMA
( Simple Moving Average ) Crossover to (Relative Moving Average), WMA x RMA
and also I added Moving Average ZONE in this tool, What does it work???
The zone will tell us what type of direction the market has, if the market is above the zone, it's mean we have a Bullish Trend, and if the market is below the zone, it means the market has a Bearish Trend,
so if you want to play on the safe side, never trade when the market is in Bearish Trend, and if you want to play on aggressive mood, you can skip Moving Average Zone section.

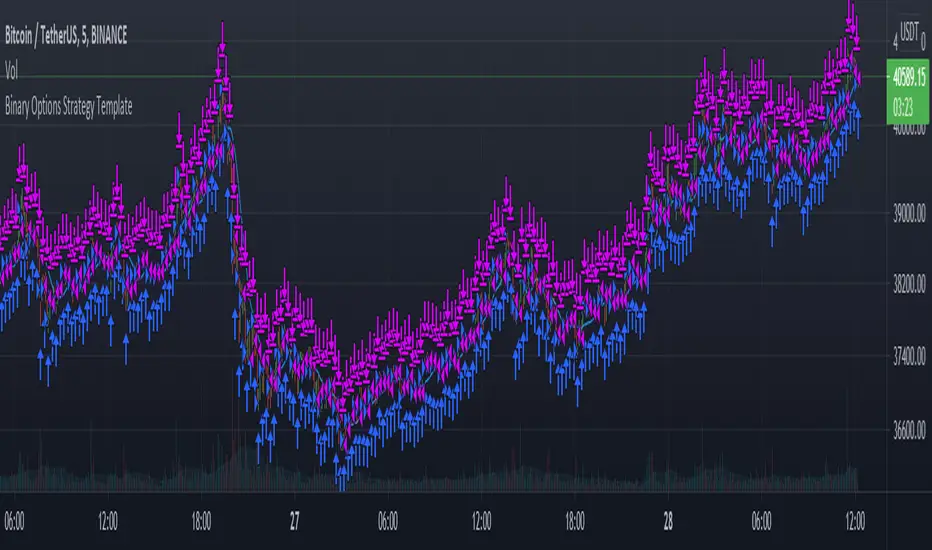
Binary Options Strategy TemplateWith the hype around Binary Options trading (more like gambling instead of trading) it is good to be able to backtest a strategy before using it in the live markets.
In a Binary Options trade the trade get's closed after a specific amount of time and the only thing that matters is if the market has increased in price or decreased after that amount of time.
Because of this a strategy backtest should close all positions after a specific amount of time. In this super small script the number of bars since the trade was opened is used as a way to close the position. So for example if you use this strategy on the 1 minute charts with number of bars set to 5 it will close the position 5 minutes after opening it. Purpose of this script is using it as a strategy on already existing scripts to check viability for options trading.
With the limited pine knowledge that I have I do not know if it is possible to create a more realistic binary options strategy which also calculated the profit. If someone knows a more advanced version of this please let me know.
Combo Backtest 123 Reversal & STARC BandsThis is combo strategies for get a cumulative signal.
First strategy
This System was created from the Book "How I Tripled My Money In The
Futures Market" by Ulf Jensen, Page 183. This is reverse type of strategies.
The strategy buys at market, if close price is higher than the previous close
during 2 days and the meaning of 9-days Stochastic Slow Oscillator is lower than 50.
The strategy sells at market, if close price is lower than the previous close price
during 2 days and the meaning of 9-days Stochastic Fast Oscillator is higher than 50.
Second strategy
A type of technical indicator that is created by plotting two bands around
a short-term simple moving average (SMA) of an underlying asset's price.
The upper band is created by adding a value of the average true range
(ATR) - a popular indicator used by technical traders - to the moving average.
The lower band is created by subtracting a value of the ATR from the SMA.
STARC is an acronym for Stoller Average Range Channels. The indicator is
named after its creator, Manning Stoller.
WARNING:
- For purpose educate only
- This script to change bars colors.

Kwan NRP Backtest To calculate the coordinates in which the kink of the line will cross,
the standard Forex instruments are used - Relative Strenght Index, Stochastic and Momentum.
It is very easy to optimize them for the existing trading strategy: they all have very
flexible and easily customizable parameters. Signals to enter the market can be 2 situations:
Change of color of the indicator line from red to blue. At the same time, it is worth entering into the purchase;
Change of color of the indicator line from blue to red. In this case, it is worth entering for sale.
The signals are extremely clear and can be used in practice even by beginners. The indicator
itself shows when to make deals: the user only has to accompany them and set the values
of Take Profit and Stop Loss. As a rule, the signal to complete trading is the approach of
the indicator level to the levels of the maximum or minimum of the previous time period.

[TVExtBot]Volatility Breakout Trend Strategy(1H&2H)The Volatility Breakout Trend Strategy is a short-term trend strategy that has been modified to enable trading in both long and short directions by optimizing the Volatility Breakout Basic Strategy for 1Hour and 2Hour candles.
Select Timeframe=60 for the input to use on the 1Hour candle and Timeframe=120 for the 2Hour candle.
변동성 돌파 트렌드 전략은 변동성 돌파 기본 전략을 1시간과 2시간 캔들에 최적화하여 롱과 숏 양방향으로 매매가능하도록 수정한 단기 추세 전략입니다. (※1,2시간봉 에서만 사용가능)
1시간봉에서 사용하기 위해서는 입력에서 Timeframe=60을 선택하고 2시간봉에서는 Timeframe=120을 선택합니다.
Default Options(기본설정)
Timeframe (Min) (사용시간봉) : 120분 (※60분과 120분 선택가능)
Noise Ratio (Day) (노이즈비율기간) : 30일
BeforeDay Open-Close Volatility (%) (전날 시가종가 변동률) : 7%
ToDay Open-Close Volatility (%) (당일 시가종가 변동률) : 7%
TakeProfit (%) (익절) : 15%
Trailing Stop(%) (트레일링 스탑) : 5%

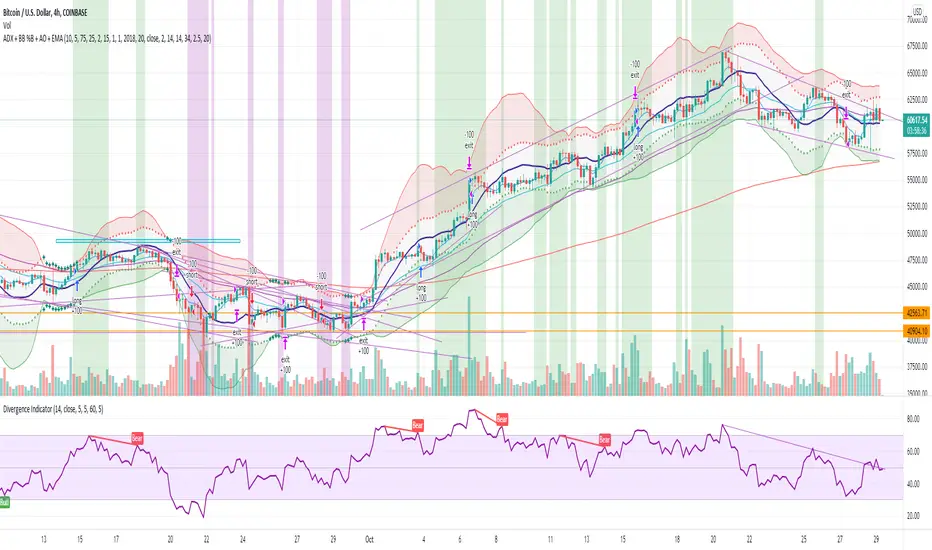
ADX + BB %B + AO + EMA [Luca Massuda]This trading strategy combines different indicators:
1) ADX, Average Directional Movement: to spot the trend
2) BB %B Bollinger Band %B: to spost relative price position to Bollinger Bands
3) AO Awesome Oscillator: to spot momentum
4) ema 5,ema21, ema50, ema200: to decide long or short position
You can configure:
Take profit % : at which % gains to take profit from the entry price
Stop loss % : at which % stop loss from the entry price
BB %B Overbought: At which level you consider Overbought respect to Bollinger Bands (values 0 to 100)
BB %B Oversold: At which level you consider Oversold respect to Bollinger Bands (values 0 to 100)
Awesome Oscillator: AO level to consider a long or short position +/- 2
ADX: ADX value to consider a long or short position
Start Date, Month, Year: Starting point for a backtesting strategy
Lenght , Source , Standard Deviation: Bollinger Bands values
ADX smoothing, DI Lenght: ADX values
Green and purple zones indicate when the strategy can go long or short.
Default Long conditions:
ema5>ema21 and ema50>ema200 and bb>75% and ao>2 and adx>15
Default Short conditions:
ema515
Combo Backtest 123 Reversal & Smoothed Williams ADThis is combo strategies for get a cumulative signal.
First strategy
This System was created from the Book "How I Tripled My Money In The
Futures Market" by Ulf Jensen, Page 183. This is reverse type of strategies.
The strategy buys at market, if close price is higher than the previous close
during 2 days and the meaning of 9-days Stochastic Slow Oscillator is lower than 50.
The strategy sells at market, if close price is lower than the previous close price
during 2 days and the meaning of 9-days Stochastic Fast Oscillator is higher than 50.
Second strategy
Accumulation is a term used to describe a market controlled by buyers;
whereas distribution is defined by a market controlled by sellers.
Williams recommends trading this indicator based on divergences:
Distribution of the security is indicated when the security is making
a new high and the A/D indicator is failing to make a new high. Sell.
Accumulation of the security is indicated when the security is making
a new low and the A/D indicator is failing to make a new low. Buy.
WARNING:
- For purpose educate only
- This script to change bars colors.

Wunder VolPIN StrategyI believe it is perhaps one of the world's simplest but one of the rare indicators where backtest results are so efficient. As a strategy, we buy every time a buy signal comes, but we need to repeat this 20 times and we buy when our average rises by 0.65 percent. I know that this indicator, which I did not prepare for the sales strategy, also works very efficiently in sales transactions.
On settings part you can change the volatility and PIN percentage. I prepare for 1 minute graphs for coins. Maybe if you can arrange the settings for the stocks and different time periods.
I use this strategy in one minute periyod. 20 times buy strategy is very important. On every buy signal you must work in process. You can arrange stoploss if you want. But I am not using stoploss system.

Combo Backtest 123 Reversal & Smoothed RSIThis is combo strategies for get a cumulative signal.
First strategy
This System was created from the Book "How I Tripled My Money In The
Futures Market" by Ulf Jensen, Page 183. This is reverse type of strategies.
The strategy buys at market, if close price is higher than the previous close
during 2 days and the meaning of 9-days Stochastic Slow Oscillator is lower than 50.
The strategy sells at market, if close price is lower than the previous close price
during 2 days and the meaning of 9-days Stochastic Fast Oscillator is higher than 50.
Second strategy
This is new version of RSI oscillator indicator, developed by John Ehlers.
The main advantage of his way of enhancing the RSI indicator is smoothing
with minimum of lag penalty.
WARNING:
- For purpose educate only
- This script to change bars colors.