CR MTF True Sight V1.0MTF True Sight is the next generation of my Plain True Sight strategy. While Plain True Sight is more patient, MTF is designed to respond with more agility.
M-oscillator

Combo Backtest 123 Reversal & (H-L)/C Histogram This is combo strategies for get
a cumulative signal. Result signal will return 1 if two strategies
is long, -1 if all strategies is short and 0 if signals of strategies is not equal.
First strategy
This System was created from the Book "How I Tripled My Money In The
Futures Market" by Ulf Jensen, Page 183. This is reverse type of strategies.
The strategy buys at market, if close price is higher than the previous close
during 2 days and the meaning of 9-days Stochastic Slow Oscillator is lower than 50.
The strategy sells at market, if close price is lower than the previous close price
during 2 days and the meaning of 9-days Stochastic Fast Oscillator is higher than 50.
Second strategy
This histogram displays (high-low)/close
Can be applied to any time frame.
WARNING:
- For purpose educate only
- This script to change bars colors.

Combo Backtest 123 Reversal & Bandpass FilterThis is combo strategies for get
a cumulative signal. Result signal will return 1 if two strategies
is long, -1 if all strategies is short and 0 if signals of strategies is not equal.
First strategy
This System was created from the Book "How I Tripled My Money In The
Futures Market" by Ulf Jensen, Page 183. This is reverse type of strategies.
The strategy buys at market, if close price is higher than the previous close
during 2 days and the meaning of 9-days Stochastic Slow Oscillator is lower than 50.
The strategy sells at market, if close price is lower than the previous close price
during 2 days and the meaning of 9-days Stochastic Fast Oscillator is higher than 50.
Second strategy
The related article is copyrighted material from
Stocks & Commodities Mar 2010
You can use in the xPrice any series: Open, High, Low, Close, HL2, HLC3, OHLC4 and ect...
WARNING:
- For purpose educate only
- This script to change bars colors.


Combo Backtest 123 Reversal & Average True Range Trailing Stops This is combo strategies for get
a cumulative signal. Result signal will return 1 if two strategies
is long, -1 if all strategies is short and 0 if signals of strategies is not equal.
First strategy
This System was created from the Book "How I Tripled My Money In The
Futures Market" by Ulf Jensen, Page 183. This is reverse type of strategies.
The strategy buys at market, if close price is higher than the previous close
during 2 days and the meaning of 9-days Stochastic Slow Oscillator is lower than 50.
The strategy sells at market, if close price is lower than the previous close price
during 2 days and the meaning of 9-days Stochastic Fast Oscillator is higher than 50.
Secon strategy
Average True Range Trailing Stops Strategy, by Sylvain Vervoort
The related article is copyrighted material from Stocks & Commodities Jun 2009
WARNING:
- For purpose educate only
- This script to change bars colors.

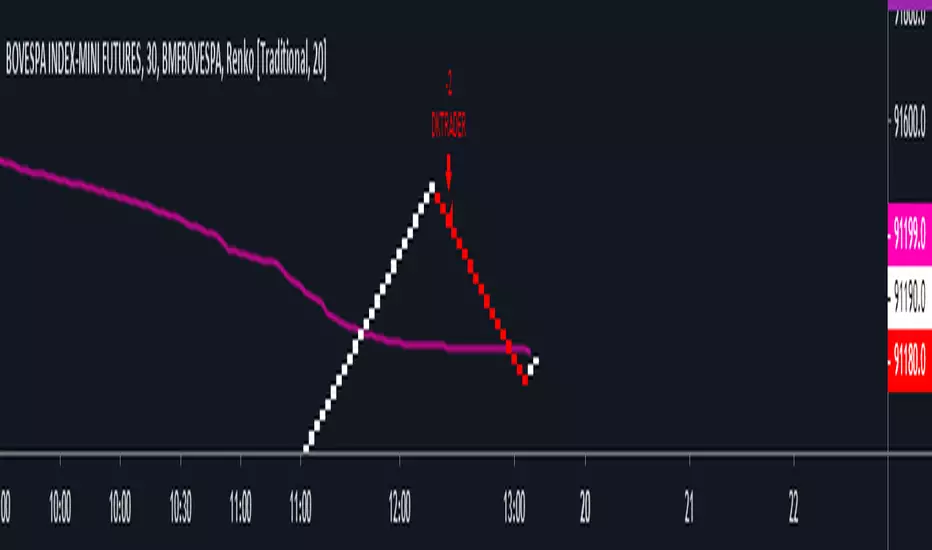
Arrow Pro - Versão 2.0 DK Trader Essa versão do arrow pro foi atualizada para retirar ainda mais o ruídos da primeira versão, trazendo maior taxa de acertos e também diminuindo os sinais falsos. Este indicador será liberado para os alunos e os compradores da primeira versão sem nenhum custo. Em breve também ficará disponível para a plataforma ProfitChart.
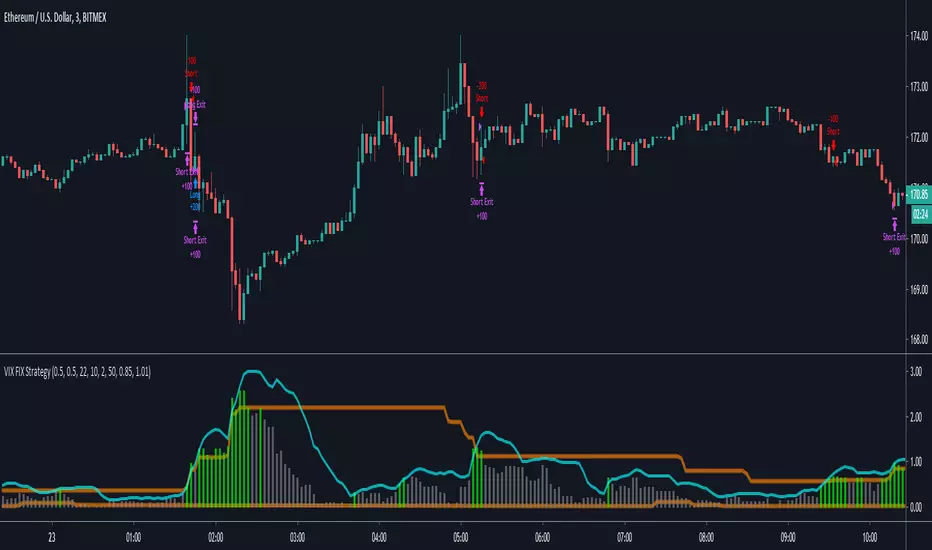
Kozlod - RSI Strategy - 1 minuteStarted to play with very simple strategies. Trying to find ones with optimal parameters which work well for certain symbols/timeframe.
Found that basic RSI strategy without any position management with high RSI length (65 in this script) works pretty good for 1m chart for few stocks.
It's also not bad for AAPL , SPY .
It might not work very good on it's not but can give you a pretty good base for more complicated indicators.
And remember:
Past performance does not guarantee future results.

Average True Range StrategyAverage True Range Strategy by Elec
Average True Range Trailing Stops Strategy
Average True Range Strategy
Typically, the Average True Range (ATR) is based on 14 periods and can be calculated on an intraday, daily, weekly or monthly basis. For this example, the ATR will be based on daily data. Because there must be a beginning, the first TR value is simply the High minus the Low, and the first 14-day ATR is the average of the daily TR values for the last 14 days. After that, Wilder sought to smooth the data by incorporating the previous period's ATR value.
Current ATR = / 14
- Multiply the previous 14-day ATR by 13.
- Add the most recent day's TR value.
- Divide the total by 14

PR Strategy - PR Free (By Wolf)BITMEX:XBTUSD 4H
BITMEX:XBTUSD
모든코인에 적용할수있습니다.
Applicable to all coins
이름(Name)
PR Strategy (By Wolf)
-해당 전략은 Long & Short 의 신호를 발생시키는 전략입니다.
-The strategy is to generate a signal from Long & Short
이용 요금(Cost)
Free
알트코인 적용 및 수수료 변경 피라미딩 거래에대해 궁금하신내용은 메세지주세요.
Please send me a message about the trading Alt coin of the pyramid.
지표 및 전략 개발 요청
Requests for Indicators and Strategy Development
-TradingView Message
테스트(Test)
-트레이딩뷰 메시지 (TradingView Message)
소스코드(Source code)
-비공개 (not open to the public)
*모든 전략은 리페인트 코드를 등록하지않았습니다.
-All strategies do not register the repaint code
*모든 거래는 높은 위험을 수반하며, 과거 백테스트 결과가 반드시 현재 및 미래의 결과를 나타내는것은 아닙니다.
가상 또는 시뮬레이션 백테스트 결과는 한계를 가지고 있으며 실제거래와 시장의 변동 및 유동에 따라 똑같지않을
가능성이있으며, 모든 손실에 대한 책임은 본인에게 있습니다.

Dolar/Tl Trend bot / Daily chartDolar/Tl Trend bot / Daily chart.
bot should be used for daily chart.
Bot günlük grafikte kullanılır.

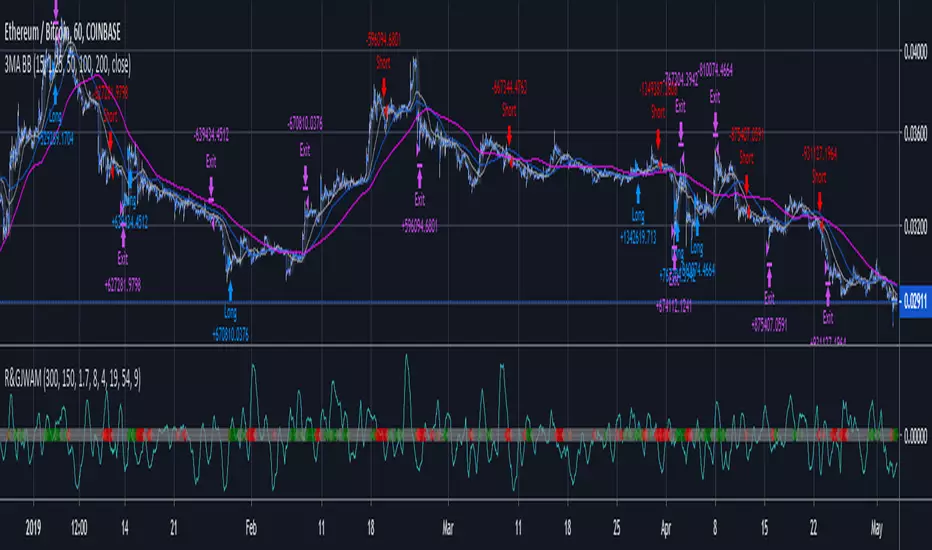
Pro Run & Gun Strategy [jwammo12] This is a trend-trading strategy specifically designed for crypto trading on lower time frames.
message me for pricing or to test trial.
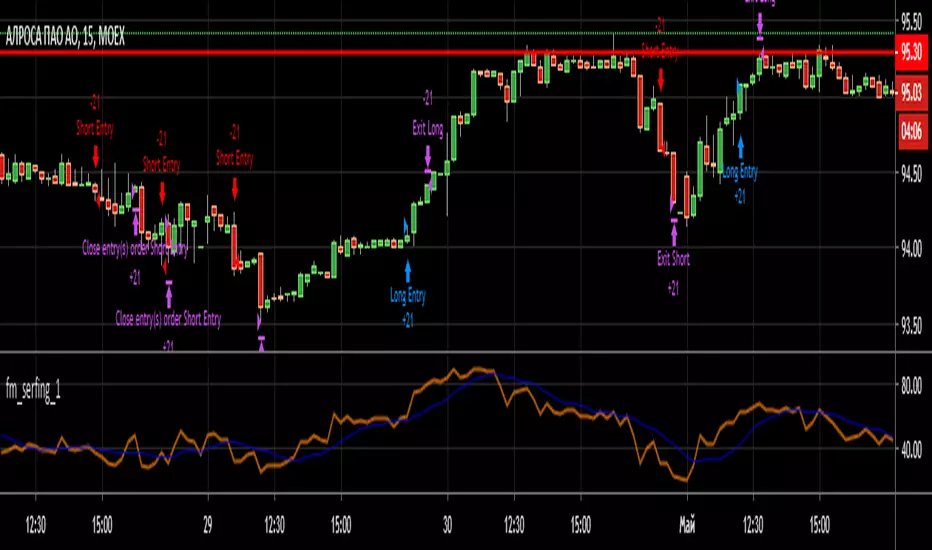
fm_surfing_1This script is a realisation of a strategy that I used to know from FOREX-forums as Surfing. I wrote it first as MQL-Strategy back in 2014. Today it was remastered in pinescript. This strategy is recomended for TF 15M and above.
Below is a short description of rules
Buy Stop: close of a candel is above slow green EMA (20), RSI is greater than 55 and the rolling mean of RSI with period 10 is under RSI itself.
Sell Stop: vice-versa, slow red EMA(20) is used for the signal, as RSI lower band is used 45 value.
Exit rules: rolling mean of RSI crosses the RSI itself.Trailing stop is used as well as take profit.
What is not decripted are to fast EMA(10) which had to be used as the basis for calculating trailing stop, what is currently a task for the future optimization.
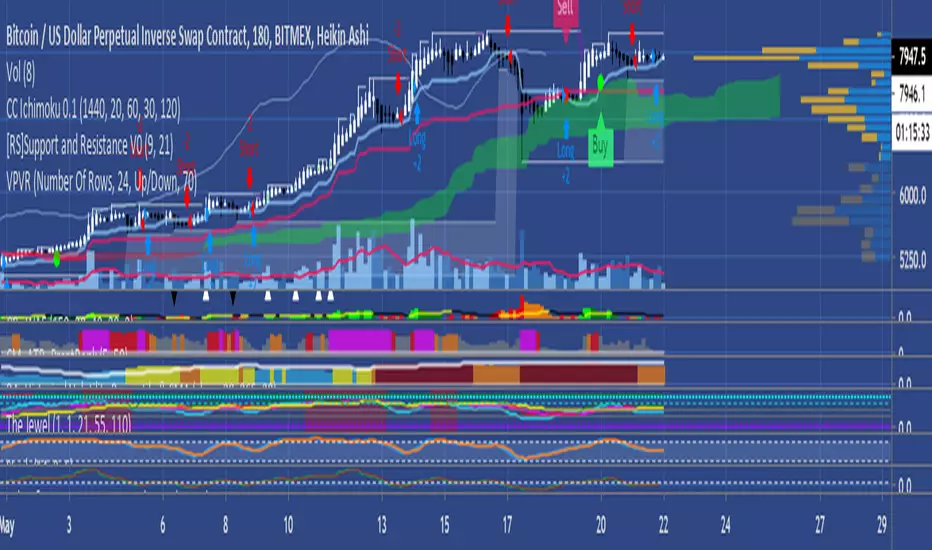
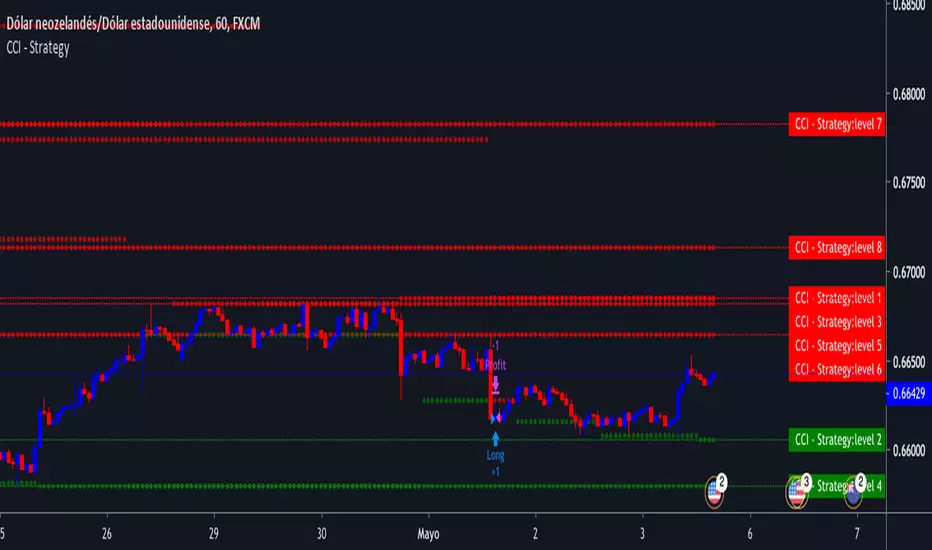
RSI-Stoch-CCI with S/RThe script works with RSI and Stoch to make sure the price is oversold or overbought, but also use CCI to identify the cyclical trends. If the price is on support or resistance and the indicators are oversold or overbought and alert there's an option to buy or sell.
Combo Backtest 123 Reversal and ADXR This is combo strategies for get
a cumulative signal. Result signal will return 1 if two strategies
is long, -1 if all strategies is short and 0 if signals of strategies is not equal.
First strategy
This System was created from the Book "How I Tripled My Money In The
Futures Market" by Ulf Jensen, Page 183. This is reverse type of strategies.
The strategy buys at market, if close price is higher than the previous close
during 2 days and the meaning of 9-days Stochastic Slow Oscillator is lower than 50.
The strategy sells at market, if close price is lower than the previous close price
during 2 days and the meaning of 9-days Stochastic Fast Oscillator is higher than 50.
Secon strategy
The Average Directional Movement Index Rating (ADXR) measures the strength
of the Average Directional Movement Index (ADX). It's calculated by taking
the average of the current ADX and the ADX from one time period before
(time periods can vary, but the most typical period used is 14 days).
Like the ADX, the ADXR ranges from values of 0 to 100 and reflects strengthening
and weakening trends. However, because it represents an average of ADX, values
don't fluctuate as dramatically and some analysts believe the indicator helps
better display trends in volatile markets.
WARNING:
- For purpose educate only
- This script to change bars colors.

TradeWright 1.0 Strategy Results - Surprised myselfPublishing this script because I was proud of the results. There's no BS repainting or time frame manipulation here - just some good old fashioned hard work and thought that turned into a complete system. Will be using it to trade mostly currencies in the coming months - I'll update this script with results. PM me if you want access? I might grant it. Don't want to ruin my edge though.


Combo Backtest 123 Reversal and Accelerator Oscillator (AC) This is combo strategies for get
a cumulative signal. Result signal will return 1 if two strategies
is long, -1 if all strategies is short and 0 if signals of strategies is not equal.
First strategy
This System was created from the Book "How I Tripled My Money In The
Futures Market" by Ulf Jensen, Page 183. This is reverse type of strategies.
The strategy buys at market, if close price is higher than the previous close
during 2 days and the meaning of 9-days Stochastic Slow Oscillator is lower than 50.
The strategy sells at market, if close price is lower than the previous close price
during 2 days and the meaning of 9-days Stochastic Fast Oscillator is higher than 50.
Second strategy
The Accelerator Oscillator has been developed by Bill Williams
as the development of the Awesome Oscillator. It represents the
difference between the Awesome Oscillator and the 5-period moving
average, and as such it shows the speed of change of the Awesome
Oscillator, which can be useful to find trend reversals before the
Awesome Oscillator does.
WARNING:
- For purpose educate only
- This script to change bars colors.

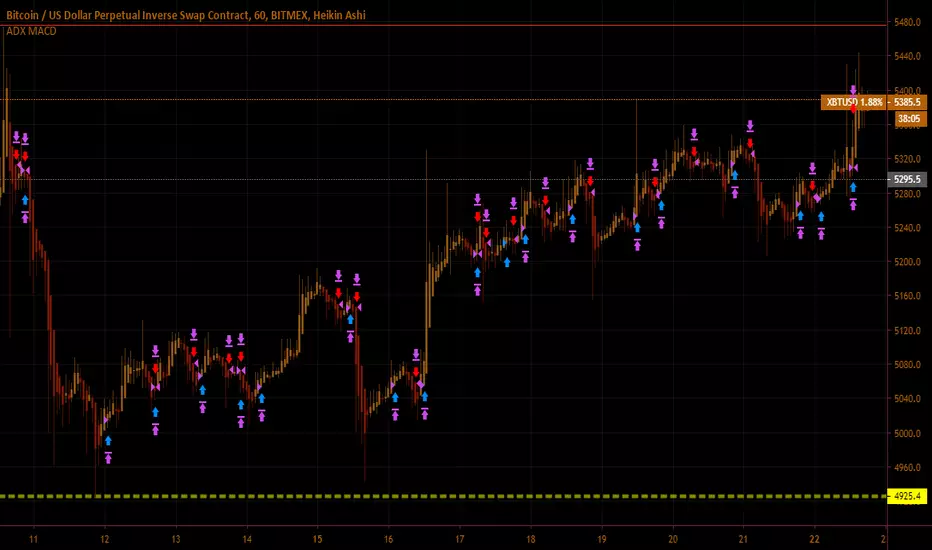
E-Z's Slither Maker Strategy v0.01This is a strategy I built based on custom MACD and ADX/DMI settings.
Works best for scalping the one hour.
If you run into any issues let me know.
If this script makes you money and feel thankful for all my hard work, you can donate to the addresses below <3
BTC: 3CS6VqDrCf7XRn46bqcXMUZQecbQJ7TKfs
BCC/BCH: bitcoincash:qqrca9z7w2gl2wevjvry6uv7quhcn7kaycx43r34tf
DOGE: AC9tZB6NMoWpvMZmmtop5yXsv7GhHYAxWd
LTC: 34HajDFE3aDWgs1etG3851CLvqNV9pg5Te