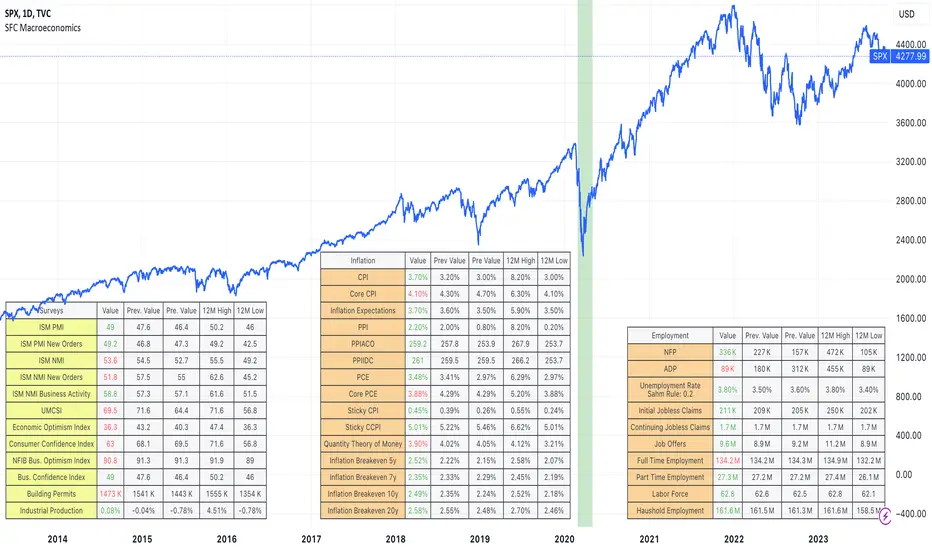
SFC MacroeconomicsThe Macroeconomics indicator can give us an instant view of the most important economic indicators. The indicator displays different tables in different sectors:
- Money : It give us a basic information about the money indicators in USA;
- Surveys: They are usually used as leading indicators.
- Inflation: It is showing overall inflation in the country
- Employment: Provides deep information about the current labor market
- Government: Usually legging indicators, but providing very good information about the USA
- Others: Few important indicators, for example GDP.
How we can use the indicator:
1) The indicator can be used to help traders, getting an instant overview of the economic indicators, helping them to create the Macroeconomic analysis.
2) The indicator can be use as a preparation before the high-impact news.
Note:
Yellow colour - leading indicators
Orange colour - legging indicators
Tables are showing the current data, also 12 months high and low. This is very important information, because it shows the extremes and normally if the current data is 12 months high or low it will be observed by the big players.
Before use this indicator, traders need basic macroeconomic understanding. A good knowledge is required in order to take advantage of the indicators and create the economic analysis or bias.
الاقتصاد الكلي

Economic Calendar (Import from Spreadsheet)This script draws vertical lines to mark Economic Calendar Events.
Datetime of events is defined by user in Settings via a standardized line of text.
Motivation for coding this script:
All traders should be aware of economic calendar events. At times, when you really need to pay attention to an upcoming major event, you might even decide to use the vertical-line drawing tool to mark it. However, this takes manual effort.
This script provides a solution to performing mundane tasks such as drawing vertical lines and dragging them ever so slightly, just to have them approximately aligned with exact time.
Parameters:
(1) Source data - String representation of collection of datetime referencing to Economic Calendar Events
(2) Line color, & (3) Width of line - For displaying vertical lines drawn by script.
Standardized format for Source Data :
Example:
If 'GMT;2022,6,1,14,0,0;2022,6,2,12,15,0;' is provided to PineScript, then two vertical lines will be drawn on June 6, 2022 according to the exact time in 'YYYY,MM,DD,hh,mm,ss' format at the specified timezone (GMT in this case).
Template for Source Data :
Included here, link below, is a shared Google Sheet that systematically processes Economic Calendar data provided in the 'Raw Data' tab.
drive.google.com
Users are advised to use their preferred methods* to format the string (for source data param.), and apply their own criteria to sort down the Events. (ie. only include Events of High Impact, etc.)
* Preferred methods (as mentioned above) does not mean being limited to using the template as provided in this post.

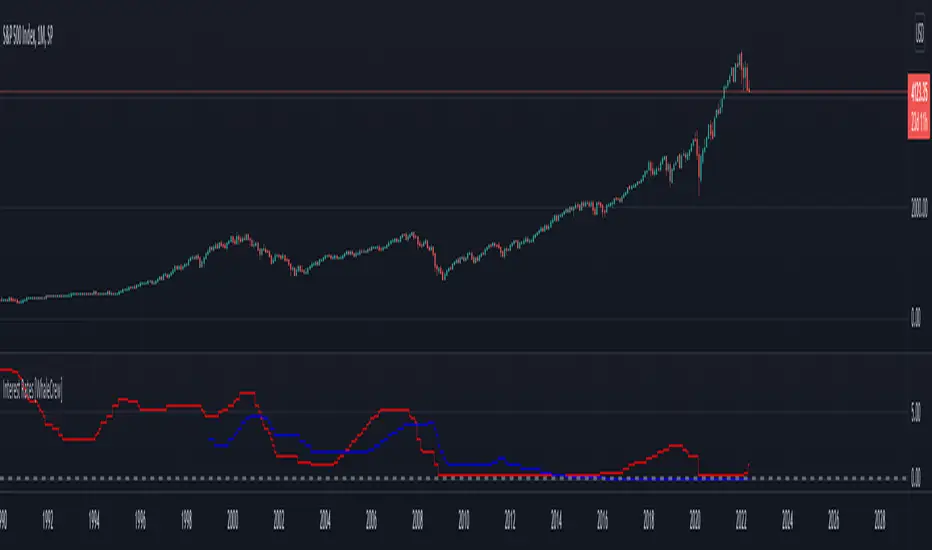
Interest Rates [WhaleCrew]This indicator allows you to display the interest rates of multiple central banks (US, EU, China, Russia, Japan, UK, ...) at once.
Built-in Interest Rates
US ECONOMICS:USINTR
EU ECONOMICS:EUINTR
China ECONOMICS:CNINTR
Russia ECONOMICS:RUINTR
Japan ECONOMICS:JPINTR
UK ECONOMICS:GBINTR
Custom Symbol (default: ECONOMICS:CHINTR )
7-10 flattener tradeIn the budget speech for FY 2023, market borrowing of 14.95 lakh crore from the market. In the Feb MPC meeting, the RBI brought down its estimates of growth and inflation potentially signaling that economy is/will go through a demand slowdown.
Now in a slowing economy, the govt. finances will be affected. Therefore, to bring back the economy on the fiscal consolidation so that sovereign bond ratings are not hit, the Indian govt. must figure out a way
1. Lower its interest payments in the face of increasing public expenditure on creating public infrastructure (read roads/highways etc. ). One simple way is to go down the yield curve in lower maturities to bring down the interest costs.
Keeping in mind (1) above, it was not difficult to expect a borrowing schedule where the shorter tenors will form a bigger percentage of the net issuance by the government.
In fact, if you look at the issuance calendar for securities below the tenor of 10 yrs (which is 2,5,7 yrs), you will find that itself comprises of ~31% of total borrowings.
Therefore, due to increased pressure on the shorter tenors and relatively less pressure on 10 yr bond yield, we can expect the yields spreads to compress in 7-10 yr region of the yield curve.
This script is written to track the same yield spread compression across 7 & 10 yr tenor.

US Treasury Constant Maturity SpreadsPlots and tabulates constant maturity treasury yield spreads
// colours per curve type for the plots and table headers
C_30Y_20Y=color.orange
C_10Y_5Y=color.purple
C_10Y_2Y=color.blue
C_7Y_5Y=color.gray
C_5Y_2Y=color.red
C_3Y_2Y=color.yellow
C_10Y_1Y=color.olive

Macroeconomic Artificial Neural Networks
This script was created by training 20 selected macroeconomic data to construct artificial neural networks on the S&P 500 index.
No technical analysis data were used.
The average error rate is 0.01.
In this respect, there is a strong relationship between the index and macroeconomic data.
Although it affects the whole world,I personally recommend using it under the following conditions: S&P 500 and related ETFs in 1W time-frame (TF = 1W SPX500USD, SP1!, SPY, SPX etc. )
Macroeconomic Parameters
Effective Federal Funds Rate (FEDFUNDS)
Initial Claims (ICSA)
Civilian Unemployment Rate (UNRATE)
10 Year Treasury Constant Maturity Rate (DGS10)
Gross Domestic Product , 1 Decimal (GDP)
Trade Weighted US Dollar Index : Major Currencies (DTWEXM)
Consumer Price Index For All Urban Consumers (CPIAUCSL)
M1 Money Stock (M1)
M2 Money Stock (M2)
2 - Year Treasury Constant Maturity Rate (DGS2)
30 Year Treasury Constant Maturity Rate (DGS30)
Industrial Production Index (INDPRO)
5-Year Treasury Constant Maturity Rate (FRED : DGS5)
Light Weight Vehicle Sales: Autos and Light Trucks (ALTSALES)
Civilian Employment Population Ratio (EMRATIO)
Capacity Utilization (TOTAL INDUSTRY) (TCU)
Average (Mean) Duration Of Unemployment (UEMPMEAN)
Manufacturing Employment Index (MAN_EMPL)
Manufacturers' New Orders (NEWORDER)
ISM Manufacturing Index (MAN : PMI)
Artificial Neural Network (ANN) Training Details :
Learning cycles: 16231
AutoSave cycles: 100
Grid
Input columns: 19
Output columns: 1
Excluded columns: 0
Training example rows: 998
Validating example rows: 0
Querying example rows: 0
Excluded example rows: 0
Duplicated example rows: 0
Network
Input nodes connected: 19
Hidden layer 1 nodes: 2
Hidden layer 2 nodes: 0
Hidden layer 3 nodes: 0
Output nodes: 1
Controls
Learning rate: 0.1000
Momentum: 0.8000 (Optimized)
Target error: 0.0100
Training error: 0.010000
NOTE : Alerts added . The red histogram represents the bear market and the green histogram represents the bull market.
Bars subject to region changes are shown as background colors. (Teal = Bull , Maroon = Bear Market )
I hope it will be useful in your studies and analysis, regards.
