SCOTTGO ORB V1SCOTTGO ORB (Opening Range Breakout) Indicator
The ORB Indicator is a powerful tool for day traders and scalpers, designed to automatically identify and project key price levels based on the market's initial trading activity—the Opening Range (OR).
It helps you quickly visualize the market structure, potential breakout zones, and price targets for the day.
🔑 Key Features & Customization
1. Dynamic Opening Range Calculation
Flexible Time Periods: Easily define your Opening Range using preset times of 5, 15, or 30 minutes. You can also use the International Overrides to set a custom start and end time with a specified timezone.
Visual Range: The indicator automatically calculates and shades the range between the ORB High and ORB Low prices. The Opacity of this shaded box is fully adjustable.
2. Comprehensive Price Targets
The indicator projects multiple levels of price targets (PTs) based on the size of the initial Opening Range, enabling you to set profit targets and manage risk. Targets are grouped for easy toggling:
Default Targets (50%): Visualize the immediate $50\%$ price extension above and below the ORB.
Extended Targets (75%, 100%): View the $75\%$ and full $100\%$ extension levels.
Further Targets (150%, 200%): Explore extended targets for volatile or trending days.
Mid Point: Optional line to display the $50\%$ retracement/midpoint of the ORB itself.
3. Fibonacci Extensions
Access highly relevant price projections using classic Fibonacci ratios:27.2% and 61.8% Extensions: These provide additional high-probability price targets for breakout scenarios.
4. Breakout & Retest Signaling
Entry Signals: Displays on-chart labels for potential ORB Breakouts and subsequent
Retests (BRB), helping you identify high-probability entry points.
Alert Options: Set alerts for simple ORB level crosses or restrict alerts only to confirmed breakout scenarios (Alert only on ORB breakouts).
🎨 Style Customization
All main ORB lines, target levels, and Fibonacci lines can be individually styled (color, thickness, line type) directly within the TradingView Style tab for a personalized chart experience. Dedicated inputs are available for setting colors for 50%, 75%, 100%, and Fibonacci 27.2% / 61.8% levels.
💡 How to Use
1. Set Your ORB Period: Choose the time frame that best suits your market (e.g., 15 minutes is common for US indices).
2. Monitor the Breakout: Once the ORB session ends, wait for the price to break above the ORB High or below the ORB Low.
3. Target and Risk: Use the projected Price Targets to define your potential profit zones, and place stop-losses just inside the ORB range.
SCOTTGO
Marketopen

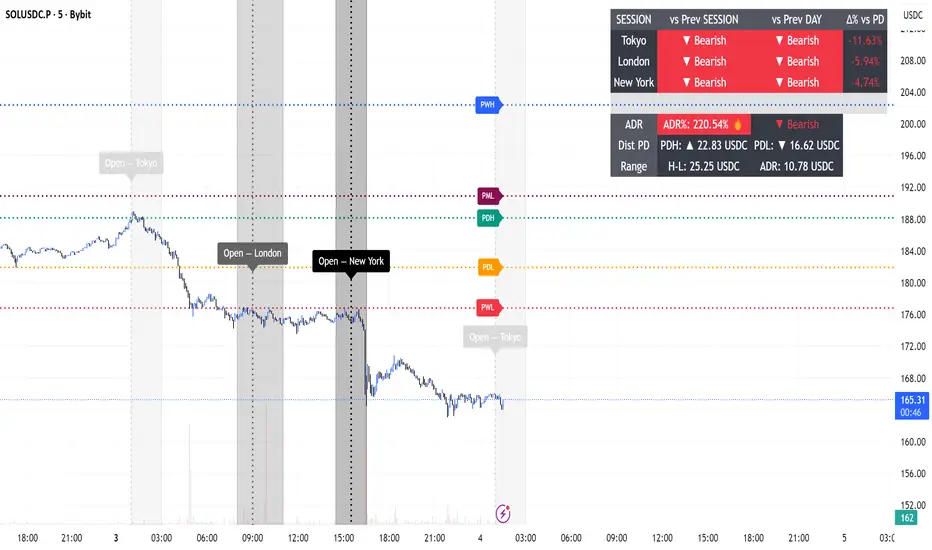
ADR Daily Range + Volatility + KZs — SMC/ICT (@PueblaATH)ADR Daily Range + Volatility + KZs — SMC/ICT (@PueblaATH) is a complete intraday context and volatility HUD that plots market opens, killzones, previous period highs/lows, and a dynamic ADR/volatility dashboard. It is built to give SMC/ICT traders an at-a-glance view of when and where price is moving: sessions, overlaps, ranges, and distance to key levels, all on a single clean overlay.
What the Indicator Does
Market Opens (Tokyo, London, New York)
Professional-grade session open lines with:
Individually configurable open times per session and timezone.
Infinite vertical lines or height-limited extensions (custom tick offsets).
Fully styled labels: size, alignment, auto-background, manual background, and vertical offset.
Killzones & Session Overlaps
Precision-timed shaded boxes for:
Tokyo Killzone
London Killzone
New York Killzone
London–New York Overlap
Previous Period Levels (PDH/PWH/PMH & PDL/PWL/PML)
Robust daily/weekly/monthly high/low engine:
Accurate Previous Day / Week / Month Highs & Lows (Europe/Madrid reference).
Line length modes: infinite, N bars, or end-of-day projection.
Per-level colors + labeled markers placed to the right of price with custom horizontal/vertical spacing.
Timeframe & Weekend Filters
Keep charts clean by hiding components based on:
Custom timeframe ranges (hide opens or killzones on HTFs).
Weekend filters for opens, killzones, and ADR/table.
Optional override to display the HUD table across all timeframes.
Session Comparison Table (Top-Right HUD)
A compact, institutional-style session dashboard comparing:
Tokyo, London, New York — current open vs previous session and previous day.
Bullish/Bearish state with color-coded logic (+ optional ▲/▼ arrows).
Optional Δ% change column relative to previous day’s open.
ADR / Volatility Panel (24h Rolling Window)
A powerful real-time volatility module providing:
True 24-hour rolling high–low range.
SMA-based ADR calculation with automatic bar-count safety limits.
ADR% expansion metric with two thresholds + blinking color logic for volatility extremes.
Directional bias vs price 24 hours ago (Bullish/Bearish).
Optional metrics: distance to PDH/PDL (in price units) and absolute H–L / ADR values.
How to Use It
Set each session’s open time and killzone window according to your broker or desired timezone alignment.
Enable or disable session opens and killzones to frame the trading windows you prioritize (e.g., LDN Killzone or NY session expansion).
Activate key previous period levels (PDH/PDL, PWH/PWL, PMH/PML) and tune the line-length mode and label spacing to match your workflow.
Use timeframe & weekend filters to keep higher-timeframe charts clean while maintaining precise intraday visibility on lower timeframes.
Monitor the session comparison table to understand directional behavior relative to previous sessions and previous day opens.
Watch the ADR panel to classify the day as compressed, normal, or expanded—and anticipate potential reversion or continuation.
Originality & Credits Disclaimer
This indicator is an original work by @PueblaATH , created specifically for the tool ADR Daily Range + Volatility + KZs — SMC/ICT (@PueblaATH) and distributed under the MPL 2.0 license.
While the concepts implemented—session opens, killzones, ADR, and previous highs/lows—are public and widely known in the trading community, this script introduces a uniquely integrated framework that combines:
Multi-timezone session scheduling with dynamic TF/weekend filtering.
A modular PDH/PWH/PMH + PDL/PWL/PML engine with versatile projection and labeling controls.
A precise 24-hour volatility model tied to an ADR panel with extension thresholds, blinking alerts, and distance-to-PD metrics.
A multi-session comparative table that unifies Tokyo, London, and New York open data in real time.
This work does not reuse or repackage code from other authors. Any future adaptations from public sources will always include full, transparent credit and documentation.

Session Engine — Market Opens, Killzones & Levels — SMC/ICTSession Engine — Market Opens, Killzones & Institutional Levels (Tokyo • London • New York) — SMC/ICT — TradingATH (PueblaATH)
Precision. Sessions. Structure.
Session Engine maps the institutional heartbeat of the day across Tokyo , London , and New York . It draws timezone-accurate Market Open Lines , clean Killzones (incl. London–NY overlap), and a rock-solid, timeframe-safe suite of Previous High/Low Levels (PDH/PDL/PWH/PWL/PMH/PML). On top, a compact Session Comparison Table with an integrated ADR panel shows extension, momentum context, and distance to key levels — at a glance.
Designed for SMC/ICT Traders who demand clarity and reliability, this tool stays stable when you change timeframe, reload, or zoom.
Map the day like a Pro : timezone-true Opens, configurable Killzones, TF-safe PDH/PDL/PWH/PWL/PMH/PML , and a sleek ADR panel beneath a Session Comparison Table . Built for precision SMC/ICT Execution . Zero flicker, full control.
Why Traders Love It
Timezone-Accurate Session Engine — Tokyo, London, New York opens and the London–NY overlap, all resolved to bar-time for precise plotting on any symbol.
Killzones you can trust — choose full-column height or price-bounded height with custom top/bottom tick offsets and label placement.
Bulletproof Previous Levels — PDH, PDL, PWH, PWL, PMH, PML are cached and only refresh on true D/W/M boundaries, eliminating the classic “levels disappear on TF change” problem.
Actionable Context — a compact Session Comparison Table (vs previous session & vs previous day) plus an ADR panel with extension thresholds, distance to PDH/PDL, and current H-L range.
Serious Customization — dotted/solid lines, widths, label size & alignment, auto label backgrounds, block transparency, weekend & timeframe filters, and more.
Performance-Minded — persistent objects are updated in place (not spam-created) to keep your chart crisp and responsive.
What You’ll See
Market Opens — Vertical opens for TOK/LDN/NY with dotted/solid styling, width control, infinite or bounded height, and optional labels.
Killzones + Overlap — Transparent time boxes for session windows (and London–NY overlap). Optional labels, adjustable transparency, and height mode.
Institutional Levels — PDH / PDL / PWH / PWL / PMH / PML with length modes: Infinite, N bars, or End of day. Optional labels with typographic control.
Session Comparison Table — For each session: bias vs previous session and previous day, with optional Δ% column.
ADR Panel — 24h rolling ADR% consumption with two attention thresholds, distance to PDH/PDL (price units), and current H-L range.
How It Works
Session Timing uses explicit IANA timezones (Asia/Tokyo, Europe/London, America/New_York) then anchors to bar_time for pixel-perfect placement.
Killzones are persistent boxes that reset only on daily change, preventing redundant object creation.
Previous Levels are requested once per true period roll (D/W/M) and stored locally; this cache keeps lines stable when switching TFs or reloading charts.
Level Line Length is enforced per-object (Infinite, N bars, End of day) with dynamic x2 handling — no redraw flicker.
ADR uses a timeframe-agnostic 24h rolling window for H/L/range; ADR length is defined in “days” and mapped to bars for any timeframe.
How to Use
Set Session Times (defaults are standard). Adjust the London–NY overlap if your venue differs.
Style your Opens & Killzones — line width, dotted/solid, infinite or bounded height, label font size/align/background.
Choose Level Behavior — Infinite, N bars, or End of day for PD/ PW / PM lines; toggle labels as needed.
Read the Table and ADR — quick bias vs previous session/day, Δ% if you enable it; ADR panel highlights extension with blink thresholds and shows live distance to PDH/PDL.
Inputs
Schedules — Open times + killzone windows for TOK/LDN/NY, and London–NY overlap.
Style — Line width, dotted/solid, label sizes & alignment, auto backgrounds.
Heights — Infinite or tick-bounded line height; full-column or tick-bounded killzones.
Levels — Show/hide PDH/PDL/PWH/PWL/PMH/PML; length mode; label options.
Table & ADR — Font size, arrows, Δ% column, ADR length (days), blink thresholds, show/hide rows.
Filters — Hide visuals on specified timeframe ranges; optional weekend suppression.
Best Practices
Use “End of day” for tidy level lines that still convey right-hand context.
Set ADR thresholds to your instrument’s personality (e.g., 80/120 for FX, 100/150 for crypto).
On exotic trading sessions, verify the IANA timezone alignment and tweak inputs accordingly.
If you stack many tools, consider disabling unused sessions/rows to stay within object limits.
What Makes It Original
A cohesive Session Engine architecture that unifies timezone-true Opens, configurable Killzones/Overlap, and TF-safe previous levels — tailored for SMC/ICT execution.
Robust caching that eliminates TF-switch flicker and preserves dependent calculations (distance to PDH/PDL, ADR%) without gaps.
A unified ADR panel directly under the session table with real-time extension signaling and distance-to-PDH/PDL — pragmatic, trade-ready context you won’t find in generic session scripts.
Deep length & typography controls so visuals are informative and elegant.
Notes & Disclaimer (Originality & Rights)
Original Work Notice — Please read — This script/indicator is an original work created exclusively by TradingATH ( PueblaATH ). It is not derived from, copied from, or authored by any other person or entity. Any resemblance to other scripts is coincidental and limited to the use of public and widely known trading concepts.
Usage & Publication — Redistribution, cloning, or republishing this script (in whole or in part) without the explicit written permission of TradingATH ( PueblaATH ) is prohibited. By using this tool, you acknowledge the author’s exclusive authorship and associated rights.
No Financial Advice — This tool is for educational/informational purposes only and does not constitute financial advice. Markets carry risk; manage your risk and make your own decisions.
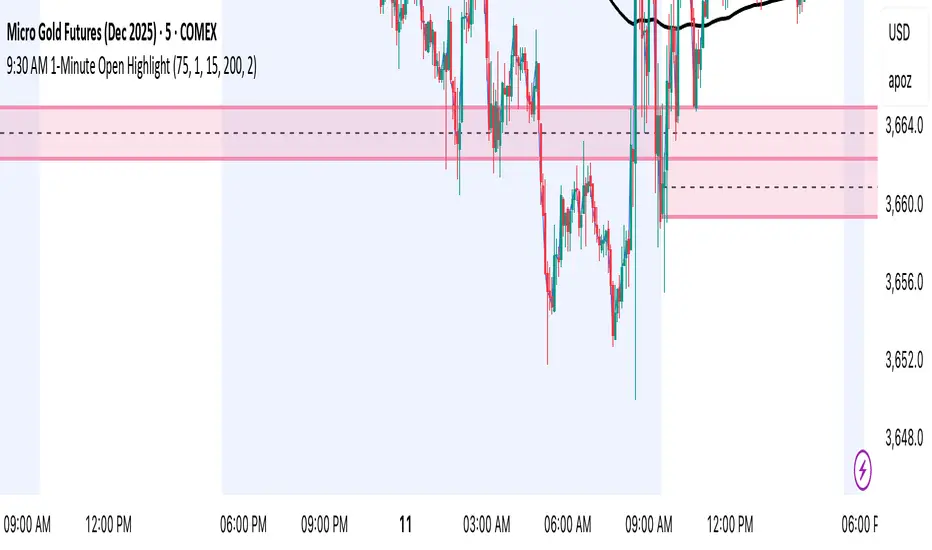
9:30 AM 1-Minute Open HighlightThis script highlights the 1st 1 min candle of the NY session (9:30 AM candle). This area can be used for retests, entries, targets, etc. I will continue making updates to this. This script allows you to highlight the shaded box to the color of your choosing, choose how many days the first 1 minute candle will be highlighted, as well as other customizable features. Please let me know if you have any suggestions. Thanks.
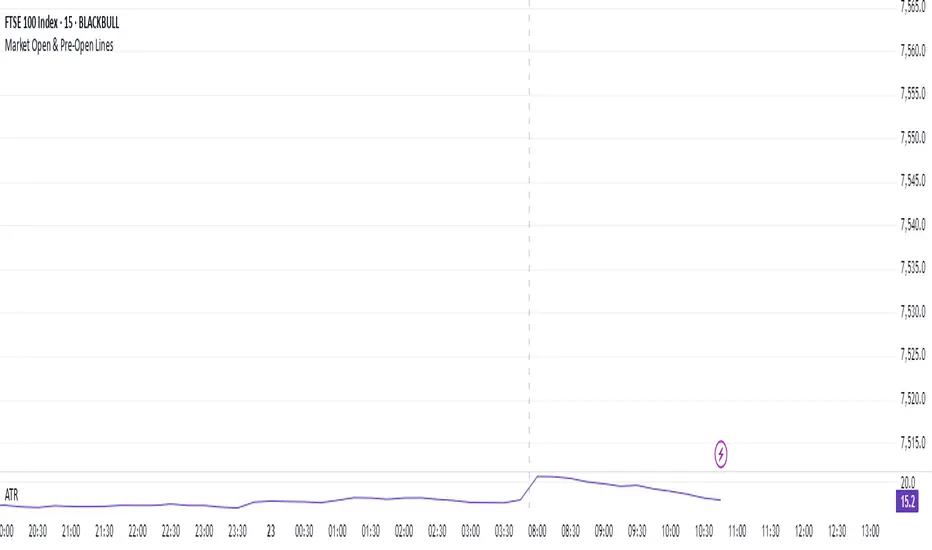
Market Open & Pre-Open Linesversion 1.0 2025-04-23
Stated vertical line for market open and pre-market open. Market option include US, EU, UK, JP and AU. This line do auto-defined during daylight saving time. This help for those trade during market open and benefit for those doing backtest on it.

Line StratThis indicator provides a comprehensive visualization of key price levels and trends.
It plots lines for the premarket high and low, prior day high and low, current day high and low, and the market open, each with corresponding labels displayed at the current bar for easy reference.
It features six customizable moving average (MA) lines, with options to switch between EMA, SMA, WMA, VWMA, and HMA.
The indicator also includes the Volume Weighted Average Price (VWAP), providing a dynamic benchmark for price activity throughout the session.
All lines and moving averages are clearly labeled at the current bar for enhanced clarity.

Daily Open [Kintsugi Trading]Daily Open
The "Daily Open" indicator by Kintsugi Trading is designed to give traders clear and immediate access to daily open prices, enhancing their ability to spot key market levels and make informed trading decisions. The indicator dynamically changes the color of the plotted line based on the current price's relationship to the opening price of the regular market session. This visual aid helps traders quickly assess whether the current price is trading above or below the opening price of the session.
Key Features:
Daily Open Visualization: Automatically plots the daily open price on your chart, providing a clear reference point for daily price action.
Configurable Market Open Time: The indicator allows users to input the start time of the regular market session (default is set to 9:30 AM).
Color-Coded: The indicator dynamically adjusts the color of the daily open line and price labels based on whether the price is above or below the open, giving you quick visual cues about market sentiment.
Customization Options: Users can modify the line's appearance, including the color and style, to better fit their chart preferences.
Ideal For:
This indicator is particularly useful for day traders and those looking to closely monitor price action in relation to the market's opening level. It serves as a quick reference point for identifying potential bullish or bearish sentiment throughout the trading day.
Good luck with your trading!

RD Opening Range/Initial BalanceIntroducing the RD Opening Range/Initial Balance indicator. The opening range is the first 60 minutes of trading action for a given day (High, Mid, and Low).
The market tends to put significance in these levels, that's why we use them in our trade system.
There is also a data panel:
Today - Today's opening range value
W-Avg - This weeks average
20D CA-OH - the total number of closes above the opening range over the last 20 days (above high)
20D CA-OL - the total number of closes below the opening range over the last 20 days (below low)
* We do plan to add additional data points.
* Only the last OR has labels, we will not be adding them or an option in the future.
* Full customization in setting panel. Color of lines, background, no display of data panel and more.
How to Use
These levels act as dual magnets. They both attract price and repel price.
You use price action and rules to decipher if price is being attracted or repelled.
You will notice as you use this indicator that price respects these levels. Often when answering the 3Qs one of these levels is in play.
During the cash market these levels play a significant role in price action. Even during the Globex/Overnight session these levels are a factor.
Circle areas are examples of price reactions at OR key levels:
If you trade with the RDTS you already know how to use these levels as reaction and target zones.
For clues on which level price is being repelled or attracted I'd suggest you utilize bias and momentum indicators like the RDA.
Initial Balance vs Opening Range
Before we move on and discuss how to use this indicator I want to mention what I consider the difference between the Opening Range and the Initial Balance.
I've adopted the Opening Range verbiage for the first 60 minutes of trading even though the Opening Range is often defined as the first 15m or first 30m.
The more accurate term for the first 60m should be Initial Balance. I'm not sure exactly where this originated but I learned this term when I was heavily trading TPO-- the IB is the first 2 30m blocks of trading.
Any questions or improvements just comment below.
This script was created in by both Bhangerang (an Alpha member of the RDTS) with help by @RexDogActual as well as permission to publish.

[FrizLabz]PB OLvlsDisplay Market Open and/or Premarket Open
Labels are offset to the right of Lines
You can adjust the number of opens back to display
If you want to change the format of the label please read the tool tip
Hope you enjoy
FrizLabz

SFL Session OpensThis is a simple script that allows you to show the start of a trading session with a vertical line and label.
Currently, 3 major sessions are supported (Tokyo, London and NY) and there is an option to define a custom session too.
Per session, you can configure the open hour and minute, whether you want to enable it and the color of the line/label.
Give it a thumbs up if you like it. Enjoy!
