Minervini Trend Template Screener [LevelUp]The Minervini Trend Template is a stock screener based on the work of Mark Minervini, a two-time winner of the U.S. Investing Championship. The goal is to identify stocks that are in strong uptrends.
Historical analysis demonstrates that nearly all of the highest performing stocks exhibited a strong uptrend prior to making significant advances. Based on Mark's research, 99% of these stocks were trading above their 200-day simple moving average, and 96% were above their 50-day simple moving average, prior to becoming true market leaders.
🔹 Minervini Trend Template Requirements
✓ Price is above the 150-SMA and 200-SMA.
✓ 150-SMA is above the 200-SMA.
✓ 200-SMA is trending up for at least one month.
✓ 50-SMA is above the 150-SMA and the 200-SMA.
✓ Price is above the 50-SMA.
✓ Price is within 25% of the 52-week high.
✓ Price is 30%+ above the 52-week low.
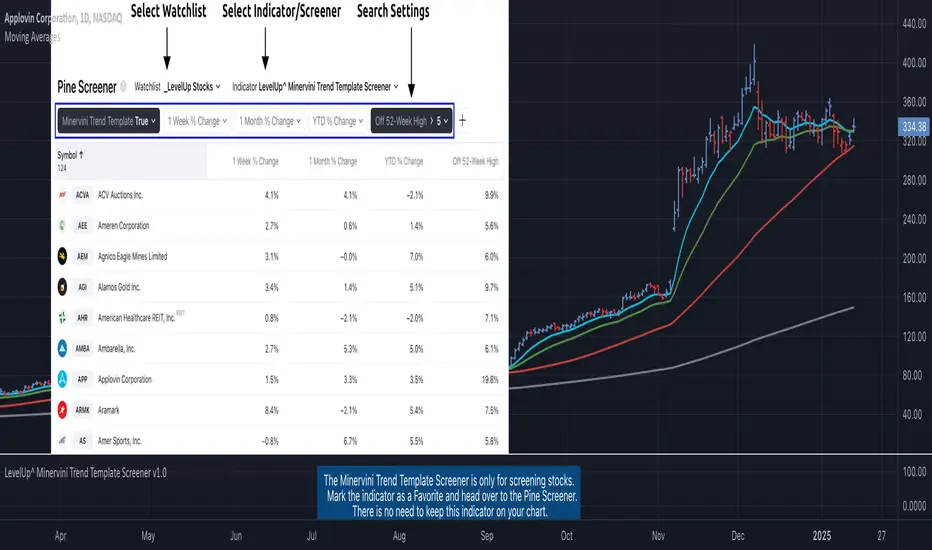
🔹 Screening Features - Setting Your Search Criteria
There are various search options that can be customized.
▪ Symbol Type
The screener supports all equity types from stocks to ETFs to crypto. You can narrow the scope of your search by choosing only the symbol types of interest.
▪ Percent Change - Weekly, Monthly and YTD
Further narrow your search by specifying minimum percent changes on a weekly, monthly and/or year-to-date basis.
▪ Distance From 52-Week High
The screener looks for stocks within 25% of their 52-week high, as defined by Mark's Trend Template. You can further tighten this criteria by specifying a smaller percentage, for example, search for stocks within 5% of their 52-week high.
🔹 Installation And Usage
▪ Mark this indicator as a Favorite.
▪ Use the Pine Screener to search for stocks.
▪ Save the search results to a watchlist.
▪ View the watchlist in TradingView.
🔹 Note
The Trend Template as originally defined by Mark included an RS Rating based on a proprietary calculation from Investor's Business Daily. My preference in technical analysis and screening is to only use tools and calculations that can be researched and verified. There is no RS Rating requirement in this screener. All the other Trend Template requirements are included.
Markminervini
[TTI] Minervini MonAlertHISTORY AND CREDITS–––––––––––––––––––––––––––––––––––––––––––––––––––––––
The inspiration for this script comes from the stealth platform functionality by Mark Minervini, that he calls MonAlert. The acronym for which comes from Monitor and Alert. The indicator has been developed for the traders, who would like to have "Minervini-like" eyes on technical setups for confirmation and violations. It paints on the chart the things that Mark looks for pre and post buy to confirm or violate the trade.
WHAT IT DOES––––––––––––––––––––––––––––––––––––––––––––––––––––––––––––––
The script provides visual and summarised view for technical confirmation and violations of the chart.
The main functionality comes in the form of a button called "Mon Alert". For quick comprehension, the label changes colors and can be 3 colors:
🟩. Green means that confirmations > violations
🟨 Yellow means that confirmations = violations
🟥 Red means that confirmations < violations
When you hover on top of the shape you get a quick report of the technical health of the chart:
👈 click to watch video
The report summarised over 42 different signals in ONE!!
20 violations, 19 confirmations and 3 warning signs
The signals group as follows:
👉 Rules 1-3 deal with the position of the price against the configured Moving averages
👉 Rules 4 & 5 deal with Volume calculations. In essence how does the volume on up days compare against volume on down days. Also how much was the breakout volume compared to the highest down volume.
👉 Rules 6-8 deal with price patterns. The indicator looks if the price pattern has printed 3 lower lows, the number of good vs ad closes as well as respect of the breakout day low
👉 Rules 9-11 deal with the Weekly and Daily patterns. In essence we look for consecutive up weeks, big down weeks on large volume
👉 Rules 12-13 deal with % advancements. There is a famous rule of William O'Neil about stock making 20% advancement. The script also looks for significant advancements like 3% declines or advancements
👉 Rule 14-15 deal with Distribution counts, Number of closes on high vs Number of closes on low as well as Angle D setup, a term coined by Mark of the price close vs 50D SMA.
Additionally, there is the functionality to plot these on the exact bar when they occur.
All signals use price action and volume action only to determine whether the action is confirming or violating. The rules also employ calculations around the moving averages to determine results. The indicator only takes into account price action from the date onwards only.
HOW TO USE IT–––––––––––––––––––––––––––––––––––––––––––––––––––––––––––––
The indicator is great for people who want to train their eyes on the confirmations and violations of a setup BEFORE or AFTER they make a position.
After you load the script you choose from when does the MonAlert start working, you do this by selecting vertical time line and after a few seconds of calculations the indicator appears with the report.
When the violations pile on (e.g. MonAlert button is red), this signals the trader that it is not favorable to stay in the stock anymore and hence close any long position.
On the contrary, when the MonAlert button is green, then the trader is advised to keep position.

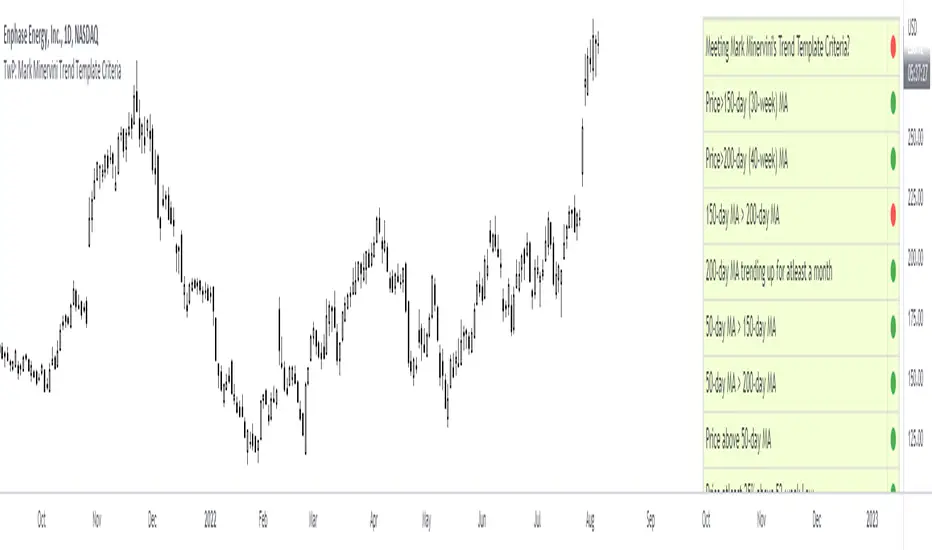
TwP: Mark Minervini Trend Template CriteriaIn his book ' Think & Trade Like a Champion ', Mark Minervini gave his famous Trend Template Criteria , that he uses for screening stocks. According to that, a stock must meet the following 8 criteria to be deemed in a confirmed Stage 2 uptrend:
1. The current stock price is above both the 150-day (30-week) and the 200-day (40-week) moving average price lines.
2. The 150-day moving average is above the 200-day moving average.
3. The 200-day moving average line is trending up for at least 1 month (preferably 4–5 months minimum in most cases).
4. The 50-day (10-week) moving average is above both the 150-day and 200-day moving averages.
5. The current stock price is trading above the 50-day moving average.
6. The current stock price is at least 25% above its 52-week low (30% as per his book 'Trade Like a Stock Market Wizard').
7. The current stock price is within at least 25% of its 52-week high (the closer to a new high the better).
8. The Relative Strength ranking (RS ranking), as reported in Investor’s Business Daily, is no less than 70.
This script checks if the above-mentioned Mark's Trend Template Criteria is being met or not (except for the last condition #8 ( RS ranking above 70), which cannot be obtained) .
Green dot indicates condition met, and Red dot indicates condition not met.
If you want to see only the final result, instead of the status of each condition, you can choose the option of hiding individual conditions from the Settings tab.
You can also change the color & location of the table in the Settings tab.
Using Bar Replay mode, you can also go back on any date historically to check if the said criteria were met on that particular date.
Unfortunately, at present, it is not possible to screen stocks on TradingView that meet Mark Minervini's Trend Template Criteria.
Feel free to use. Click on Add to favorite indicators below to start using the script.