MBY_Quant_HerculesHello.
This is MBY Lab.
We are very excited to deploy Hercules metrics.
Hercules strategy operates based on the Relative Strength Index , and displays the price when each Relative Strength Index maintains an upward trend or decreases.
When the stock price rises, the price at the time of entering the overbought or oversold section is displayed as the market price, or when the relative strength index falls when the stock price rises, it is captured and the market price is displayed.
Therefore, this indicator is a momentum indicator , and it can be said to be a non-trend following indicator.
The blue line that outputs as blue shows a graph of the asset change when buying or selling at the price pointed to by this indicator, including 0.2% slippage and 0.2% transaction fee.
Of course, this doesn't mean that this metric is always profitable.
This strategy was created to aid trading.
This indicator is a private indicator, please comment if you wish to use it.
**notice**
"Use the link(Invite only script Contact) below to obtain access to this indicator".
Mby_lab

Kimchi & Satoshi PremiumThis indicator show Kimchi & Satoshi Premium.
Kimchi Pr means that BTC/KRW price more expensive than BTC/USD price, so traders can use this, Arbitrage trading.
Satoshi Pr means that alt/BTC price, confirmed BTC /USD price calculate is more expensive than not calculate.
so Traders can use this arbitrage trading too.
-the color?
lime color = KRW > USD (Kimchi PR)
red color = KRW < USD (Reverse Kimchi PR)
Enjoy!

MBY_Apache_Quant Hi, This is Yong from MBY_Lab
This Indicator can affect your Trading Real.
Based on break Through / Out Trend. & 4Hour frame.
Can use Long / Short Position Both.
1. Total closed trade : 71
2. Trades % Profitable : 46.48%
3. Profit Factor : 1.959
*Slippage : 0.2%
*Trade fee : 0.2%
*Total fee : 0.4% each order in/out.

MBY_Jet Quant (alert)Hi this is Yong.
this indicator is convert version for using alert.
Now, you can set the alarm for trading.
this is not strategy code, study.
** Using Only Buy/Sell 1:1 trade.**

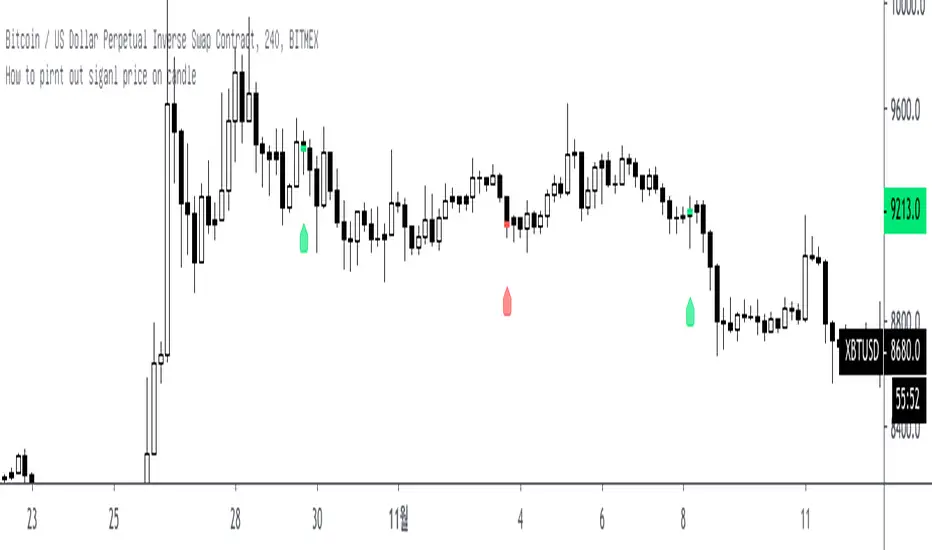
How to pirnt out siganl price on candleHi, this is Yong from Mby_lab
this codes explain how print out signal price on candles.
only working on 4H timeframe.
Core code based on 3H timeframe so This time close show on 4H, realtime close.
if 3H close fixed, then it will show on 4H line break style and this is not show twice on candle cause like this
When 3H closed / 4H = realtime
4H closed / 3H = realtime
then like this
3am close show 4am candle
6am close show next 4H candle for 8am~
..
.....
enjoy this!
this codes can help solve timeframe / security issues.
//
Find value When RSI oversold/boughtHi! this is Yong from MBY_LAB
this codes for help find value when RSI show oversold/bought.
*caution
the price (oversold/bought line) = hline
so if you change oversold/bought line, that will be change too.
they cannot set different number.
//
enjoy.!:)

Find overbought / oversold Value lineHI, this is Yong from MBY_LAB.
this codes can help you how save the Values when Crossover or Cross lines each difference lines.
first of all, this codes based on Relative Strength line (RSI).
when the RSI located 20 or 80 lines (it's means over sold/bought), it's show the price on your charts.
can everyone use this.
enjoy.
May the
Bit be with
You.
//
explanation ---
on chart = value when under 20 or over 80 RSI
under Oscillator = about "RSI" when under 20 or over 80 RSI

[MBY]Trend Trace (Background Color)this indicator based on trend line.
this show "D" frame trend.
can help your position.

Quant3_alarm_betaQuant 3 strategy cant include alerts so, i made it.
this Quat based on VAR, SMA logic.
helping trade your money.
enjoy.

MBY_Stochastic RSIthis indicator decrease the noise what standard Stoch RSI has.
so, this indicator more helpful your trading.
good signal : crossover k and b
bad signal : crossunder d and k

MBY_MovingAveragehi, this is Yong.
This Moving Average based on log & Square root.
This Moving Average more smooth the others.
Happy Trading.


MBY_CME_W_GAPhi this is yong.
this indicator show you Week frame CME Gap.
on BTC price trend follow CME's gap.
so, i published this.
this is not for sale.
can use everybody.
enjoy!:)
+ update soon as possible.

MBY_Suppoet&Resistance(Final_ver.2)Hi, this is Yong.
this indicator show Resistance & resistance line based on Moving average.
and version for private.
+
version up 1-> 2 inform : added over target.
all this resistance & support line changed based on realtime.
THX :)
if wanna using it, just contact me!

MBY_Support Your Trading(ver.1.0)Hi, This is Yong.
Exiting Published This indicator.
This indicator based on "candle patterns" .
If price ready to UP, "UP" mark on your chart / price ready to Down, "Down" mark on your chart.
The Lime color line means Switching Trend.
* This indicator DO NOT HAVE REPAINTING ISSUES.
THX:)
MBY_Support Your Trading(ver . trial)Hellow this is Mby.
this indicator can help you to trading alone.
this indicator based on ichimoku clouds and movingaverage and candelstick patterns + etc.,
and this version just for test how this signal can wroking on charts.
Trying this indicator will be close after 3weeks.
join it!!!
What means?
Background colors : blue = uptrend, black = down trend.
singnal good = price will be up.
bad = price will be down.

MBY_Support&ResistanceThis indicator based on SMA , EMA and other things.
Showing support & resistance line is so easy to use this indicator.
please, comment & click The good button.
---
update!!
Now user can set own sma/ema on Chart.
--
how to use?
just Click All price line for showing.

MBY_BTC_Long&ShortThis indicator based on 15Min Bitfinex BTC chart.
Can help you watching short/long position on your sheet.
이 인디케이터는 비트파이넥스 15분 봉 비트코인 차트가 기본이 됩니다.
수정하실 수 없습니다.
이 지표는 비트코인 롱/숏 포지션을 사용자의 차트에 표시해줍니다.
감사합니다.
사용을 희망하는 분은 관심과 좋아요 부탁드리겠습니다.
