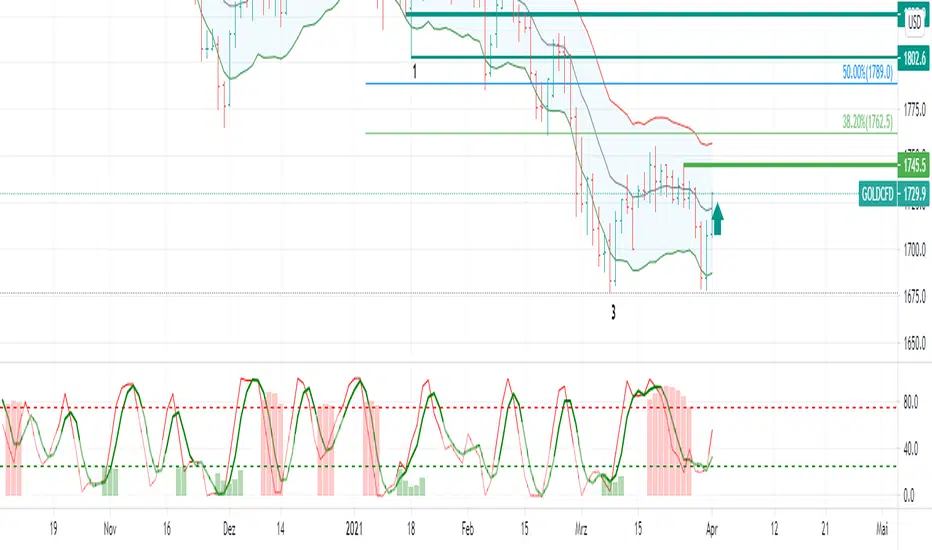
DT Dual-Lookback DLBThis script is based on the concept of Robert Miner Book "High Probabilities Strategies"
This script shows at the same time two timeframes and the overlapping area.
The green and red area shows the higher time frame period just as Robert Miner did this in his videos.
Because Robert Miner just says: 8.. 13.. 21.. i used this also as type for the setup.
This is not a complete trading strategy, but if fibonacci retracement/extensions in price and time and
elliot waves position and DT Dual-Lookback comed together there is a perhaps a signal.
Please read his book and look at his website and his DT reports to learn more about his strategy.
مؤشر الزخم
Structure AnalyzerA momentum indicator that uses the highest and lowest values for price in three different lookback lengths to find the performance relative to three timeframes.
- The yellow line is the product of the price performance in three different timeframes.
- The red line is 200 EMA of the performance.
- The blue columns represent the same calculation or the volume(OBV based).
- The aqua line is the 200 EMA of the volume performance.
How to use: Whenever the performance crosses above the 200 EMA, the price is in an uptrend.
Important: When in a downtrend, the performance will stay below the 200 EMA for a long time; hence it is important o wait until the crossover.

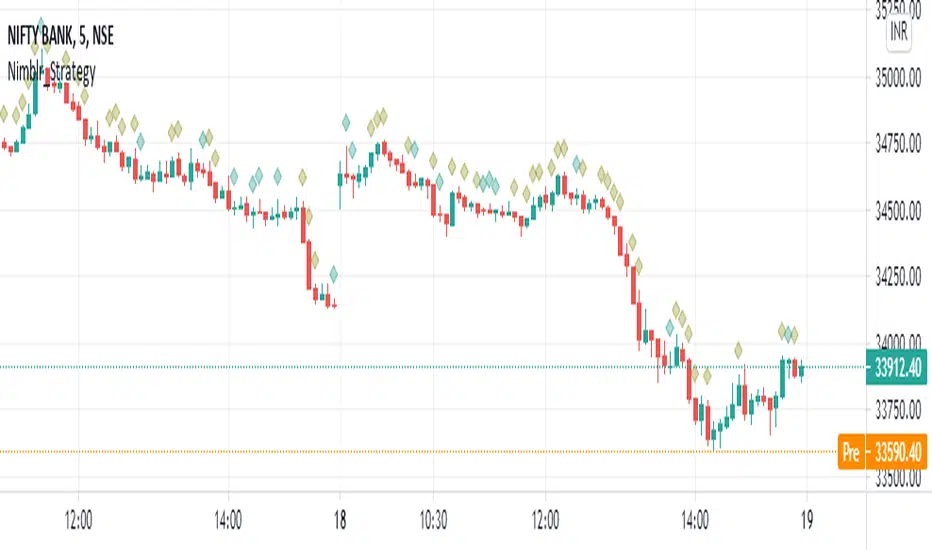
Nimblr Strategy- Momentum Candle IndicatorDescription:
Strategy uses the Nimblr advice.
It display the momentum candle with diamond on top of the candle.
Candle Height= High-Low
Body Height=Open- close
Criteria:
Candle height=100%
And body Height >50%
NSE:NIFTY
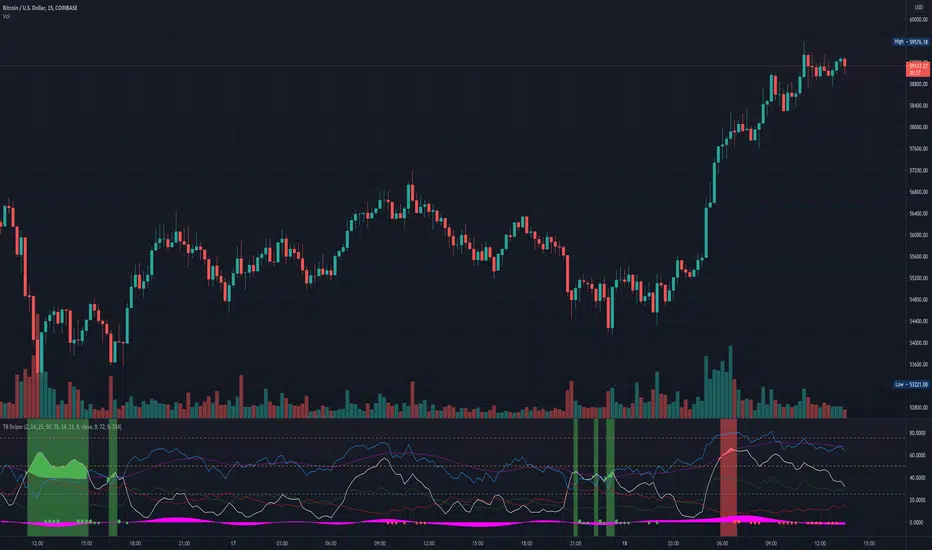
TB SniperWelcome everyone to your new base indicator, the TB Sniper.
Want to catch market tops and bottoms? You're in the right place!
Be ahead of of the game with the ability to catch market tops and bottoms.
This indicator combines a range of momentum and oscillation indicators to give you a decent chance of catching the highs and lows, relative to the timeframe it is used on. This information is critical in analysing where to buy and sell and to give you a view of the overall health of the pair you are trading.
In addition to finding the relative tops and bottoms, it also shows you the RSI, DMI and MACD histogram for further confluence in your decision making.
The indicator will flash a green background when it thinks it is close to a bottom or a red background when it thinks it is close to a top. Further indications are shown when the indicator thinks it is now a good time to buy (large green circle shown) or sell (large red circle shown). These large circles work very well when longing/shorting the market and when overall price action is in the direction of the signal. E.g. In an uptrend, a large green circle will indicate a good time to buy/long. In a downtrend, a red circle will indicate a good time to sell/short. The indicator will show auxiliary indications (small circles) when it thinks it would be a good time to take profit. A small green circle indicates a possible time to take profit after buying/longing, while a small red circle indicates a possible time to take profit after selling/shorting.
This script works very well on the 15 minute timeframe with the default settings on most symbols, especially cryptocurrency. Usually, the larger the timeframe, the bigger the move.
NeverBot Basic Momentum ShiftNeverBots Basic Momentum Shift Script
This script is a basic up/down indicator to tell you which way momentum has shifted, this should be used as part of another system to add confluence to your already existing long or short thesis. Uses a simple algebraic equation to define the momentum and when up or down has shifted above/below the other.
Combine this with an MA strategy to get entries for a good hit rate. Typically used for intraday but you can still use this as an indicator for higher time frames.
Crypto is very volatile and momentum can shift within a few minutes which is why you will see some failed signals, but typically it works very well for catching the big moves in crypto as momentum becomes very strong due to FOMO etc..

Genesis Matrix Momentum IndicatorThe Genesis Matrix (GMMI = Genesis Matrix Momentum Indicator) is primarily a momentum indicator that can be very well combined with other indicators to easily detect possible trend changes.
This is a translation/interpretation for TradingView from the original Metatrader 4 code which is Open-Source and was developed by "realjumper". More information here: www.forexfactory.com
The 5-15 Genesis Strategy and Genesis Summary PDF: www.forexfactory.com
EMA is configured as follows:
Length: 5
Source: hlc3
Offset: 2
Create a buy alert:
- Condition: GMMI and "All blue"
- Options: Once Per Bar
Create a sell alert:
- Condition: GMMI and "All red"
- Options: Once Per Bar
Version 3 changes:
- Bug fixes
- Fixed T3 signal (trend reversal instead of closing above/under trend)
- Input variables added (You could play around with periods of CCI and T3 by setting it to 12 for example.)
- Converted to PineScript v4
- Added alarm conditions
Happy Trading 📈😎
Important : We have neither invented this indicator nor added anything in the logic to it. This is just a script translation.
Note1 : TVI (first line) only works on a ticker with provided volume!
Note2 : The original system uses Heikin Ashi candles, but please be aware that this may alter the alertcondition and probably falsify the actual outcome.
Note3 : We do not recommend using a single indicator as a basis for your trading decisions.
To find out more about how to gain access to this indicator, please use the provided information below or just message me.


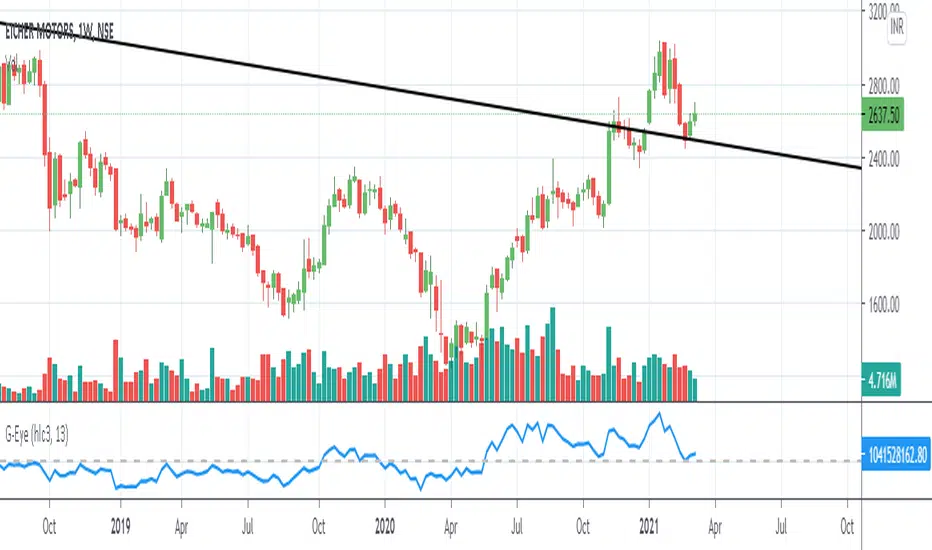
GOD's EYEWith the GOD's Eye, you can understand the money flow in the system/security
Know how biggies are following, and save from all your losses.
Works best in positional setup - Daily, Weekly and Monthly charts.
Super Momentum OscillatorA new momentum oscillator. I uploaded this previously but it got deleted I believe because apparently my chart was too cluttered.
Hopefully this is good enough... made some updates as well since then.
What you have is six (!) momentum oscillators that can be weighed together however you please. They are centered on 0 with a fill so its also easy to overlay them (as shown).
Since momentum oscillators vary heavily chart to chart, in terms of resolution, I added that as an option so you can keep the hlines as they are.
Can be useful for spotting higher time frame moves on lower time frames without any of the repaint or needing 6 chart screens. Also a solid improvement over the indicators where people just throw a dozen different length plots together and you have no idea where to look in the end. IMO, at least.
Mix and match high and low lengths however you please.
Also it looks wicked with rasta colors. SMOke (super momentum oscillator kills everything)... your way into financial freedom, mon!

MDX Free Version (MA)This is a free version of the MDX Crypto trading "bot". Note that this indicator and the MDX version are based on simple code available on trading view or via google search.
This indicator is using two exponential moving averages. One average is set over 21 bars (fast) and the other is set over 55 bars (slow). When the plots intersect it represents a change in momentum. MDX refers to this as a confirmation.
Also shown on the chart is the "Super Trend" indicator. This is the red and green line with inflection points highlighted by a red or green arrow. These points are changes in uptrends and downtrends. MDX refers to this as a "long buy" when green, and a "short sell" when red. Commonly these are buy/sell signals. When a buysignal (green arrow) occurs followed by a change in momentum toward a downtrend, MDX refers to this as a "confirmed buy". When a sell signal (red arrow) occurs followed by a change in momentum toward a downtrend, MDX refers to this as a "confirmed sell". This can been seen more clearly on the MDS Crypto Free Version (PA) indicator which is also available. This uses the same information as the MA indicator, but formatted for the candle chart.
Usage:
Caution this indicator is not reliable on its own, especially on low time scales. When looking back in time this indicator will almost always show a "confirmed buy" before a large increase in price, but on many occasions you can have a "confirmed buy" which is followed by a dump in price, that will not trigger sell signal in time.

Rainbow Trend IndicatorThis is an indicator based on the MA rainbow concept. It is possible to choose between 15 or 20 MA's and if all 15 MA's is picked, the calculation will be calculated on 15 MA's and if 20 is picked the calculation is calculated on 20 MA's. The indicator will then be a line which is assigned a value from the calculation based on the MA's. If the line is above the dashed zero line, meaning the line's last value is a positive value, the price is in a uptrend and if the line is below the dashed zero line, meaning the line's last value is a negative value, the price is in a downtrend.
In short
If the line is green, the price is in a uptrend. If the line is red, the price is in a downtrend.

Trading Signal LiteThis indicator gives signals to BUY/SELL and also calculates the SL and TP respecting a 1.5 RR. Please calculate your position size to proper manage the risk!

Momentum Indicator (Market Experts)Market Experts Momentum Indicator identifies when the price is moving upward or downward and how strongly. When the first version of the momentum indicator is a positive number, the price is above the price "n" periods ago. When it's a negative number, the price is below the price "n" periods ago.

Momentum Indicator avg short return minus avg long returnAverage daily return over the period 2-12 months ago minus the average daily return over the period 1-5 years ago
=> a higher return 2-12 months ago indicates a higher return in coming months according to research, because of the momentum risk factor premium
=> a higher return 1-5 years ago indicates a lower return in coming months according to research, because of the momentum risk factor premium

TMO with TTM SqueezeApplication of the TTM squeeze and the short-term momentum TTM Wave A in action. This is an example where the short-term wave will react faster than the TTM to give you a signal to start building your positions.
This indicator needs to be combined with "TTM Wave A" (add to existing pane).
The TTM Squeeze works like a better MACD. There is a zeroline and histogram bars above / below represent positive and negative momo. As the height of the bar decreases when above the zeroline, that is called decreasingly positive momo and as the height of the bar decreases when below the zeroline, that is called decreasingly negative momo. The dots on the TTM Squeeze: Red dots represent consolidation where Bollingers are inside the Keltner Channels and green dots represent a move out of consolidation or "squeeze fire". As price action comes out of consolidation there is a bigger move up/down depending on where momo is heading and where prices are (key support/resistance levels, fib areas). You want to use the TTM Squeeze and A wave TOGETHER - TTM Squeeze is your main momo and your A wave is a short-term momo wave that reacts faster and works as a leading gauge. You need to use them TOGETHER to gauge where price action may be heading. When the TTM Squeeze and A wave move lockstep together, let's say both are decreasingly positive, there is a good probability it continues to move in that direction to the next support levels. TWO bars on the TTM Squeeze of different heights is confirmation that in most cases means it will move in the direction of those bars. So if decreasingly positive, you'll see two darker bars. By the time you get your 2nd bar on the TTM Squeeze, it is often too late or you're losing profit. Way to counter that is after you get one darker bar in the opposite direction of current trend, use A wave to "predict" the next wave, the more A wave histogram bars going towards the other direction, the higher the certainty it will hit. Lastly, using these waves together works best when you look at it on MULTIPLE TIME FRAMES. (Credit for this details goes to Brady from Atlas).

TTM Wave AApplication of the TTM squeeze and the short-term momentum TTM Wave A in action. This is an example where the short-term wave will react faster than the TTM to give you a signal to start building your positions.
This indicator needs to be combined with "TMO with TTM Squeeze" (add to existing pane).
The TTM Squeeze works like a better MACD. There is a zeroline and histogram bars above / below represent positive and negative momo. As the height of the bar decreases when above the zeroline, that is called decreasingly positive momo and as the height of the bar decreases when below the zeroline, that is called decreasingly negative momo. The dots on the TTM Squeeze: Red dots represent consolidation where Bollingers are inside the Keltner Channels and green dots represent a move out of consolidation or "squeeze fire". As price action comes out of consolidation there is a bigger move up/down depending on where momo is heading and where prices are (key support/resistance levels, fib areas). You want to use the TTM Squeeze and A wave TOGETHER - TTM Squeeze is your main momo and your A wave is a short-term momo wave that reacts faster and works as a leading gauge. You need to use them TOGETHER to gauge where price action may be heading. When the TTM Squeeze and A wave move lockstep together, let's say both are decreasingly positive, there is a good probability it continues to move in that direction to the next support levels. TWO bars on the TTM Squeeze of different heights is confirmation that in most cases means it will move in the direction of those bars. So if decreasingly positive, you'll see two darker bars. By the time you get your 2nd bar on the TTM Squeeze, it is often too late or you're losing profit. Way to counter that is after you get one darker bar in the opposite direction of current trend, use A wave to "predict" the next wave, the more A wave histogram bars going towards the other direction, the higher the certainty it will hit. Lastly, using these waves together works best when you look at it on MULTIPLE TIME FRAMES. (Credit for this details goes to Brady from Atlas).

Effective Divergence Indicator
What is EffDI?
Effective Divergence Indicator(EffDI) is a modified Momentum indicator designed to detect divergences in stocks, futures, forex, and crypto, just to name a few.
How does it work?
It uses the EMA of daily velocity.
Isn't this the same as Momentum
No. Momentum compares the price x days ago, while this takes the EMA of the daily velocity.
Why is it better than momentum in detecting divergence?
Because it uses an EMA, an EMA gives weight to the latest prices. I don't know how to explain the logic behind this, but it works :)
ok,ok, I get it, but how do I use it to buy, sell, and get a ton of profits?
Refer to the diagram below.
Steps:
Step 1: Locate the divergence(marked A,B,C and D): no divergence, no trade.
Step 2: Locate the last EffDI high. Mark that E.
Step 3(entry): Buy when price goes above E. For shorts, Short Sell when price goes below E.
Step 4(exit): Exit position when another divergence is detected,
OR
When A new Lower Low is formed.
As you can see, if you follow the steps, there is a good chance the profits will come to you. Cheers!
DO YOU WANT MORE GOOD INDICATORS LIKE THESE TO IMPROVE YOUR TRADING? Then, make sure to follow @Trader_ph (or i will eat all of your cookies)
Feel free to use my code below, BUT make sure to credit me if you make any modifications. :)

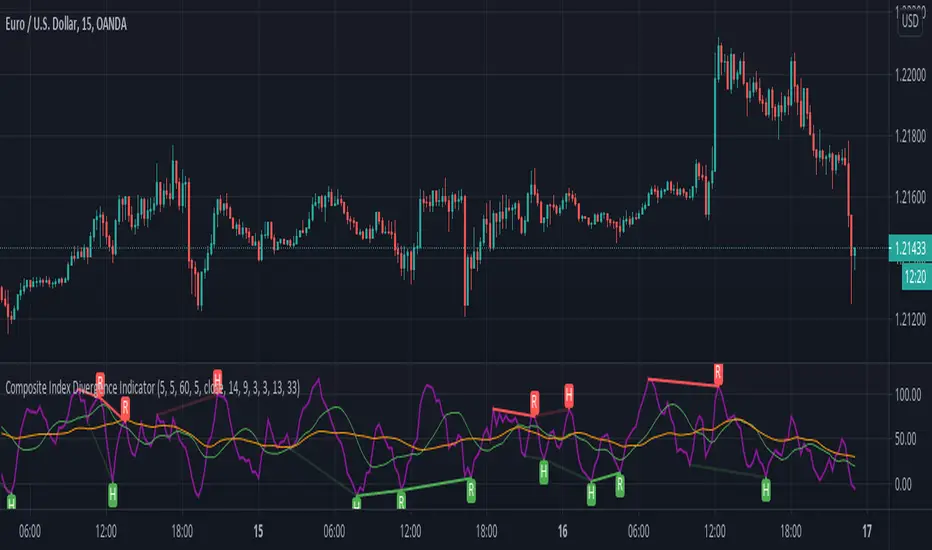
Composite Index Divergence IndicatorComposite Index by Constance Brown mixed with built-ins Divergence Indicator
useful indicator to find divergence
this script find divergence automatically for you
Cycle Swing MomentumAdaptive Ultra-Smooth Momentum indicator
The Cycle-Swing-Indicator "CSI" provides an optimized "momentum" oscillator based on the current dominant cycle by looking at the swing of the dominant cycle instead of the raw source momentum. Offering the following improvements:
Smoothness
Zero delay
Sharpness at turning points
Robust and adaptable to market conditions
Accurate deviation detection
The following common problems with standard indicators are solved by this indicator:
First, normal indicators introduce a lot of false signals due to their noisy signal line. Second, to compensate for the noise, one would normally try to add some smoothing. But this only results in adding more delay to the indicator, which makes it almost useless. Third, standard indicators require a length adjustment to derive reliable signals. However, you never know how to set the right length.
All three problems described above are solved by the developed adaptive cyclic algorithm.
The above chart shows current Bitcoin 4h data from the last days as of writing with the proposed signal reading for this indicator. The standard momentum indicator is included for comparison.
HOW TO USE
The indicator works without any parameter and can be applied to any chart and any time-frame. It will adapt automatically to the Dominant Cycle and use the dominant cycle of the source data to derive the ultra smooth momentum curve. Adaptive upper/lower bands are included and highlight areas with extreme readings. Automatic divergence detection can be turned off/on.
HOW TO READ
The indicator can be used like any oscillator. In addition, it provides adaptive high and low bands.
* Look for turns above the upper/lower bands
* Look for divergences between source and signals line
Further reading/Original source:
The indicator uses the dominant cycle to optimize signal, smoothing and cyclic memory. To get more in-depth information on the Cycle Swing Indicator, please read Chapter 10 "Cycle Swing Indicator: Trading the swing of the dominant cycle" of the book "Decoding the Hidden Market Rhythm, Part 1" available at your favorite book store.
Related ideas:
Please also check the cyclic RSI indicator which also uses cyclic information to improve the signal.

Cyber Momentum V2This Oscillator is another version of my previous Oscillator Cyber Momentum … in this version the CCI formula added to the core calculation therefore there is small differential behavior rather than Cyber Momentum because of different calculation methods …
But both of them are in the same concept; the most optimized signals are those that are in confluence of Cyber Momentum and Cyber Momentum V2 ...

Bjorgum RSIRSI output signals are displayed with color change to reflect the plotted value. This makes evaluating RSI conditions require but a glance.
RSI momentum buy signals are given on the cross of the 50 level, whereas sell signals are given on a fall below.
Default values a 5 period RSI which gives more timely entrances and exits for swing traders. This can be adjusted to the typical 14 period if the viewer desires slower signals.
Bullish and bearish area is shaded to accentuate the signal to the eye.
Excellent results can be found when coupling BJ RSI, with BJ TSI, and the reversal system using all 3 as a complete together simultaneously
Default color changes are plotted as a recorded value falls within the following levels:
RSI < 30 = green
RSI 30-50 = red
RSI 50-70 = blue
RSI 70-80 = yellow
RSI 80-90 = orange
RSI 90-100 = white hot

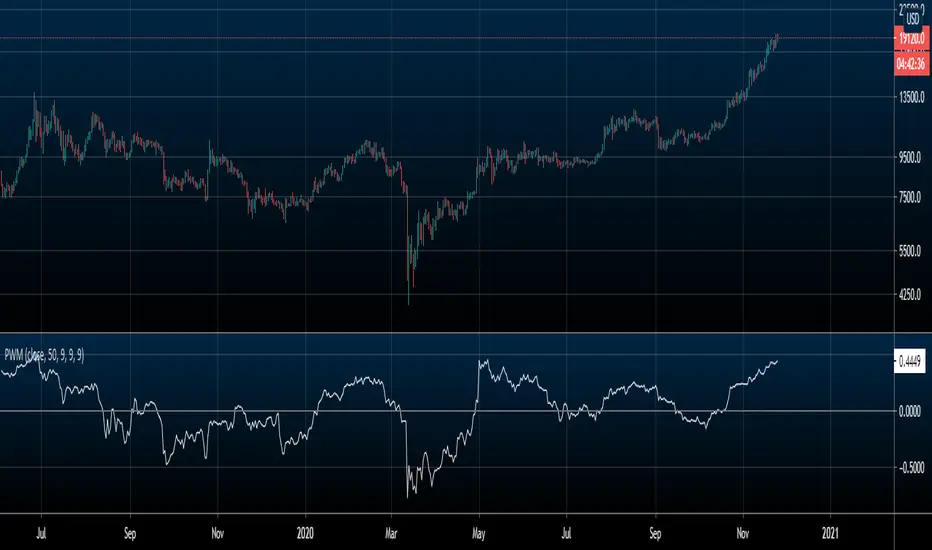
Price Weighted MomentumThis indicator is a momentum indicator that is standardized by price. A.K.A (momentum / price)
The purpose of this indicator is to compare momentum between different assets regardless of price.
EX: Bitcoin will always have more momentum than XLE because it's price is $19000 (as of writing this) compared to XLE's price of $40 (as of writing this). But if you divide the momentum by price, you get a standardized value to better compare the 2.
This indicator can be used to compare everything on TradingView.
HOW TO USE/INTERPRET
Positive values denote an uptrend
Negative values denote a downtrend
A value of 0 (or very very close to 0) denotes sideways price action
WHAT'S INCLUDED
Price Weighted Momentum (Unsmoothed by default)
Optional smoothing with either a simple or exponential moving average
Side note: I only added functionality of smoothing for EMA and SMA for my personal uses, but if you want a version of this with another way of smoothing (e.g. HMA, SSMA, etc.) that you would like, the cost of me adding that for you is a follow on Twitter. Just DM me there :)
Bjorgum TSI Arrows
This script is intended to help the viewer identify potential turning points with momentum "headwinds" or "tailwinds" with a visual que at the bar level. The presence of arrows indicates that the TSI indicator is either "curling" up under the signal line, or "curling" down over the signal line. This can help to anticipate reversals, or moves in favor of trend direction.
Multiple script overlays can be used for "Multi-timeframe analysis" by altering the "resolution" feature.
eg: Viewer could enable 2 "Arrow" scripts while watching the daily timeframe, and setting one of them to indicate weekly conditions. This can help identify prevailing trend strength when using smaller timeframes.
