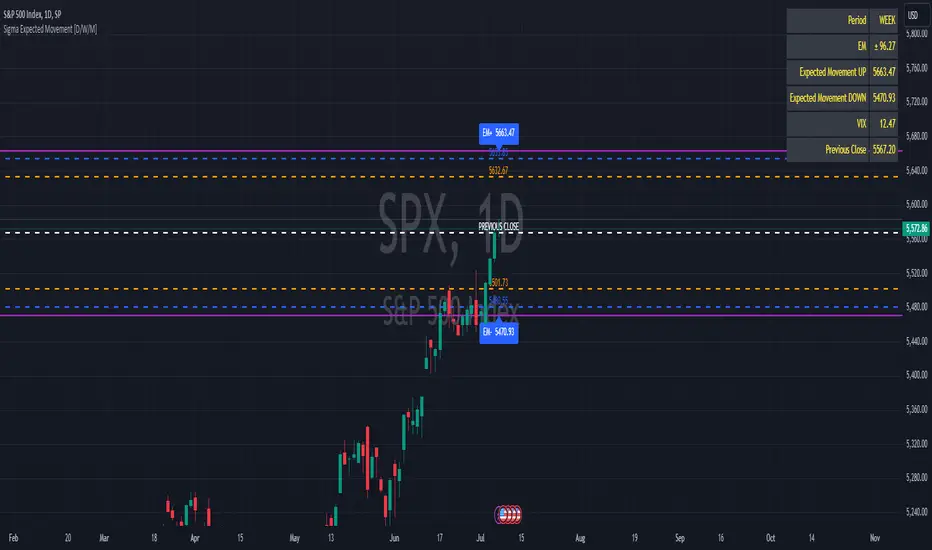
Sigma Expected Movement [D/W/M]Based on the VIX, this indicator shows the expected movement of a stock, ETF or index. 
This indicator has two standard deviations that you can set for better guidance.
You can also adjust it for a result in one day, one week or one month.
 Settings 
* Period  
* 1st Deviation: Default 68%
* 2nd Deviation: Default 90%
*Round To Integer: If it checked, it will search for the nearest integer (+/-). Optimal for people who do Options.
*Table Position: refers to which corner you want to put the table with information.
Movements
RSI Moving Average CrossoversThis script is an improved version of the RSI indicator, using a moving average on the RSI itself, as well as two other moving averages used to determine the current trend.
A small screener indicating the current movement is displayed in the bottom-left zone of the chart: trend (Bullish/Bearish/Uncertain) and status (Impulse or Correction)
Trends are simply based on moving averages crossovers, coupled to the fact that the current candle closes above the fast MA in a bull trend, and under the fast MA in a bear trend. In other cases, the trend and the movement are considered as "Uncertain" by the indicator.
 Options 
 
  Various types of moving averages for the RSI and trend MA
  Show/Hide crossovers between the RSI and its MA
  Color the RSI normal zone with the current trend/movement colors
  Show/Hide the screener indicating the current movement
 
 Defaults Parameters 
 
  Fast MA 20
  Slow MA 50
  MA source: Close
  RSI Length 14
  RSI MA: SMMA (RMA)
  RSI MA Length: 20
 
Don't hesitate to suggest any idea which could improve this indicator.

