[CP]3 RSI Multi Timeframe InceptionTriple RSI indicator where you can set the timeframe for each RSI.
Take confirmation from different timeframes to make high probability trades!
Typical settings would be,
1 Day, 1 Week, 1 Month or
1 hr, 4hr, 1 Day or
3 min, 15 min, 1 hr or.........your imagination is the only limit here!
Multi-timeframe

Efficient Support & Resistance LevelsThis script is a mixture of my two previous scripts "True Strong Classical Support/Resistance Levels" and "Hidden Supports & Resistances + Round Levels". This combination brings on better identification of the most efficient support/resistance levels.
Note that "Hidden SnR Levels" part of the code is only expected to work on Forex charts, but apart from that, the other parts could be applied to any chart.
The script may:
- Draw classical support/resistance levels which retraced the price previously, aided by multi-timeframe analysis
- Draw hidden support/resistance levels based on psychological patterns of the price
- Adjust to wicks better than Pine Script built-in pivot functions
- Differ the levels color based on chart reactions
- Merge nearby classical levels to avoid congestion on the chart
Feel free to use it and send me your thoughts.

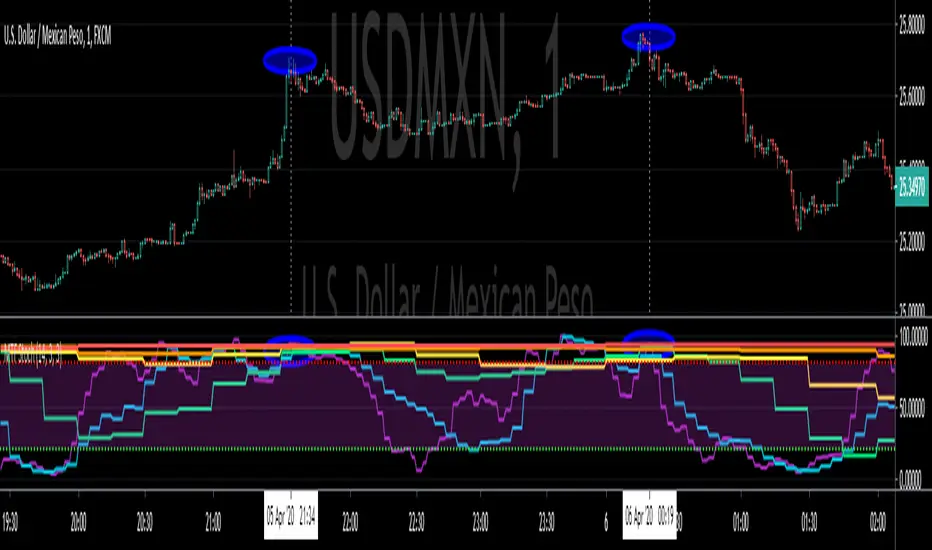
Hybrid Overbought/Oversold Detector + Put/Call SignalsThere are many indicators of overbought/oversold conditions out there. Some of more common ones are:
- Bollinger Bands %B
- Money Flow Index (MFI)
- Relative Strength Index (RSI)
- Stochastic
This script uses a combination of these 4 oscillators to confirm overbought/oversold and filter the signals of market reverse which could be used for trading binary options.
You may select which oscillators you want to apply and of course change the source, the length of the calculations and the overbought/oversold levels.
Also the script will draw a combined graph which is the average of the selected oscillators in the options.
Send me your ideas!

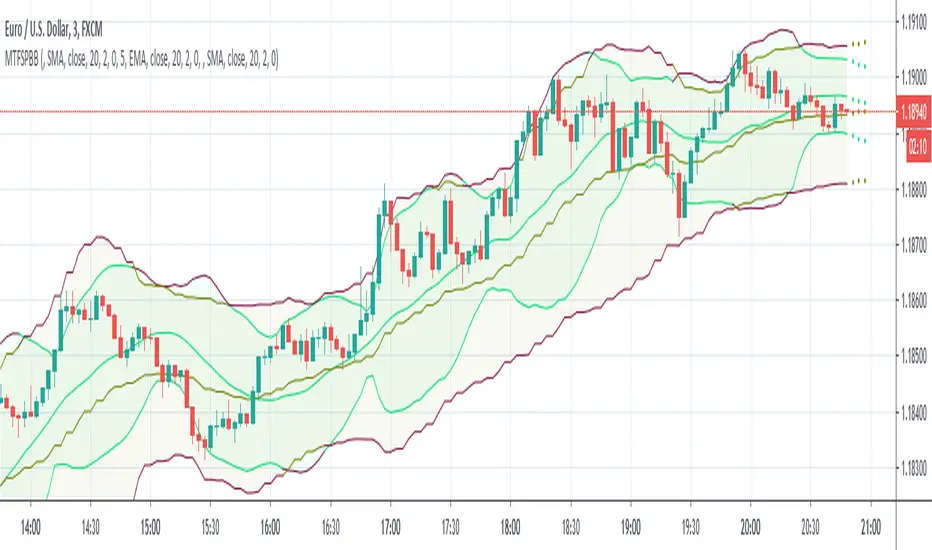
MultiTimeFrame Shifting Predictive Bollinger BandsThis is the optimized version of my MTFSBB indicator with capability of possible bands prediction in case of negative shifting (to the left).
Make me happy by using it and sending me your ideas about the prediction.
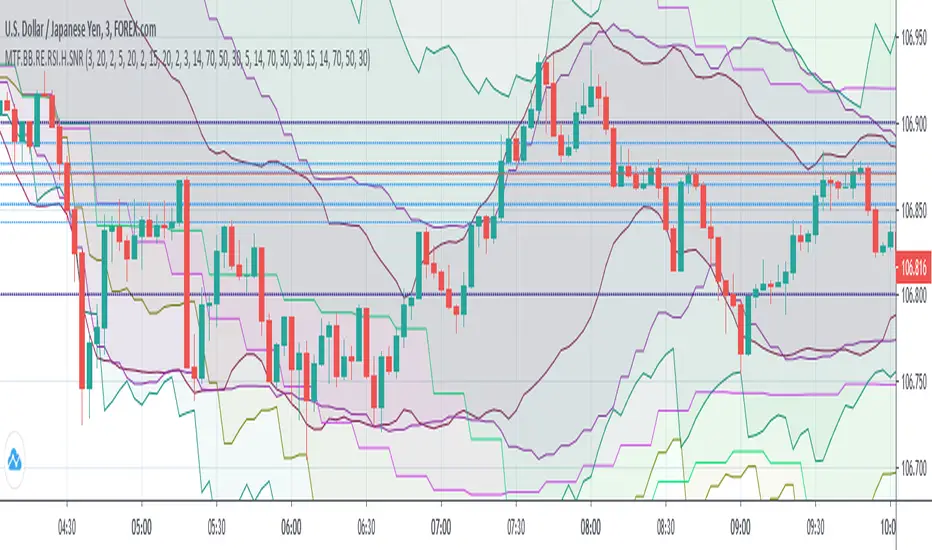
(MTF) Bollinger Bands + RE RSIs + Hidden Supports & ResistancesI merged some of my previous written indicators, because a combination of multi-timeframe Bollinger Bands, RE RSI and Resistance/Support levels could help a lot.
Don't forget to add my other useful indicator (Classical SnR) to the chart to maximize your profit!
Volume Multi Time FrameHi All,
This script shows total volume info of Higher Time Frame. it checks open/close prices of higher time frame and sets the color. it also show a dynamic line on last volume , so you can see when HTF candle started and ended. by looking at the color of volume columns you can see HTF candle is green or red. it's something like weis wave volume that is using HTF candles.
Higher time frame is set automatically, you can set it manually by choosing "User-defined" in the indicator options and choose higher time frame as you want
Here some examples:
Current time freame is 1min and htf is 1hour
Current time freame is 1min and htf is 1day
Enjoy!

Combination Parabolic MA/IIR/ALMA Strategy, with other goodiesOkay, so this is a lot. It started mostly with me combining indicators and looking for ideal entry criteria.
It is also a collection of conditions, whether used or unused, for my current chosen "best" strategy. It is currently set how I like it, but it has changed with time, and will continue to do so. Within, there are variables that are unused, but offer some insight into the overall odds of a trade. They were, in fact, once used but fell out of favor. And all details for this strategy are within the comment header of the script.
As this evolves, I most certainly wont keep any future findings and hope for profit from my peers (yinz). Also, I'd like to give a sincere thanks to the people of TV for what I learned in a few month's time and their flexible membership plans. Basically, I'm just a mad scientist, but this monster's a masterpiece and folks here before me made many indirect contributions to it.
--------------------------
Okay guys, lastly and most importantly,
Each smack of the like button is a vote of your confidence in me, to my beautiful landladies, Celeste and Adele, that my rent will be caught up and that it won't always be a problem. Which, in my mind, makes me a graph. And they've got strong hands and don't sell the low. I more than respect that. Seriously. And I'm very grateful for their willingness to work with me, but the thing is that I didn't ask first; life just happens. But few are tolerant of others. And quite importantly, I truly believe that I will be successful one day, and that "thumbs-up" button is your vote of confidence. If you're not sure, then don't hit it yet. Maybe my scripts will boost your confidence in me :)
-------------------------
PS: And you know what? I'ma give a shout-out to Philakone for teaching me everything that I know about Elliot Wave . Absolutely. Two years ago, I would keep telling myself that one day I will put something in his gratuity wallet or pursue the paid courses. And, I still plan on it, because I'm grateful. And so also, to everybody else, I'm recommending him to learn from. because as a trader who might not know everything for free, you can certainly fill in the gaps with his altruistic offerings. And I'm betting that you will then feel more than inclined to buy the Udemy course.
"If wave 2 retraces a lot; number 4 will not". Repetition. Philakone didn't fix my memory but he sure did find a workaround, haha
Okay, everyone, Thanks!

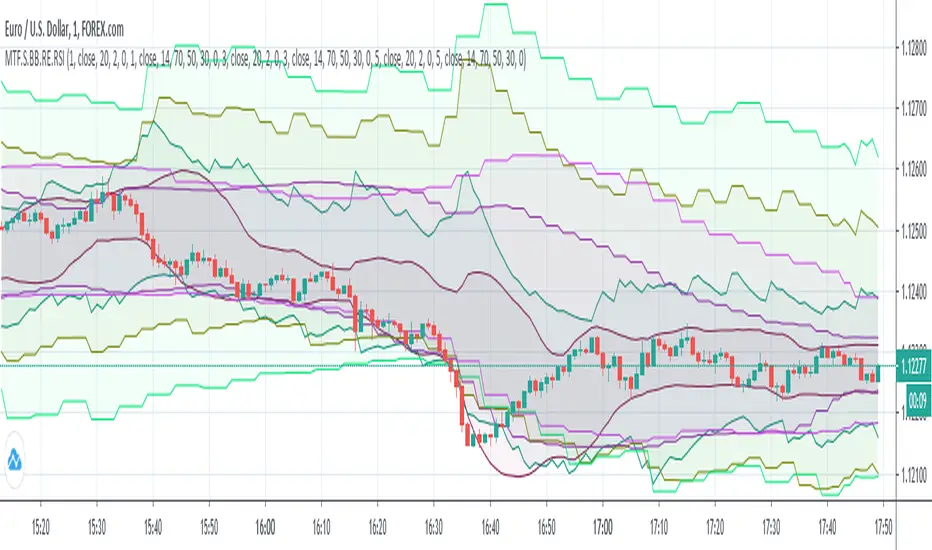
MTF Shifting BBs + Reverse Engineering RSIs Overlay on ChartAnother multi-timeframe indicator presents 3 MTF (each) Bollinger Bands and 3 MTF (each) Reverse Engineering RSI and of course with shifting (left/right) capability.
RERSI in a simple term is the RSI but on the main chart alongside with candles.
There are many adjustable options like:
- Show/Hide each BB
- Show/Hide each MA
- Non-integer BB deviation values
- Positive/Negative shifting values
- Show/Hide each RSI
- Show/Hide each RSI Mid Level
- Adjustable Overbought, Oversold and Mid Levels values
I wrote this after my first script MTFSBB, because it's very useful to have BBs and RSIs together on a chart.
Calculating RERSIs will take some time, so be patient with it and feel free to use it.
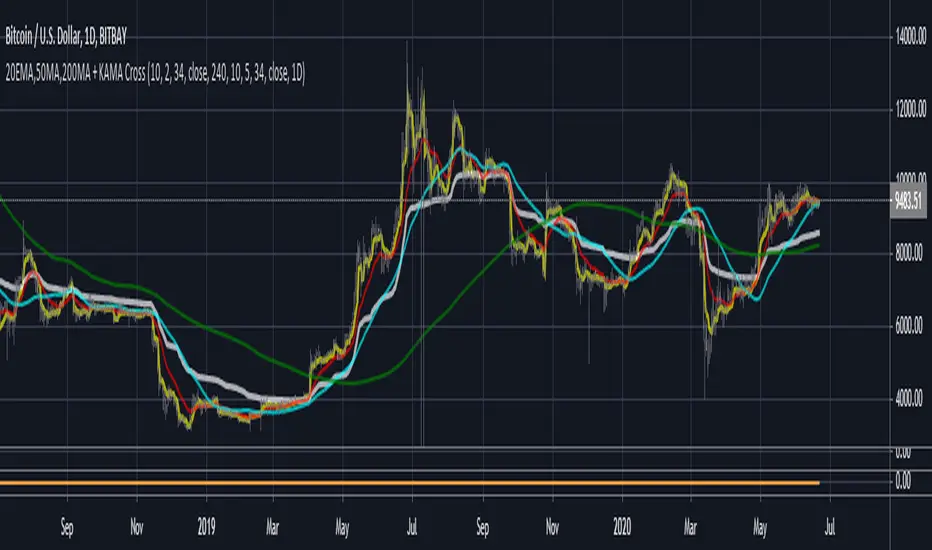
3MA'S + KAMA Trend (20EMA,50MA,200MA + KAMA Trend)This indicator, combines the traditional FOREX moving averages (20EMA, 50ma, 200ma) into a single indicator with
an adaptive moving average (AMA) taken from a user defined timeframe to show trend direction (by default, it plots
the daily 10/2/34 KAMA overlayed on any timeframe chart.
An AMA moves slowly when markets are sideways but swiftly during periods of volatility as a result it reacts much fast than
traditional options for moving average trends.
If the price is above the KAMA, trend is up. Below the KAMA, trend is down.
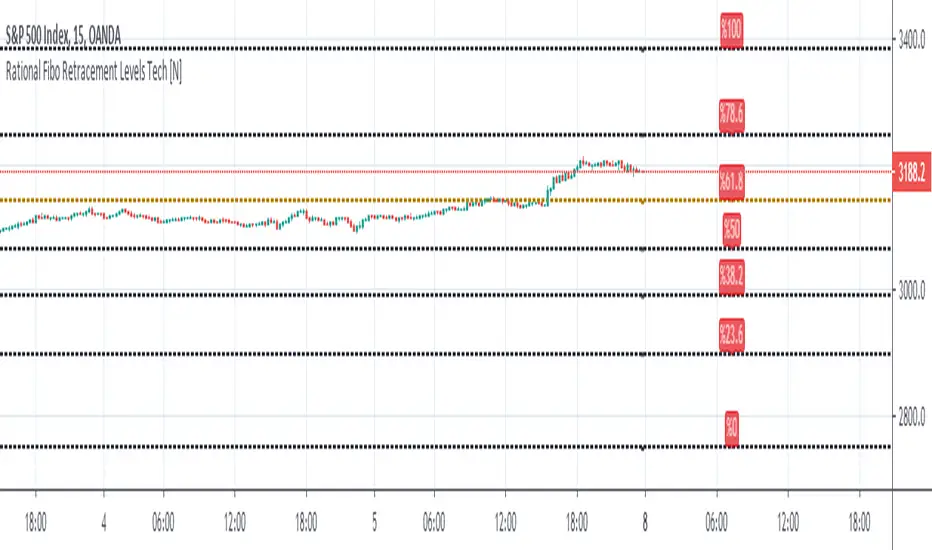
Rational MTF Auto - Fibonacci Retracement Levels Hello, this script automatically draws rational Support - Resistance Levels as multi time frame. (MTF)
In this way, we see reasonable levels ahead of us.
As of the date of birth: The first year after Lehmann Brother's fall was determined after January 1, 2009.
One feature of this script (which I deliberately left this way) :
If the security and support-resistance levels are equal, it will show you NA value and say wait.
Because it is based on a weekly basis for region selection, I think that it should enter a region and support-resistance levels should be drawn accordingly.
That's why I left it this way.
NOTE :
This script was inspired by the following publication :
Regards.
MultiTimeFrame Shifting Bollinger BandsJust 3 Bollinger Bands with different adjustable timeframes plus shifting (left/right) capability and non-integer deviation values.
I wrote this because I couldn't find the perfect BB indicator that matches my needs. Feel free to use it.

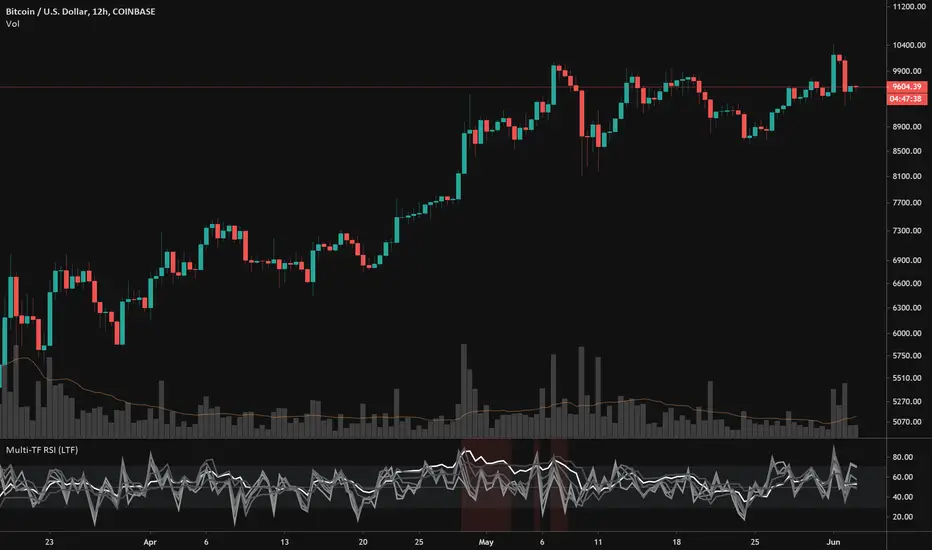
Multi Timeframe RSI - Low Time FrameThis is a follow on to my Multi-Timeframe RSI indicator . In that indicator, you could keep an eye on RSI values above your current time frame. This one allows you to look at RSI levels below your current timeframe. The idea behind this one is you may want to "buy the dip," so you can look for oversold conditions on lower time frames expecting a bounce to occur.
There is one issue with this indicator is that it takes awhile to load. Seems to be pretty resource intensive, so I tend not do use it. It will get annoying if toggling fast between tickers due to the speed in which it loads.
EMA 20/100/200 alwaysThis script will always show the EMA 20/100/200 daily values across any time frame chart (e.g. showing daily 20 EMA while viewing the 5 minute chart)

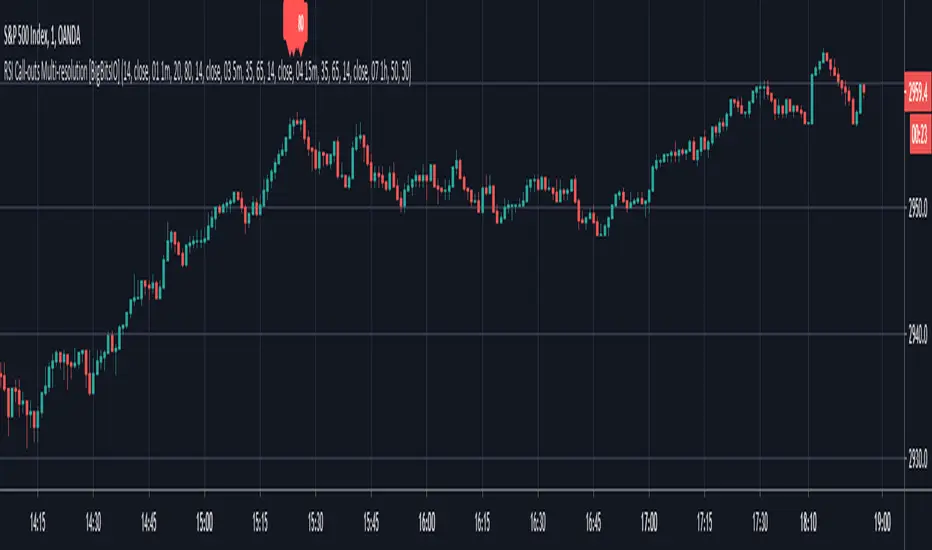
RSI Call-outs Multi-resolution [BigBitsIO]This is a simple multi-resolution (multi-timeframe) RSI indicator that overlays the current chart to show labels for specified oversold and overbought areas defined with inputs.
Up to 4 different resolutions/timeframes for their respective RSI (1,2,3, or 4). RSI1 is always enabled and can not be disabled.
Red labels with white text represent overbought RSI levels as defined by the user. All enabled RSI will have to qualify as overbought based on settings.
Green labels with black test represent oversold RSI levels as defined by the user. All enabled RSI will have to qualify as oversold based on settings.
This RSI overlay help easily call-out overbought and oversold candles on a chart where other RSI values on larger resolutions/timeframes are also oversold/overbought without sacrificing screen space for a traditional RSI indicator that is not overlayed on the chart.
This indicator has alert conditions that will trigger when all enabled RSI indicators are either oversold or overbought respective to your settings.
Note: The best results are to operate your chart as your smallest RSI resolution selected. Personally, I prefer to have my smallest (shortest timeframe) in RSI1, and go larger farther out to RSI4.

[PX] MTF RSIHello guys,
this indicator uses the RSI on three different timeframes, which can be selected in the user input settings. It aims to make your multi-timeframe analysis a bit easier and see patterns, which otherwise might not be spotted. Look for confluence within all the timeframes to increase your probabilities.
Because it uses multi-timeframe data, which can repaint, it comes with an optional checkbox to allow repainting or avoid it.
Happy trading and stay healthy :)

Support and Resistance Multi Time frameSimple indicator showing the support and resistance on Daily, Weekly and Monthly time frames no matter what time frame you're currently on by highlighting the highest and lowest points on each over the last 34 bars.
Daily support and resistance are coloured green.
support and resistance are coloured yellow.
Monthly support and resistance are coloured red.
For best results check where multiple support and resistance areas line up and combine with another indicator for example oscillators to gauge if the support or resistance will reverse the market.

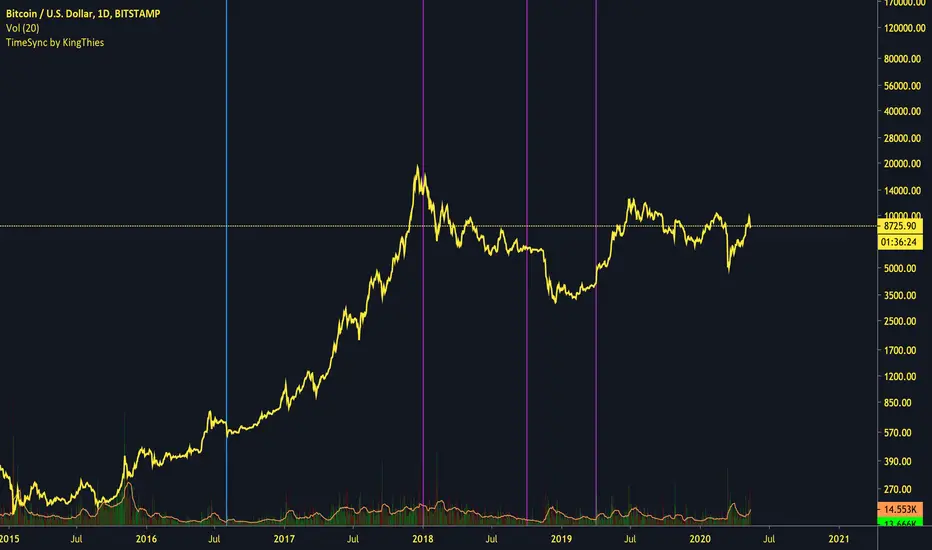
TimeSync by KingThies TimeSync by Kingthies
Written in Pine v4
Applies one function that was published in the Tradingview Pinescript Manual
The Motivation behind this script - Time is 50% of your chart. Many ignore it entirely. This should help give an idea on how to read it and incorporate it in their analysis.
TimeSync by KingThies takes a simple concept and turns it into a visual tracking system of when timeframes of significant impact, all close at the same time.
By utilizing several high time-frames, we see overlaps in periods and more significant events occurring when multiple periods close at once.
The TFs included are 3D,1W,2W and 1M. When users use the timeframes above intraday, the resolution for these HTF's is shown. When using the LTFs, anything lower than 1D/is intraday, the user sees a similar concept but comprised of the 4H, 6H,8H and 10H charts.
Users can adjust the settings to show the HTFs in sync AND also factor in if the event was on a business quarter or new year, which adds more significance to the occurrence.
By seeing when these periods end in sync, we can assume more volatility is present in a given market, presenting various opportunities for traders to take advantage of a given situation.
Apologies in advance for any questions that come up - I will do my best to reply or respond here on Tradingview.com.
Additional Resources for this topic can be found in my account signature, located at the bottom of this post.
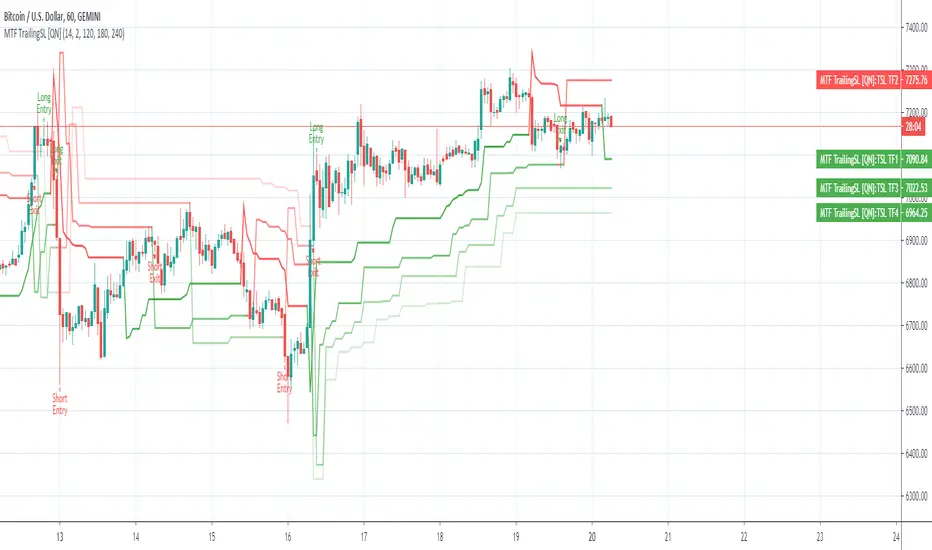
MTF Trailing SL Alerts [QuantNomad]These are alerts for my MTF Trailing SL Strategy.
Entry Long position if all 4 time-frames agree on the long signal.
Exit Long positions when at least 2 time-frames disagree on the long signals.
Entry to Short position if all 4 time-frames agree on Short signal.
Exit from Short positions when at least 2 time-frames disagree on Short signal.
Use "Once Per Bar Close" when creating alerts.
Link to the strategy:
Multi Time Frame StochasticThis Indicator draws 6 Stochastic Plots with different Time Frames showing only K Value.
Available Time Frames: 3m, 5m, 15m, 30m, 60m, 240m
Briz HA MTF - A Heikin-Ashi Multi-Timeframe Indicator Ever wanted to know what Heikin-Ashi candles are showing for multiple time frames at a glance? Adjustable time frame for each row. Arrows show when each column is either all green (white up arrow) or all red (yellow down arrow).

MTF Ichimoku CloudIchimoku Cloud , Multiple Time Frames, based on the script : MTF Selection Framework functions (PineCoders)
Possible display:
- four differents Ichimoku
- Tenkan, Kijun, Chikou and Kumo (monochrome or not)
- labels : offset from line, color if you change style and with/without abbreviation
Time Frames :
- 1m
- 3m
- 5m
- 15m
- 30m
- 45m
- 1h
- 2h
- 3h
- 4h
- Daily
- Weekly
- Monthly

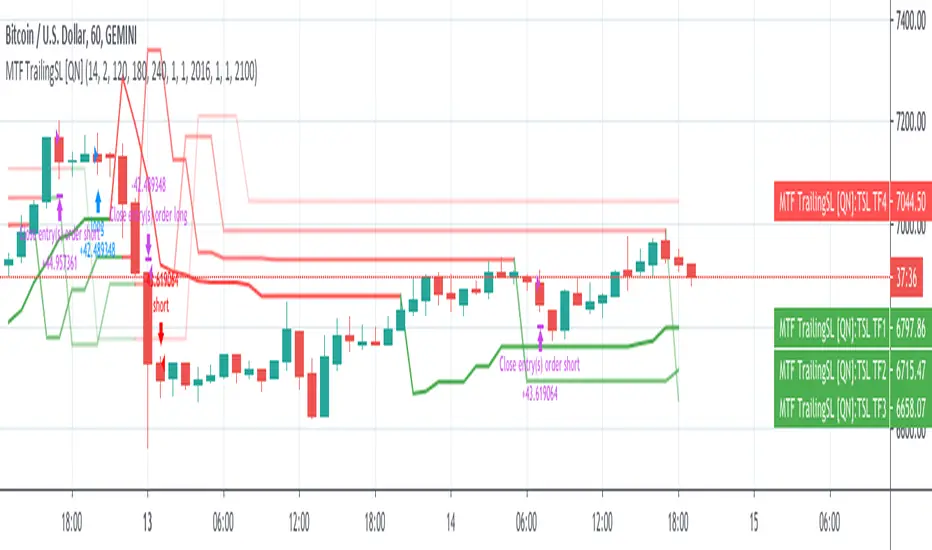
MTF Trailing SL Strategy [QuantNomad]This is a Multi-Timeframe version of my Trailing SL Strategy.
Few weeks ago I published Trailing SL Strategy. There I used only basic Trailing SL to enter positions.
It worked pretty well so I tried to work on it a bit. I thought what if you can use the same ATR TSL on different timeframes and combine them into one signal.
In this strategy you can use only ATR stops and choose 3 other higher timeframes in addition to your current timeframe.
You'll see Trailing SL plotted on the chart form all these timeframes.
Entry Long position if all 4 time-frames agree on long signal.
Exit Long positions when at least 2 time-frames disagree on long signal.
Entry to Short position if all 4 time-frames agree on Short signal.
Exit from Short positions when at least 2 time-frames disagree on Short signal.
Here is the link to my basic Trailing SL Strategy: