MVRV Ratio Indicator [captainua]MVRV Ratio Indicator - Market Value to Realized Value Ratio
Overview
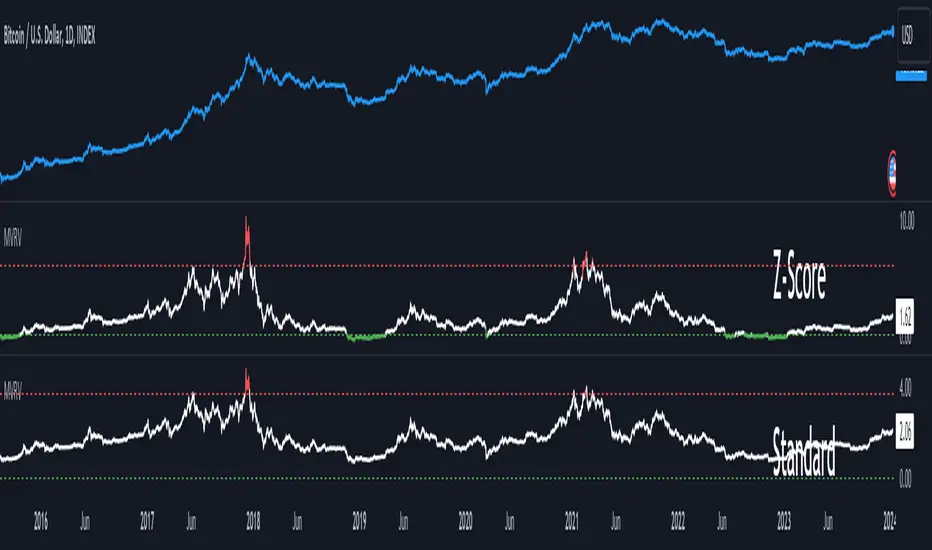
This professional indicator calculates and visualizes the MVRV (Market Value to Realized Value) ratio (raw, non-Z-score) with optional MVRV-Z overlay, comparing current market capitalization to realized capitalization to help identify potential market tops and bottoms for cryptocurrency markets.
Unlike MVRV-Z which normalizes the ratio using standard deviation (creating a Z-score), the raw MVRV ratio provides direct comparison between market cap and realized cap. This indicator enhances the raw ratio with historical percentile bands, percentile rank calculation, divergence detection, historical event logging, dynamic color gradients, enhanced visualization options, optional MVRV-Z comparison, and NEW advanced metrics including Risk Score, MVRV Momentum, Time in Zone tracking, and Price Target calculations.
NEW Features in This Version:
• Risk Score (0-100): Composite indicator based on MVRV level and percentile rank for instant risk assessment
• MVRV Momentum: Rate of change indicator showing trend direction (↑ Increasing, ↓ Decreasing, → Flat)
• Time in Zone: Tracks how long MVRV has been in the current zone (top/bottom/neutral) in bars
• Price Targets: Calculates price levels at key MVRV thresholds (fair value, top, bottom)
• Input Validation: Warns about invalid parameter combinations (e.g., extreme thresholds out of order)
• Multiple Smoothing Options: SMA, EMA, WMA, RMA for noise reduction
• Performance Optimized: Cached request.security() calls, ta.percentrank() for efficiency
• Human-Readable Timestamps: Event log now shows dates (YYYY-MM-DD) instead of bar indices
Core Calculations
MVRV Ratio Calculation:
The script calculates MVRV ratio using the standard formula: MVRV Ratio = Market Cap / Realized Cap. This formula provides a direct ratio without normalization, showing how many times the current market cap exceeds (or falls below) the realized cap.
Market Capitalization (Market Cap): The total market value of all coins in circulation, calculated as current price × circulating supply. This represents the market's current valuation of the asset.
Realized Capitalization (Realized Cap): The sum of the value of each coin when it last moved on-chain, representing the average cost basis of all coins.
Raw Ratio Interpretation:
- Ratio > 3.5: Extreme overvaluation (market cap significantly above realized cap)
- Ratio 2.5-3.5: Moderate overvaluation
- Ratio 1.0-2.5: Fair value to moderate overvaluation
- Ratio 0.8-1.0: Fair value to moderate undervaluation
- Ratio < 0.8: Undervaluation (market cap close to or below realized cap)
Risk Score (NEW):
Composite risk indicator ranging from 0-100:
- 80-100: Very High Risk (extreme overvaluation)
- 60-80: High Risk (overvaluation)
- 40-60: Moderate Risk (fair value range)
- 20-40: Low Risk (undervaluation)
- 0-20: Very Low Risk (extreme undervaluation)
The risk score uses percentile rank when available, or normalizes MVRV ratio to the 0-100 scale based on configured thresholds.
MVRV Momentum (NEW):
Rate of change indicator showing trend direction:
- ↑ Increasing: MVRV ratio rising (momentum > 0.01)
- ↓ Decreasing: MVRV ratio falling (momentum < -0.01)
- → Flat: MVRV ratio stable
- Displays percentage change over configurable period (default: 14 bars)
Time in Zone (NEW):
Tracks duration in current zone:
- Top Zone: Bars spent above top threshold (3.5)
- Bottom Zone: Bars spent below bottom threshold (0.8)
- Neutral Zone: Bars spent between thresholds
- Resets when zone changes
- Helps identify prolonged extreme conditions
Price Targets (NEW):
Calculates price levels at key MVRV thresholds:
- Price @ Fair Value: Price when MVRV = 1.0
- Price @ Top Threshold: Price when MVRV = 3.5
- Price @ Bottom Threshold: Price when MVRV = 0.8
- Based on estimated realized price (current price / MVRV ratio)
Data Source Selection:
The indicator supports multiple data source options for maximum flexibility:
Glassnode (Recommended):
- Uses Glassnode Market Cap data
- Calculates MVRV from Market Cap / Realized Cap
- Symbol format: GLASSNODE:{TOKEN}_MARKETCAP
- Requires Glassnode data subscription
- Also requires CoinMetrics for Realized Cap
- Best for comprehensive analysis with MVRV-Z comparison
IntoTheBlock:
- Direct MVRV ratio data from IntoTheBlock
- Simplest option - no calculations required
- Works for BTC and other supported tokens
- Symbol format: INTOTHEBLOCK:{TOKEN}_MVRV
- Requires IntoTheBlock data subscription on TradingView
Historical Percentile Bands:
The indicator calculates rolling percentile bands over a configurable period (default: 500 bars):
- 5th Percentile: Very low historical values (extreme undervaluation range)
- 25th Percentile: Lower quartile (undervaluation range)
- 50th Percentile: Median (fair value center)
- 75th Percentile: Upper quartile (overvaluation range)
- 95th Percentile: Very high historical values (extreme overvaluation range)
Percentile bands use ta.percentile_nearest_rank() for efficient calculation.
Percentile Rank:
Percentile rank shows where the current MVRV ratio sits in the historical distribution (0-100%):
- 0-25%: Bottom quartile (undervaluation)
- 25-50%: Lower half (moderate undervaluation to fair value)
- 50-75%: Upper half (fair value to moderate overvaluation)
- 75-100%: Top quartile (overvaluation)
Now uses efficient ta.percentrank() instead of array-based calculation.
Input Validation (NEW):
The indicator validates input parameters and displays warnings for:
- Extreme High Threshold should be > Top Threshold
- Extreme Low Threshold should be < Bottom Threshold
- Min Lookback Range must be < Max Lookback Range
- Top Threshold should be > Moderate Overvalued
- Moderate Overvalued should be > Fair Value
- Fair Value should be > Bottom Threshold
- Rapid Increase Threshold should be > 0
- Rapid Decrease Threshold should be < 0
Smoothing Options (Enhanced):
Multiple smoothing types available:
- SMA: Simple Moving Average (equal weight)
- EMA: Exponential Moving Average (more weight to recent)
- WMA: Weighted Moving Average (linear weight)
- RMA: Running Moving Average (Wilder's smoothing)
Reference Levels
Overvalued (Potential Top) - 3.5:
The 3.5 level indicates potentially extreme overvaluation. When MVRV ratio exceeds this threshold:
- Market cap is significantly above realized cap
- Potential selling opportunities for profit-taking
- Risk of market corrections or reversals
- Risk Score typically >80 (Very High Risk)
Moderately Overvalued - 2.5:
The 2.5 level indicates moderate overvaluation:
- Market cap is above realized cap but not extreme
- Caution warranted but not necessarily sell signal
- Risk Score typically 60-80 (High Risk)
Fair Value - 1.0:
The 1.0 level indicates fair valuation:
- Market cap equals realized cap
- Balanced market conditions
- Risk Score typically 40-60 (Moderate Risk)
Undervalued (Potential Bottom) - 0.8:
The 0.8 level indicates potentially undervalued conditions:
- Market cap is close to or below realized cap
- Potential buying opportunities for accumulation
- Risk Score typically <40 (Low Risk)
Visual Features
MVRV Ratio Line:
The main indicator line displays the calculated MVRV ratio with dynamic color gradient:
- Bright Red: Extreme overvaluation (ratio ≥ top threshold + 0.5)
- Orange: High overvaluation (ratio ≥ top threshold)
- Cornflower Blue: Neutral/Fair value (around fair value level)
- Deep Sky Blue: Low/Undervaluation (ratio ≤ bottom threshold)
- Bright Green: Extreme undervaluation (ratio ≤ bottom threshold - 0.1)
Can also be displayed as histogram/bar chart.
Historical Percentile Bands:
Five percentile bands with optional fills:
- 5th Percentile (Blue): Very low historical range
- 25th Percentile (Blue): Lower quartile
- 50th Percentile (Gray): Historical median
- 75th Percentile (Orange): Upper quartile
- 95th Percentile (Red): Very high historical range
Reference Lines:
Horizontal reference lines at key levels (all customizable):
- Top Threshold (default 3.5): Purple/violet
- Moderate Overvalued (default 2.5): Orange
- Fair Value (1.0): Gray
- Bottom Threshold (default 0.8): Blue
Background Highlights:
Optional background color highlights:
- High Zone (Maroon/Red): MVRV ratio ≥ top threshold
- Low Zone (Green): MVRV ratio ≤ bottom threshold
Divergence Detection:
Advanced divergence detection between price and MVRV ratio:
- Regular Bullish Divergence: Price lower low + MVRV higher low
- Regular Bearish Divergence: Price higher high + MVRV lower high
- Hidden Bullish Divergence: Price higher low + MVRV lower low
- Hidden Bearish Divergence: Price lower high + MVRV higher high
- Visual markers with icons (🐂/🐻) and connecting lines
Historical Event Log (Enhanced):
Comprehensive event tracking:
- Tracks zone entries/exits, extreme values, cross events
- Now displays human-readable dates (YYYY-MM-DD) instead of bar indices
- Color-coded events (red for top/high, green for bottom/low)
- Configurable log size (5-50 events)
Information Table (Enhanced):
Comprehensive on-chart table with NEW metrics:
Current Values:
- MVRV Ratio: Current ratio value
- Percentile Rank: Position in historical distribution (0-100%)
- Risk Score (NEW): Composite risk indicator (0-100) with risk level
- Market Status: Current market condition
- Signal: Trading signal (Strong Buy/Buy/Hold/Sell/Strong Sell)
- MVRV Momentum (NEW): Trend direction with percentage change
- Time in Zone (NEW): Current zone and duration in bars
Price Information (Enhanced):
- Current Price: Current market price
- Est. Realized Price: Estimated realized price
- Price @ Fair Value (NEW): Price when MVRV = 1.0
- Price @ Top Threshold (NEW): Price when MVRV = 3.5
- Price @ Bottom Threshold (NEW): Price when MVRV = 0.8
Other Metrics:
- Percentile Bands: Range from 5th to 95th percentile
- MVRV-Z Score: Z-score value (when comparison enabled)
- Change (1D/1W/1M): Ratio change over timeframes
- To Top/Bottom: Percentage distance to key levels
- Historical Range: Percentage below ATH / above ATL
- 30D Volatility: Standard deviation
Historical Event Log:
- Recent events with dates and values
- Color-coded for quick identification
Alert System
Comprehensive alerting capabilities:
Zone Alerts:
- Top Zone Entry/Exit
- Bottom Zone Entry/Exit
Cross Alerts:
- Cross Above/Below Top Threshold
- Cross Above/Below Fair Value (1.0)
Extreme Value Alerts:
- Extreme High (configurable, default: 4.5)
- Extreme Low (configurable, default: 0.7)
Rate of Change Alerts:
- Rapid Increase/Decrease
Divergence Alerts:
- Bullish/Bearish Divergence
- Hidden Bullish/Bearish Divergence
All alerts support cooldown to prevent spam.
Usage Instructions
Getting Started:
1. Select data source (Glassnode recommended)
2. Enable Risk Score for composite risk assessment (0-100)
3. Enable MVRV Momentum to track trend direction
4. Enable Time in Zone to see zone duration
5. Enable Price Targets to see price levels at key thresholds
6. Use weekly timeframe for cleaner signals
Risk-Based Position Sizing:
Use Risk Score to guide position sizing:
- Risk Score >80 (Very High Risk): Reduce/exit positions
- Risk Score 60-80 (High Risk): Smaller positions, caution
- Risk Score 40-60 (Moderate Risk): Normal positions
- Risk Score 20-40 (Low Risk): Larger positions opportunity
- Risk Score <20 (Very Low Risk): Strong accumulation zone
Momentum-Based Analysis:
Use MVRV Momentum for trend confirmation:
- ↑ Increasing + High MVRV: Late bull market, caution
- ↑ Increasing + Low MVRV: Recovery phase, bullish
- ↓ Decreasing + High MVRV: Distribution, potential top
- ↓ Decreasing + Low MVRV: Capitulation, accumulation opportunity
Zone Duration Analysis:
Use Time in Zone for context:
- Extended time in Top Zone: Late cycle, increased reversal risk
- Extended time in Bottom Zone: Accumulation opportunity
- Quick zone transitions: Higher volatility regime
Price Target Usage:
Use Price Targets for planning:
- Price @ Fair Value: Natural equilibrium level
- Price @ Top Threshold: Potential distribution target
- Price @ Bottom Threshold: Potential accumulation target
Technical Specifications
- Pine Script Version: v6
- Indicator Type: Non-overlay (displays in separate panel)
- Repainting Behavior: Minimal - calculations based on confirmed bar data
- Performance: Optimized with cached request.security() calls and ta.percentrank()
- Input Validation: Validates parameter combinations with warnings
- Compatibility: Works on all timeframes (data sources provide daily resolution)
- Edge Case Handling: Zero-division protection, NA value handling, boundary checks
Performance Optimizations:
- Cached request.security() calls for Market Cap, Realized Cap, and IntoTheBlock data
- Efficient ta.percentrank() replaces array-based percentile calculation
- Consolidated duplicate code (color functions, state tracking)
- Single-line ternary expressions for Pine Script compatibility
Constants:
- MAX_HISTORY_BARS = 5000 (TradingView's limit)
- PERCENTILE_EXTREME_HIGH = 90.0
- PERCENTILE_HIGH = 75.0
- PERCENTILE_MID = 50.0
- PERCENTILE_LOW = 25.0
- MIN_PERCENTILE_SAMPLES = 10
- DEFAULT_VOLATILITY_HIGH = 0.1
Known Limitations
- Data availability: Requires valid data subscription (IntoTheBlock, Glassnode, or CoinMetrics)
- Token support: Works with tokens supported by the selected data source
- Historical data: Percentile calculations require sufficient history (200+ bars recommended)
- Timeframe: Always uses daily resolution data from providers; works on all chart timeframes
- History limit: All lookback periods capped at 5000 bars
Changelog
Latest Version:
- Added Risk Score (0-100) composite indicator
- Added MVRV Momentum with trend direction
- Added Time in Zone tracking
- Added Price Target calculations
- Added Input Validation with warnings
- Added multiple smoothing options (SMA, EMA, WMA, RMA)
- Improved performance with cached security calls
- Replaced array-based percentile with ta.percentrank()
- Human-readable timestamps in event log (YYYY-MM-DD)
- Fixed hline() conditional value bug
- Consolidated duplicate code
- Updated indicator name for clarity
For detailed usage instructions, see the script comments.
Mvrv

Adaptive MVRV & RSI Strategy V6 (Dynamic Thresholds)Strategy Explanation
This is an advanced Dollar-Cost Averaging (DCA) strategy for Bitcoin that aims to adapt to long-term market cycles and changing volatility. Instead of relying on fixed buy/sell signals, it uses a dynamic, weighted approach based on a combination of on-chain data and classic momentum.
Core Components:
Dual-Indicator Signal: The strategy combines two powerful indicators for a more robust signal:
MVRV Ratio: An on-chain metric to identify when Bitcoin is fundamentally over or undervalued relative to its historical cost basis.
Weekly RSI: A classic momentum indicator to gauge long-term market strength and identify overbought/oversold conditions.
Dynamic, Self-Adjusting Thresholds: The core innovation of this strategy is that it avoids fixed thresholds (e.g., "sell when RSI is 70"). Instead, the buy and sell zones are dynamically calculated based on a long-term (2-year) moving average and standard deviation of each indicator. This allows the strategy to automatically adapt to Bitcoin's decreasing volatility and changing market structure over time.
Weighted DCA (Scaling In & Out): The strategy doesn't just buy or sell a fixed amount. The size of its trades is scaled based on conviction:
Buying: As the MVRV and RSI fall deeper into their "undervalued" zones, the percentage of available cash used for each purchase increases.
Selling: As the indicators rise further into "overvalued" territory, the percentage of the current position sold also increases.
This creates an adaptive system that systematically accumulates during periods of fear and distributes during periods of euphoria, with the intensity of its actions directly tied to the extremity of market conditions.

Short Term Holder MVRVShort-Term Holder MVRV is an indicator designed to assess the ratio between the Market Value and the Realized Value of Bitcoin that has been held for less than 155 days.
Market Value is calculated as the current price of Bitcoin multiplied by its circulating supply.
[ Realized Value is derived by multiplying the realized price of Bitcoin (the price at which the coins last moved) by the circulating supply. It represents the total cost basis of all Bitcoin held by short-term holders.
Key Interpretations:
Indicator Value < 1: When this metric is below 1, it suggests that the market value of Bitcoin held by short-term holders is lower than their cost basis (Realized Value), meaning they are, on average, holding at a loss. The lower this value, the greater the average loss.
Indicator Value > 1: When the metric exceeds 1, it indicates that the market value is higher than the realized value, signifying that short-term holders are, on average, in profit. The higher this value, the greater the average profit.
Indicator Value = 1: The value of 1 is seen as a breakeven point for short-term investors, often acting as a critical support or resistance level for Bitcoin's price.

MVRV-Z adjusted EN version (by ilyaevp95)Descriptions:
The MVRV Z-Score indicator is a powerful tool designed by original authors Murad Mahmudov and David Puell for BTC to help traders make informed decisions about their cryptocurrency investments. It is based on the MVRV (Market Value to Realized Value) metric, which measures the relationship between the market capitalization and the realized capitalization of a cryptocurrency. The indicator provides signals for accumulating or selling an asset based on deviations in market capitalization from realized capitalization.
How it works:
Market Capitalization : This is the total value of coins that have been issued at a given point in time. Market capitalization is calculated by multiplying the current price of the asset by the number of coins that have been issued.
Realized Capitalization (Realized Price) : This is the amount of money that has been spent on purchasing a particular asset. In the context of cryptocurrencies, it represents the sum of all transaction values for a specific blockchain. Realized capitalization can be calculated using historical data on transaction prices.
MVRV Metric : The MVRV metric compares market capitalization with realized capitalization, providing a measure of how overvalued or undervalued a cryptocurrency is relative to its historical transaction data. A high MVRV value indicates that the market is overvaluing the asset, while a low MVRV suggests undervaluation.
Z-Score Calculation : The Z-score is a statistical measure that normalizes the deviation of market capitalization from its mean value (realized capitalization) to a standard deviation. This makes it possible to compare assets that have different values and time periods, as it takes into account the volatility of the market.
Note: For accurate Z-score calculation, you need to use the indicator on a chart with a mostly complete historical data set for a specific cryptocurrency.
Signals : Based on the Z-score, the indicator generates signals for accumulation or sale. If the Z-score falls below a certain threshold (negative), it may indicate an opportunity to accumulate the asset. Conversely, if the Z-score rises above a positive threshold, it could suggest a potential sell signal.
The indicator uses a color-coded system to provide traders with visual cues:
Green background indicates a signal to accumulate.
Orange (Red) background indicates a signal to sell.
Deviations exceeding the specified thresholds by 1 and 2 Z (positive direction), 0.5 and 1 Z (negative direction) are highlighted in a brighter color, indicating more extreme deviations.
Note: The signals provided by this indicator should not be considered financial advice. Traders should conduct their own research (DYOR) before making any investment decisions.
Parameters: The indicator provides several parameters for customization:
Blockchain : The blockchain for which the analysis is performed. This allows the user to select the specific blockchain they are interested in analyzing. The default value is BTC.
Z threshold for positive deviations : This parameter sets the threshold above which the deviation will be considered positive. A higher value will result in fewer signals, while a lower value may generate more false signals. The default value is 3.0.
Z threshold for negative deviations : Similar to the previous parameter, this sets the threshold below which the deviation will be considered negative. The default value is 0.
Market Capitalization : There are two types of market capitalization available: Standard and Free float coin capitalization. Free float is calculated by multiplying its current price by the total number of units in free circulation - the number that are not locked in any contracts or other forms of restriction. For DASH, ZEC, BAT and ALGO available only Free float capitalization. The default value is "Standard"
Negative Deviation Filter Mode : When enabled, if the deviation has been positive for a certain number of previous weeks (the default value is 40 weeks), the indicator will not generate a signal to accumulate. This helps to avoid false signals during the start of a bearish market. This may be helpful for volatile coins, whose price can drastically fall below the realized price after the end of a bull market. The default setting is "disabled".
Display Options:
MVRV plot : Displays the MVRV metric for the selected blockchain.
Z-Score plot : Shows the Z-score calculated by the indicator.
Realized Price plot : Provides a visual representation of the realized price of the cryptocurrency on main chart.
S ignal Display : Choose whether to display signals on the main chart or in a separate panel.
Historical mode : Choose whether to show signals for all historical data on the chart or for a certain number of periods. The default setting is "disabled".

Crypto MVRV ZScore - Strategy [PresentTrading]█ Introduction and How it is Different
The "Crypto Valuation Extremes: MVRV ZScore - Strategy " represents a cutting-edge approach to cryptocurrency trading, leveraging the Market Value to Realized Value (MVRV) Z-Score. This metric is pivotal for identifying overvalued or undervalued conditions in the crypto market, particularly Bitcoin. It assesses the current market valuation against the realized capitalization, providing insights that are not apparent through conventional analysis.
BTCUSD 6h Long/Short Performance
Local
█ Strategy, How It Works: Detailed Explanation
The strategy leverages the Market Value to Realized Value (MVRV) Z-Score, specifically designed for cryptocurrencies, with a focus on Bitcoin. This metric is crucial for determining whether Bitcoin is currently undervalued or overvalued compared to its historical 'realized' price. Below is an in-depth explanation of the strategy's components and calculations.
🔶Conceptual Foundation
- Market Capitalization (MC): This represents the total dollar market value of Bitcoin's circulating supply. It is calculated as the current price of Bitcoin multiplied by the number of coins in circulation.
- Realized Capitalization (RC): Unlike MC, which values all coins at the current market price, RC is computed by valuing each coin at the price it was last moved or traded. Essentially, it is a summation of the value of all bitcoins, priced at the time they were last transacted.
- MVRV Ratio: This ratio is derived by dividing the Market Capitalization by the Realized Capitalization (The ratio of MC to RC (MVRV Ratio = MC / RC)). A ratio greater than 1 indicates that the current price is higher than the average price at which all bitcoins were purchased, suggesting potential overvaluation. Conversely, a ratio below 1 suggests undervaluation.
🔶 MVRV Z-Score Calculation
The Z-Score is a statistical measure that indicates the number of standard deviations an element is from the mean. For this strategy, the MVRV Z-Score is calculated as follows:
MVRV Z-Score = (MC - RC) / Standard Deviation of (MC - RC)
This formula quantifies Bitcoin's deviation from its 'normal' valuation range, offering insights into market sentiment and potential price reversals.
🔶 Spread Z-Score for Trading Signals
The strategy refines this approach by calculating a 'spread Z-Score', which adjusts the MVRV Z-Score over a specific period (default: 252 days). This is done to smooth out short-term market volatility and focus on longer-term valuation trends. The spread Z-Score is calculated as follows:
Spread Z-Score = (Market Z-Score - MVVR Ratio - SMA of Spread) / Standard Deviation of Spread
Where:
- SMA of Spread is the simple moving average of the spread over the specified period.
- Spread refers to the difference between the Market Z-Score and the MVRV Ratio.
🔶 Trading Signals
- Long Entry Condition: A long (buy) signal is generated when the spread Z-Score crosses above the long entry threshold, indicating that Bitcoin is potentially undervalued.
- Short Entry Condition: A short (sell) signal is triggered when the spread Z-Score falls below the short entry threshold, suggesting overvaluation.
These conditions are based on the premise that extreme deviations from the mean (as indicated by the Z-Score) are likely to revert to the mean over time, presenting opportunities for strategic entry and exit points.
█ Practical Application
Traders use these signals to make informed decisions about opening or closing positions in the Bitcoin market. By quantifying market valuation extremes, the strategy aims to capitalize on the cyclical nature of price movements, identifying high-probability entry and exit points based on historical valuation norms.
█ Trade Direction
A unique feature of this strategy is its configurable trade direction. Users can specify their preference for engaging in long positions, short positions, or both. This flexibility allows traders to tailor the strategy according to their risk tolerance, market outlook, or trading style, making it adaptable to various market conditions and trader objectives.
█ Usage
To implement this strategy, traders should first adjust the input parameters to align with their trading preferences and risk management practices. These parameters include the trade direction, Z-Score calculation period, and the thresholds for long and short entries. Once configured, the strategy automatically generates trading signals based on the calculated spread Z-Score, providing clear indications for potential entry and exit points.
It is advisable for traders to backtest the strategy under different market conditions to validate its effectiveness and adjust the settings as necessary. Continuous monitoring and adjustment are crucial, as market dynamics evolve over time.
█ Default Settings
- Trade Direction: Both (Allows for both long and short positions)
- Z-Score Calculation Period: 252 days (Approximately one trading year, capturing a comprehensive market cycle)
- Long Entry Threshold: 0.382 (Indicative of moderate undervaluation)
- Short Entry Threshold: -0.382 (Signifies moderate overvaluation)
These default settings are designed to balance sensitivity to market valuation extremes with a pragmatic approach to trade execution. They aim to filter out noise and focus on significant market movements, providing a solid foundation for both new and experienced traders looking to exploit the unique insights offered by the MVRV Z-Score in the cryptocurrency market.

MVRV Z-ScoreThe MVRV ratio was created by Murad Mahmudov & David Puell. It simply compares Market Cap to Realised Cap, presenting a ratio (MVRV = Market Cap / Realised Cap). The MVRV Z-Score is a later version, refining the metric by normalising the peaks and troughs of the data.
MVRV Z Score and MVRV Free Float Z-ScoreIMPORTANT: This script needs as much historic data as possible. Please run it on INDEX:BTCUSD , BNC:BLX or another chart of sufficient length.
MVRV
The MVRV (Market Value to Realised Value Ratio) simply divides bitcoins market cap by bitcoins realized market cap. This was previously impossible on Tradingview but has now been made possible thanks to Coinmetrics providing us with the realized market cap data.
In the free float version, the free float market cap is used instead of the regular market cap.
Z-Score
The MVRV Z-score divides the difference between Market cap and realized market cap by the historic standard deviation of the market cap.
Historically, this has been insanely accurate at detecting bitcoin tops and bottoms:
A Z-Score above 7 means bitcoin is vastly overpriced and at a local top.
A Z-Score below 0.1 means bitcoin is underpriced and at a local bottom.
In the free float version, the free float market cap is used instead of the regular market cap.
The Z-Score, also known as the standard score is hugely popular in a wide range of mathematical and statistical fields and is usually used to measure the number of standard deviations by which the value of a raw score is above or below the mean value of what is being observed or measured.
Credits
MVRV Z Score initially created by aweandwonder
MVRV initially created by Murad Mahmudov and David Puell
