On-Chain Signals [LuxAlgo]The On-Chain Signals indicator uses fundamental blockchain metrics to provide traders with an objective technical view of their favorite cryptocurrencies.
It uses IntoTheBlock datasets integrated within TradingView to generate four key signals: Net Network Growth, In the Money, Concentration, and Large Transactions.
Together, these four signals provide traders with an overall directional bias of the market. All of the data can be visualized as a gauge, table, historical plot, or average.
🔶 USAGE
The main goal of this tool is to provide an overall directional bias based on four blockchain signals, each with three possible biases: bearish, neutral, or bullish. The thresholds for each signal bias can be adjusted on the settings panel.
These signals are based on IntoTheBlock's On-Chain Signals.
Net network growth: Change in the total number of addresses over the last seven periods; i.e., how many new addresses are being created.
In the Money: Change in the seven-period moving average of the total supply in the money. This shows how many addresses are profitable.
Concentration: Change in the aggregate addresses of whales and investors from the previous period. These are addresses holding at least 0.1% of the supply. This shows how many addresses are in the hands of a few.
Large Transactions: Changes in the number of transactions over $100,000. This metric tracks convergence or divergence from the 21- and 30-day EMAs and indicates the momentum of large transactions.
All of these signals together form the blockchain's overall directional bias.
Bearish: The number of bearish individual signals is greater than the number of bullish individual signals.
Neutral: The number of bearish individual signals is equal to the number of bullish individual signals.
Bullish: The number of bullish individual signals is greater than the number of bearish individual signals.
If the overall directional bias is bullish, we can expect the price of the observed cryptocurrency to increase. If the bias is bearish, we can expect the price to decrease. If the signal is neutral, the price may be more likely to stay the same.
Traders should be aware of two things. First, the signals provide optimal results when the chart is set to the daily timeframe. Second, the tool uses IntoTheBlock data, which is available on TradingView. Therefore, some cryptocurrencies may not be available.
🔹 Display Mode
Traders have three different display modes at their disposal. These modes can be easily selected from the settings panel. The gauge is set by default.
🔹 Gauge
The gauge will appear in the center of the visible space. Traders can adjust its size using the Scale parameter in the Settings panel. They can also give it a curved effect.
The number of bars displayed directly affects the gauge's resolution: More bars result in better resolution.
The chart above shows the effect that different scale configurations have on the gauge.
🔹 Historical Data
The chart above shows the historical data for each of the four signals.
Traders can use this mode to adjust the thresholds for each signal on the settings panel to fit the behavior of each cryptocurrency. They can also analyze how each metric impacts price behavior over time.
🔹 Average
This display mode provides an easy way to see the overall bias of past prices in order to analyze price behavior in relation to the underlying blockchain's directional bias.
The average is calculated by taking the values of the overall bias as -1 for bearish, 0 for neutral, and +1 for bullish, and then applying a triangular moving average over 20 periods by default. Simple and exponential moving averages are available, and traders can select the period length from the settings panel.
🔶 DETAILS
The four signals are based on IntoTheBlock's On-Chain Signals. We gather the data, manipulate it, and build the signals depending on each threshold.
Net network growth
float netNetworkGrowthData = customData('_TOTALADDRESSES')
float netNetworkGrowth = 100*(netNetworkGrowthData /netNetworkGrowthData - 1)
In the Money
float inTheMoneyData = customData('_INOUTMONEYIN')
float averageBalance = customData('_AVGBALANCE')
float inTheMoneyBalance = inTheMoneyData*averageBalance
float sma = ta.sma(inTheMoneyBalance,7)
float inTheMoney = ta.roc(sma,1)
Concentration
float whalesData = customData('_WHALESPERCENTAGE')
float inverstorsData = customData('_INVESTORSPERCENTAGE')
float bigHands = whalesData+inverstorsData
float concentration = ta.change(bigHands )*100
Large Transactions
float largeTransacionsData = customData('_LARGETXCOUNT')
float largeTX21 = ta.ema(largeTransacionsData,21)
float largeTX30 = ta.ema(largeTransacionsData,30)
float largeTransacions = ((largeTX21 - largeTX30)/largeTX30)*100
🔶 SETTINGS
Display mode: Select between gauge, historical data and average.
Average: Select a smoothing method and length period.
🔹 Thresholds
Net Network Growth : Bullish and bearish thresholds for this signal.
In The Money : Bullish and bearish thresholds for this signal.
Concentration : Bullish and bearish thresholds for this signal.
Transactions : Bullish and bearish thresholds for this signal.
🔹 Dashboard
Dashboard : Enable/disable dashboard display
Position : Select dashboard location
Size : Select dashboard size
🔹 Gauge
Scale : Select the size of the gauge
Curved : Enable/disable curved mode
Select Gauge colors for bearish, neutral and bullish bias
🔹 Style
Net Network Growth : Enable/disable historical plot and choose color
In The Money : Enable/disable historical plot and choose color
Concentration : Enable/disable historical plot and choose color
Large Transacions : Enable/disable historical plot and choose color
Network

Bitcoin Fundamentals - Bitcoin Block RewardThe Bitcoin Block Reward is the batch of new Bitcoins generated by the miners after solving each block.
The Block Reward is set as a basic rule and cannot be changed without agreement between the entire Bitcoin network. It started at 50 BTC during the first period. Afterwards the Block Reward gets adjusted to half of it value (Halving Event) on each cycle of 210000 blocks mined.
This is the only way that new bitcoins are created. It creates an incentive for miners to secure the network.
Over time the Block Reward will decreases to a value that might not cover the mining costs. At that point, the use of the Bitcoin Network might have increased sufficiently as to generate enough transaction fees to cover the mining costs.
MOTIVATION
Even though this is a very simple indicator, I'm currently missing a data source to compute the Block Reward value within Tradingview. Therefore, I created this indicator and its associated library function to enable its visualization and (eventually) for coders to make use of the source function to power more elaborate scripts related to the Halving Events.
Hope that helps!

Block Time AverageBitcoins network adjusts to maintain an average block time of 10 Minutes per block.
This chart uses the Hashrate and Difficulty to provide the average block time
< 10 Mins = Hashrate is increasing (Green)
> 10 Mins = Hashrate is decreasing (Red)

Bitcoin DAA OscillatorAn oscillator of Bitcoin's Daily Active Addresses (DAA) and fundamental metric of the utilization of the Bitcoin network.
Helps to identify:
Potential buy zones (green) - when the network utilization is low & increasing
Potential sell zones (red) - when the network utilization is high & decreasing

Bitcoin Network Value to Transactions [aamonkey]Cryptoassets have been quite turbulent in the past few weeks.
At times like this, it is especially important to look at the fundamental foundations of cryptoassets.
This indicator is based on the Network Value to Transactions , or NVT .
Definition:
NVT = Network Value / Daily Transaction Volume
Because this indicator is pulling the Daily Transaction Volume for BTC it can only be used for BTC and the daily timeframe.

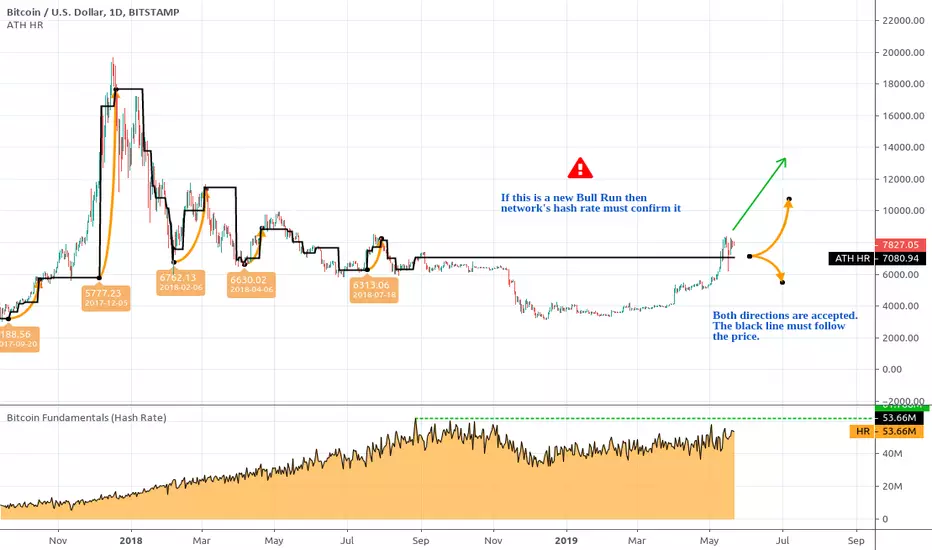
Bitcoin All-Time High (ATH) Hash Rate Level An experimental Bitcoin TotheMoon confirmation tool. Represents a mapping of Bitcoin's All-Time Hash Rate to the corresponding Bitcoin's price on the chart.
As always, you can support the author with donations via PayPal or crypto.
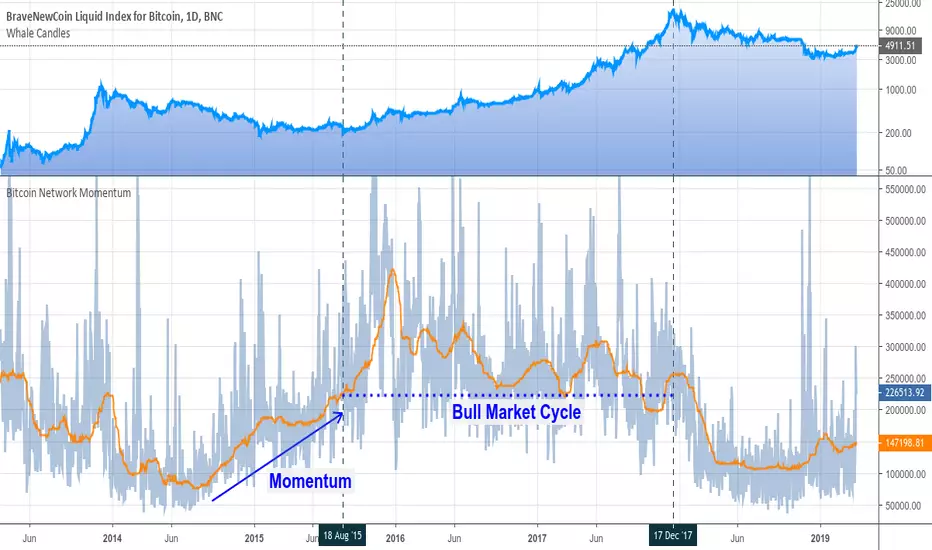
🔗Blockchain Fundamentals - BTC Network Momentum - Cryptorhythms🔗Blockchain Fundamentals - Bitcoin Network Momentum by Cryptorhythms
Description
Network Momentum is a view created by PositiveCrypto which looks into the value transmitted through the Bitcoin blockchain denominated in BTC value plotted against Bitcoin`s price. It serves as a leading indicator of Bitcoin bull markets. Sufficiently high levels of value throughput is needed drive bull markets.
Network Momentum, if it was corrected for Bitcoin`s expanding token supply, would essentially be Bitcoin Velocity. In other words an inverse chart of NVT Ratio.
Bitcoin Network Momentum is another piece of the puzzle to help our understanding of Bitcoin fundamentals and their impact on price. Bitcoin Network Momentum looks at the relationship between Bitcoin’s price and the BTC value of daily transactions flowing through the blockchain.
It is important to note here that we are using the BTC daily value flowing through the blockchain, not the USD daily value which NVT Signal uses.
What we see when we look at this is that the BTC value of daily transactions acts as a leading indicator of Bitcoin’s major market phases.
Extras
We give you the option of changing the median price lookback length
👍 Enjoying this indicator or find it useful? Please give me a like and follow! I post crypto analysis, price action strategies and free indicators regularly.
💬 Questions? Comments? Want to get access to an entire suite of proven trading indicators? Come visit us on telegram and chat, or just soak up some knowledge. We make timely posts about the market, news, and strategy everyday. Our community isn't open only to subscribers - everyone is welcome to join.
For Trialers & Chat: t.me

Bitcoin Network MomentumBitcoin Network Momentum is a leading indicator that relates On-Chain Transactional Volume (measured in BTC)with the evolution of the Bitcoin Price.
Further resources:
Woobull charts
Medium article
Credits: PositiveCrypto