Order Block Finder [MHA Finverse]Order Block Finder is a sophisticated Smart Money Concepts (SMC) tool designed to identify and visualize institutional order blocks on your charts. This indicator helps traders spot key areas where smart money has placed their orders, providing valuable insights for potential support and resistance zones.
What are Order Blocks?
Order blocks are price zones where institutional traders have placed significant orders. This indicator identifies these zones by detecting pivot points in price action and tracking structural breaks in both internal (short-term) and swing (long-term) timeframes.
Key Features:
• Dual Structure Analysis
- Internal Order Blocks: Fast-moving blocks based on 5-bar pivots for short-term trading
- Swing Order Blocks: Slower blocks based on 50-bar pivots for position trading
- Display up to 20 order blocks per type
• Volume Metrics
Each order block displays two important metrics:
- Volume value: The total volume of the candle that formed the order block
- Percentage: Relative volume compared to all visible order blocks (always totals 100%)
Higher percentages indicate stronger institutional activity and more significant zones
• Smart Filtering System
- ATR Filter: Filters out high-volatility candles (>2x ATR) to focus on genuine order blocks
- CMR Filter: Uses Cumulative Mean Range for adaptive filtering across different market conditions
• Flexible Mitigation Options
Choose how order blocks are considered broken:
- High/Low: Order block breaks when price touches its boundary
- Close: Order block breaks only when candle closes through it
• Visual Customization
- Colored or Monochrome themes
- Adjustable text size for volume metrics
- Customizable colors for bullish and bearish blocks
- Historical or Present mode for clean chart analysis
• Built-in Alert System
- Real-time alerts when order blocks are mitigated
- Individual toggles for each alert type
- Clear emoji indicators (🔵 Bullish, 🔴 Bearish)
- Compatible with TradingView's alert system
How It Works:
The indicator identifies order blocks by:
1. Detecting pivot highs and lows in price structure
2. Monitoring when price crosses these pivots (structure breaks)
3. Finding the highest/lowest volatility-filtered candle in the pivot zone
4. Marking this candle as an order block with its volume data
5. Removing blocks when the price mitigates them
Order blocks with higher volume percentages represent stronger institutional interest and are typically more reliable for trading decisions.
Best Practices:
- Use Internal OBs for day trading and scalping
- Use Swing OBs for swing trading and position entries
- Pay attention to blocks with higher volume percentages
- Combine with other SMC concepts for confirmation
Perfect for traders who follow Smart Money Concepts, ICT methodology, and institutional trading analysis.
Disclaimer:
This indicator is provided for educational and informational purposes only. It should not be considered as financial advice or a recommendation to buy or sell any financial instrument. Trading involves substantial risk of loss and is not suitable for all investors. Past performance does not guarantee future results. Always conduct your own research and consult with a qualified financial advisor before making any trading decisions. The creator of this indicator assumes no responsibility for any losses incurred from its use.
سجل الأوامر

Orderblocks MTF Pro (4 HTFs + Alerts) - (@JP7FX)Orderblocks MTF Pro (JP7FX)
Orderblocks MTF Pro identifies higher timeframe orderblocks and displays them on lower timeframe charts. It tracks when new orderblocks form, remain active or become mitigated.
Higher Timeframe Orderblocks
The indicator can display orderblocks from four higher timeframes at the same time.
Users can select which HTFs to show, such as Daily, 4H, 1H and 15m.
Bullish and Bearish Orderblocks
Bullish orderblocks mark areas where buying pressure formed during prior moves.
Bearish orderblocks mark areas where selling pressure formed.
Each block is colour coded and can be customised.
Mitigation Tracking
The tool monitors when price returns to a previously formed orderblock.
If price trades back into the block, the indicator can mark it as mitigated or keep it highlighted as active depending on user settings.
Alerts
Alert conditions are included for:
• New orderblock creation
• Orderblock mitigation
Users can enable or disable alerts for each timeframe.
Customisation
• Choose up to four higher timeframes to display
• Custom colours for bullish and bearish blocks
• Visibility filters for active and mitigated blocks
• Adjustable opacity and block display style
Use Cases
Suitable for traders who reference higher timeframe zones while executing on lower timeframes.
The indicator reduces manual chart work by identifying and updating HTF orderblocks automatically.

MTF FVG, OB & Sessions1. Advanced Multi-Timeframe Fair Value Gaps (FVG)
This is the most complex part of the script. Unlike standard FVG indicators that just draw boxes, this module uses Arrays to manage the gaps dynamically.
Dynamic Mitigation: The script tracks every FVG stored in memory. If price trades through an FVG (mitigates it), the script automatically deletes the box.
Option (Wick vs. Close): You can choose to delete the FVG as soon as a wick touches the other side, or only if a candle closes through it.
Displacement Filter: It uses an ATR (Average True Range) multiplier to ensure that only significant, impulsive moves (displacement) generate an FVG, filtering out low-volatility noise.
Confluence (Overlap) Logic: The script checks for overlaps between the three different timeframes (e.g., a 4H FVG inside a Daily FVG).
Alignment Setting: You can set the script to highlight specific boxes only when timeframes align, indicating a stronger level of interest.
3 Monitorable Timeframes: Defaults to 4-Hour, 1-Hour, and 15-Minute, but fully customizable.
2. Multi-Timeframe Order Blocks (OB)
This module identifies potential Order Blocks based on Swing Highs and Swing Lows (Pivot points).
Pivot Detection: It looks for a specific pattern of highs/lows (defined by the "Swing Lookback" input) to identify key reversal points on higher timeframes.
MTF Overlay: It fetches these structures from the 3 defined timeframes and projects them onto your current chart.
Visuals: Draws extended boxes representing the open/close range of the order block candle.
3. Session Liquidity (Highs & Lows)
This module tracks the specific trading sessions to highlight intraday liquidity pools.
Sessions Tracked: Asia, London, and New York.
Behavior:
While the session is active, it tracks the highest and lowest price.
Once the session closes, it draws dashed lines extending forward from that session's High and Low.
Purpose: These levels act as key targets for liquidity sweeps (e.g., price sweeping the London Low before reversing).
Technical Summary
Data Handling: Uses request.security with barmerge.lookahead_on to fetch data from higher timeframes without repainting historical closed bars.
Efficiency: Uses specific types (type OB_Data) and Arrays to handle data efficiently, keeping the script fast despite processing multiple timeframes simultaneously.
Limits: Includes a built-in "Max FVG Storage" and "Delete After X Bars" feature to prevent the chart from becoming too cluttered with old data.

SCOB Pattern with ERC & AlertsSingle Candle Block (SC0B) consists of a single candle appearing at a significant price level, indicating a confirmed reversal in price direction from that particular area of interest.
SCOB is primarily used to confirm and execute trades.
Using a single candle block to enter a trade minimizes risk and maximizes reward.
Single bullish candle block?
1st candle closes at bullish point of interest with a short or long wick.
2nd candle sweeps the low of previous(1st) candle and closes above the low of previous candle.
3rd candle closes above the high of 2nd candle.
How to trade with Scob bullish.
To Trade using Bullish SCOB you have to wait for price to come down and test the single candle order block.
When price tests the SCOB you can directly execute a buy trade or for a precise entry you can wait for a market structure shift in lower time frame.
Scob discount is the opposite of price increase.
This strategy should only be used when price "sweeps through key lever, liquidity, imbalance, poi htf areas.
This indicator will add a filter to help you reduce signal noise.
Use the "Use engulfing candle to test" function to filter the 3rd candle.
Only search for Scob if the 3rd candle is an Engulfing candle.
The logic for finding Engulfing candles can be changed based on the "% maximum wick length" option. The default is that the candle wick is 25% of the total candle wick length.
You can also use the alert function when Scob appears
With Smart money concept, no strategy is perfect in trading, so you should not risk too much of your capital on this strategy.
To be safer, always remember to use stop loss for every trade.

Đại Ka 3 ATR BandsĐại Ka 3 ATR Bands – The ultimate single-slot indicator that replaces three separate ATR plots.
Designed specifically for ICT/SMC traders in 2025:
• Light red band (±0.5 ATR) → fake moves, Judas Swing, Turtle Soup zone
• Gray band (±1.0 ATR) → normal price action
• Light green band (±2.0 ATR) → real displacement zone → Silver Bullet, SFT, high-probability entries
How to use:
– Price stuck inside red band → expect reversal/fakeout
– Price breaks and closes outside green band + volume spike → enter aggressively in that direction (85%+ win-rate inside Killzones)
Default ATR(14), subtle fills for instant visual filtering of real vs fake moves.
Perfect companion for Order Blocks, FVG, Breaker Blocks and NY/London Killzones.
Free forever – coded with love by Đại Ka & Vietnamese ICT crew.


First week of the yearA very simple indicator that marks a channel on the candlestick for the first week of the year.
The channel can serve as an entry/exit point with a medium and long term focus.
Note: This indicator should be observed exclusively on the weekly timeframe.
cd_VWAP_mtg_CxCd_VWAP_mtg_Cx
Overview
The most important condition for being successful and profitable in the market is to consistently follow the same rules without compromise, while the price constantly moves in countless different ways.
Regardless of the concept or trading school, those who have rules win.
In this indicator, we will define and use three main sections to set and apply our rules.
The indicator uses the VWAP (Volume Weighted Average Price) — price weighted by volume.
Two VWAPs can be displayed either by manually entering date and time, or by selecting from the menu.
From the menu, you can select the following reference levels:
• HTF Open: Opening candle of the higher timeframe
• ATH / ATL: All-Time High / All-Time Low candles
• PMH / PML, PWH / PWL, PDH / PDL, PH4H / PH4L: Previous Month, Week, Day, or H4 Highs/Lows
• MH / ML, WH / WL, DH / DL, H4H / H4L: Current Month, Week, Day, or H4 Highs/Lows
Additionally, it includes:
• Mitigation / Order Block zones (local buyer-seller balance) across two timeframes.
• Buy/Sell Side Liquidity levels (BSL / SSL) from the aligned higher timeframe (target levels).
________________________________________
Components and Usage
1 – VWAP
Calculated using the classical method:
• High + Volume for the upper value
• Close + Volume for the middle value
• Low + Volume for the lower value
The VWAP is displayed as a colored band, where the coloring represents the bias.
Let’s call this band FVB (Fair Value Band) for ease of explanation.
The FVB represents the final line of defense, the buyer/seller boundary, and in technical terms, it can be viewed as premium/discount zones or support/resistance levels.
Within this critical area, the strong side continues its move, while the weaker side is forced to retreat.
But does the side that breaks beyond the band always keep going?
We all know that’s not always the case — in different pairs and timeframes, price often violates both the upper and lower edges multiple times.
To achieve more consistent analysis, we’ll define a new set of rules.
________________________________________
2 – Mitigation / Order Blocks
In trading literature, there are dozens of different definitions and uses of mitigation or order blocks.
Here, we will interpret the candlesticks to create our own definition, and we’ll use the zones defined by candles that fit this pattern.
For simplicity, let’s abbreviate mitigation as “mtg.”
For a candle to be selected as an mtg, it must clearly show strength from one side (buyers or sellers) — which can also be observed visually on the chart.
________________________________________
Bullish mtg criteria:
1. The first candle must be bullish (close > open) → buyers are strong.
2. The next candle makes a new high (buyers push higher) but fails to close above and pulls back to close inside the previous range → sellers react.
It also must not break the previous low → buyers defend.
3. In the following candle(s), as long as the first candle’s low is protected and the second candle’s high is broken, it indicates buyer strength → a bullish mtg is confirmed.
When price returns to this zone later (gets mitigated), the expectation is that the zone holds and price pushes upward again.
If the low is violated, the mtg becomes invalid.
In technical terms:
If the previous candle’s high is broken but no close occurs above it, the expectation is a reversal move that will retest its low.
Question:
What if the low is protected and in the next candle(s) a new high forms?
Answer: → Bullish mtg.
Bearish mtg (opposite)
3 – Buy/Sell Side Liquidity Levels
With the help of the aligned higher timeframe (swing points), we will define our market structure framework and set our liquidity targets accordingly.
Let’s put the pieces together.
If we continue explaining from a trade-focused perspective, our first priority should be our bias — our projection or expectation of the market’s potential movement.
We will determine this bias using the FVB.
Since we know the band often gets violated on both sides, we want the price action to convince us of its strength.
To do that, we’ll use the first candle that closes beyond the band.
The distance from that candle’s high to low will be our threshold range
Bullish level = high + (candle length × coefficient)
Bearish level = low - (candle length × coefficient)
When the price closes beyond this threshold, it demonstrates strength, and our bias will now align in that direction.
How long will this bias remain valid?
→ Until a closing candle appears on the opposite side of the band.
If a close occurs on the opposite side, then a new bias will only be confirmed once the new threshold level is broken.
During the period in between, we have no bias.
Let’s continue on the chart:
Now that our bias has been established, where and how do we look for trade opportunities?
There are two possible entry approaches:
• Aggressive entry: Enter immediately with the breakout.
• Conservative entry: Wait for a pullback and enter once a suitable structure forms.
(The choice depends on the user’s preference.)
At this stage, the user can apply their own entry model. Let’s give an example:
Let’s assume we’re looking for setups using HTF sweep + LTF CISD confirmation.
Once our bias turns bearish, we look for an HTF sweep forming on or near an FVB or mtg block, and then confirm the entry with a CISD signal.
In summary:
• FVB defines the bias, the entry zone, and the target zone.
• Mtg blocks represent entry zones.
• BSL / SSL levels suggest target zones.
Overlapping FVB and mtg blocks are expected to be more effective.
The indicator also provides an option for a second FVB.
A band attached to a lower timeframe can be used as confirmation.
• Main band: Bias + FVB
• Extra band: Entry trigger confirmed by a close beyond it.
Mtg blocks can provide trade entry opportunities, especially when the price is moving strongly in one direction (flow).
Consecutive or complementary mtg blocks indicate that the price is decisive in one direction, while sometimes also showing areas where we should wait before entering.
Mtg blocks that contain an FVG (Fair Value Gap) within their body are expected to be more effective.
Settings:
The default values are set to 1-3-5m, optimized for scalping trades.
VWAP settings:
Main VWAP (FVB):
• Can be set by selecting a start time, manually entering date and time, or choosing a predefined level.
Extra VWAP (FVB):
• Set from the menu. If not needed, select “none.”
• Visibility, color, and fill settings for VWAP are located here.
• Threshold levels visibility and color options are also in this section.
• The multiplier is used for calculating the threshold level.
Important:
• If the Extra VWAP is selected but not displayed, you need to increase the chart timeframe.
o Example: If the chart is on 3m and you select WH from the extra options, it will not display correctly.
• Upper limits for VWAP:
o 1m and 3m charts: daily High/Low
o 5m chart: weekly High/Low
________________________________________
Mtg Settings:
• Visibility and color settings for blocks are configured here.
• To display on a second timeframe, the box must be checked and the timeframe specified.
• Optional display modes: “only active blocks,” “only last violated mtg,” or “all.”
• For confirmation and removal criteria, choosing high/low or close determines the source used for mtg block formation and deletion conditions.
BSL/SSL Settings:
• Visibility, color, font size, and line style can be configured in this section.
When “Auto” is selected, the aligned timeframe is determined automatically by the indicator, while in manual mode, the user defines the timeframe.
Final Words:
Simply opening trades every time the price touches the VWAP or mtg blocks will not make you a profitable trader. Searching for setups with similar structures while maintaining proper risk management will yield better results in the long run.
I would be happy to hear your feedback and suggestions.
Happy trading!

CISD & OB [BLAZ]Version 1.0 – Published October 2025: Initial release
1. Overview & Purpose
The CISD & OB indicator identifies and plots Order Blocks (OB) and Changes in State of Delivery (CISD) on price charts using a strict rule-based approach designed to highlight structural turning points and continuation zones in price action. It automatically detects these formations when price creates confirmed swing highs or lows, followed by opposing directional moves that break predefined structural levels.
Detection logic is consistently applied across all market conditions, allowing the indicator to identify areas where notable price reactions or liquidity shifts have occurred. These levels are plotted as horizontal lines on the chart and are updated in real time to reflect the latest structural developments, helping traders visualise potential reversal or continuation zones.
The methodology used in this indicator represents the author's specific approach to Order Block and CISD identification, incorporating custom criteria for swing validation and confirmation logic that differ from standard implementations. Detection operates entirely mechanically, without discretionary intervention, to ensure consistency and objectivity across use cases. This indicator functions on all standard timeframes and supports multiple asset classes, including Forex, Stocks, Cryptocurrencies, Futures, and Commodities.
The indicator is unique in its ability to apply detection logic to a custom timeframe, enabling multi-timeframe structural analysis without switching charts. Let’s begin by explaining key terminologies based on the author’s perception to aid in understanding the functionality of the indicator.
2. Order Block (OB)
An Order Block is identified when price creates a swing high or swing low followed by a directional move that closes beyond the open of the opposing candle(s) structure.
2.1. For bearish Order Blocks:
Price must form a confirmed swing high (higher than surrounding candles).
A subsequent bearish candle must close below the open of the bullish candle(s) that created the swing high.
2.2. For bullish Order Blocks:
Price must form a confirmed swing low (lower than surrounding candles).
A subsequent bullish candle must close above the open of the bearish candle(s) that created the swing low.
The indicator only validates Order Blocks where the structural formation meets minimum swing criteria and the confirming move demonstrates sufficient momentum beyond the identified level.
3. Change in State of Delivery (CISD)
A CISD occurs when a valid Order Block forms in the opposite direction to the previously confirmed Order Block, indicating a potential shift in market structure.
3.1. Formation criteria:
A bullish CISD forms when a valid bullish Order Block is detected after the most recent confirmed structure was a bearish Order Block.
A bearish CISD forms when a valid bearish Order Block is detected after the most recent confirmed structure was a bullish Order Block.
Each CISD represents the first opposing Order Block in a sequence, distinguishing it from continuation Order Blocks that follow in the same direction.
The indicator tracks the sequence of Order Block formations to automatically classify each new structure as either a CISD (directional change) or continuation Order Block based on the preceding confirmed structure.
4. Detection Logic & Visual Management
The indicator continuously scans price action in real time, validating only those patterns that meet predefined technical thresholds. Once a structure is confirmed, it is plotted as a horizontal line extending from the origin candle’s open to the confirming close.
To maintain chart clarity, the script integrates automatic display management, limiting the number of plotted lines according to user-defined settings. Independent styling options are available for bullish and bearish structures, including colour, width, and line thickness. CISD and OB structures are styled separately to provide a clear distinction between reversal and continuation events.
Developing structures appear as dotted potential horizontal lines until they are validated, at which point they transition to solid lines. The indicator also allows users to restrict visibility of plotted lines above a selected timeframe, ensuring that higher timeframe charts remain clean and readable.
If configuration settings conflict, such as incompatible timeframe or visibility filters, the indicator displays on-chart warning messages to guide users in adjusting their setup appropriately.
The indicator supports multi-timeframe plotting capability, allowing structures identified on higher timeframes to be visualised directly on the active lower timeframe chart. This feature allows traders to observe how market structures align across multiple timeframes, providing greater confirmation of overall trend direction, reinforcing analytical confidence through cross‑timeframe confluence, and ensuring short‑term decisions remain aligned with the prevailing market context.
Traders can configure alerts to receive notifications when new CISD or OB structures are confirmed. Alerts are fully customisable via the indicator input settings and can be defined by direction (bullish/bearish) and pattern type (OB or CISD).
5. Usage Instructions
5.1. Alert Setup:
Enable "Set Alert?" toggle in indicator settings.
Configure alert preferences for specific pattern types.
On the chart, click the three dots menu beside the indicator's name or press Alt + A.
Select "Add Alert" and click “Create” to activate the alert.
Alerts trigger when new patterns are confirmed.
5.2. Display Controls:
Use "Bullish Lines" and "Bearish Lines" toggles to show/hide patterns by direction.
Adjust line quantity settings (1-25) to control how many patterns display simultaneously.
Enable “Timeframe” to apply detection logic to a higher timeframe of choice, displaying CISD and OB patterns directly on the active chart.
5.3. Visibility Filter:
Use “Show below” to limit indicator visibility to specific timeframes. When enabled, the indicator hides automatically on any timeframe equal to or higher than the selected setting.
5.4. Appearance Customisation:
Toggle “CISD” or “OB” on/off to show or hide individual pattern types.
Modify colours and line widths independently for bullish and bearish structures.
The “Show potential line” option displays developing patterns as dotted horizontal lines until confirmed.
5.5. Warning Message:
Enable “Show warning messages” to display on‑chart guidance for conflicting or invalid configurations.
Choose the preferred message box position and colour styling for readability.
6. Protected Logic & Original Design
This indicator has been developed from the ground up using proprietary algorithms and a custom structural classification logic derived from original research into Order Block and CISD identification methods. The internal mechanics, including real-time pre-confirmation logic, multi-timeframe adaptation, directional classification sequencing, and automated display management, are not based on any publicly available script or third-party resource.
7. Disclaimer
This indicator is provided for educational and analytical purposes only. It does not constitute financial advice, investment recommendations, or trading signals. All trading and investment decisions remain solely the responsibility of the user.
Trading financial instruments involves substantial risk of loss. Past performance of any trading methodology or indicator does not guarantee future results. Users should conduct their own research and consider consulting with qualified financial professionals before making trading decisions.
The indicator's pattern detection is based on technical analysis principles and should be used as part of a comprehensive trading approach. No trading tool can guarantee profitable outcomes or eliminate market risk.
By using this indicator, users acknowledge they understand these risks and accept full responsibility for their trading decisions and outcomes.

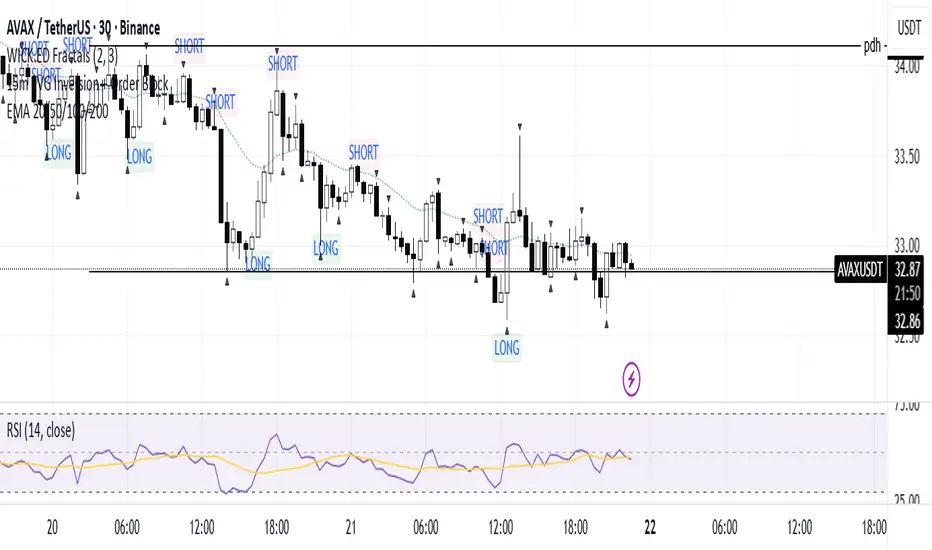
15m FVG Inversion + Order BlockThe indicator finds the inversion of the FVG 15 minutes and the order block, after which it gives an entry signal.
SMC Suite - OB . Breaker . Liquidity Sweep . FVGSMC Suite — Order Blocks • Breaker • Liquidity Sweep • FVG
What it does:
Maps institutional SMC structure (OB → Breaker flips, Liquidity Sweeps, and 3-bar FVGs) and alerts when price retests those zones with optional r ejection-wick confirmation .
Why this isn’t “just a mashup”?
This tool implements a specific interaction between four classic SMC concepts instead of only plotting them side-by-side:
1. OB → Breaker Flip (automated): When price invalidates an Order Block (OB), the script converts that zone into a Breaker of opposite bias (bullish ⇄ bearish), extends it, and uses it for retest signals.
2. Liquidity-Gated FVGs : Fair Value Gaps (3-bar imbalances) are optionally gated—they’re only drawn/used if a recent liquidity sweep occurred within a user-defined lookback.
3. Retest Engine with Rejection Filter : Entries are not whenever a zone prints. Signals fire only if price retests the zone, and (optionally) the candle shows a rejection wick ≥ X% of its range.
4. Signal Cooldown : Prevents spam by enforcing a minimum bar gap between consecutive signals.
These behaviors work together to catch the sequence many traders look for: sweep → impulse → OB/FVG → retest + rejection.
Concepts & exact rules
1) Impulsive move and swing structure
• A bar is “ impulsive ” when its range ≥ ATR × Impulsive Mult and it closes in the direction of the move.
• Swings use Pivot Length (lenSwing) on both sides (HH/LL detection). These HH/LLs are also used for sweep checks.
2) Order Blocks (OB)
• Bullish OB : last bearish candle body before an i mpulsive up-move that breaks the prior swing high . Zone = min(open, close) to low of that candle.
• Bearish OB : last bullish candle body before an impulsive down-move that breaks the prior swing low . Zone = high to max(open, close).
• Zones extend right for OB Forward Extend bars.
3) Breaker Blocks (automatic flip)
If price invalidates an OB (closes below a bullish OB’s low or above a bearish OB’s high), that OB flips into a Breaker of opposite bias:
• Invalidated bullish OB → Bearish Breaker (resistance).
• Invalidated bearish OB → Bullish Breaker (support).
Breakers get their own style/opacity and are used for separate Breaker Retest signals.
4) Liquidity Sweeps (decluttered)
• Bullish sweep : price takes prior high but closes back below it.
• Bearish sweep : price takes prior low but closes back above it.
Display can be tiny arrows (default), short non-extending lines, or hidden. Old marks auto-expire to keep the chart clean.
5) Fair Value Gaps (FVG, 3-bar)
• Bearish FVG : high < low and current high < low .
• Bullish FVG : low > high and current low > high .
• Optional gating: only create/use FVGs if a sweep occurred within ‘Recent sweep’ lookback.
6) Retest signals (what actually alerts)
A signal is true when price re-enters a zone and (optionally) the candle shows a rejection wick:
• OB Retest LONG/SHORT — same-direction retest of OB.
• Breaker LONG/SHORT — opposite-direction retest of flipped breaker.
• FVG LONG/SHORT — touch/fill of FVG with rejection.
You can require a wick ratio (e.g., bottom wick ≥ 60% of range for longs; top wick for shorts). A cooldown prevents back-to-back alerts.
How to use
1. Pick timeframe/market : Works on any symbol/TF. Many use 15m–4h intraday and 1D swing.
2. *Tune Pivot Length & Impulsive Mult:
• Smaller = more zones and quicker flips; larger = fewer but stronger.
3. Decide whether to gate FVGs with sweeps : Turn on “Require prior Liquidity Sweep” to focus on post-liquidity setups.
4. Set wick filter : Start with 0.6 (60%) for cleaner signals; lower it if too strict.
5. Style : Use the Style / Zones & Style / Breakers groups to set colors & opacity for OB, Breakers, FVGs.
6. Alerts : Add alerts on any of:
• OB Retest LONG/SHORT
• Breaker LONG/SHORT
• FVG LONG/SHORT
Choose “Once per bar close” to avoid intrabar noise.
Inputs (key)
• Swing Pivot Length — swing sensitivity for HH/LL and sweeps.
• Impulsive Move (ATR ×) — defines the impulse that validates OBs.
• OB/FVG Forward Extend — how long zones project.
• Require prior Liquidity Sweep — gate FVG creation/usage.
• Rejection Wick ≥ % — confirmation filter for retests.
• Signal Cooldown (bars) — throttles repeated alerts.
• Display options for sweep marks — arrows vs short lines vs hidden.
• Full color/opacity controls — independent palettes for OB, Breakers, and FVGs (fills & borders).
What’s original here
• Automatic OB → Breaker conversion with separate retest logic.
• Liquidity-conditioned FVGs (FVGs can be required to follow a recent sweep).
• Unified retest engine with wick-ratio confirmation + cooldown.
• Decluttered liquidity visualization (caps, expiry, and non-extending lines).
• Complete styling controls for zone types (fills & borders), plus matching signal label colors.
🔹 Notes
• This script is invite-only.
• It is designed for educational and discretionary trading use, not as an autotrader.
• No performance guarantees are implied — always test on multiple markets and timeframes.

True Order Block (OB) True Order Block (OB)
This script automatically detects and plots Order Blocks (OBs) based on the presence of Fair Value Gaps (FVGs).
Only Order Blocks are displayed on the chart.
🔎 How it works
The script looks for Fair Value Gaps (FVGs) according to a relaxed 3-candle definition.
Once an FVG is detected:
For a Bullish FVG → the last bearish candle before the gap is marked as the Bullish Order Block.
For a Bearish FVG → the last bullish candle before the gap is marked as the Bearish Order Block.
OBs are extended into the future until price either:
mitigates the zone (optional auto-removal), or
the number of live OBs exceeds the user’s maximum (FIFO cleanup).
⚙️ User settings
Draw Order Blocks (enable/disable plotting)
Minimum OB length (how far each zone extends initially)
Remove OB after violation (auto delete invalidated zones)
Max active OBs (limit on displayed zones for clarity)
Bullish/Bearish OB colors
✅ Key features
Fully automated OB detection
No clutter – only OBs are plotted (FVG logic hidden in the background)
Smart cleanup: mitigated zones are removed automatically
Customizable colors & limits
⚠️ Notes
This tool is designed for educational and analytical purposes only.
It does not generate trade signals.
Always combine with your own strategy, market context, and risk management.

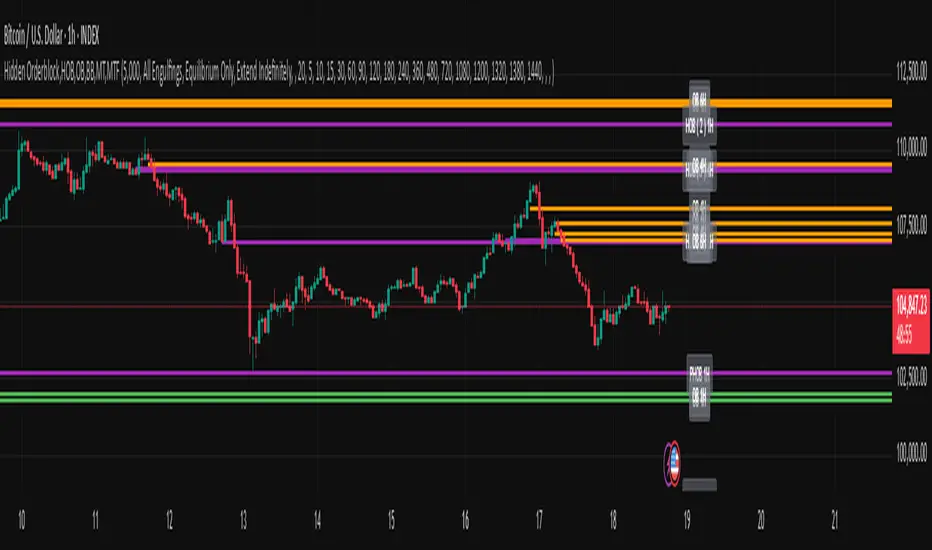
Hidden Orderblock,HOB,OB,BB,MT,MTF Hidden Order Block & Breaker Block (HOB/BB) Multi-Timeframe Analysis
A powerful tool for Smart Money traders and ICT-style practitioners seeking precision, confluence, and clean visual execution. This indicator identifies institutional price zones such as Hidden Order Blocks (HOB), Breaker Blocks (BB), Partial Hidden Order Blocks (PHOB), and traditional Order Blocks (OB)—all across multiple timeframes with minimal chart clutter.
✅ Key Features
1. Hidden Order Block (HOB) Detection
Identifies non-obvious order blocks often hidden within price action.
Requires the EQ (Equilibrium) of the block to pass through at least one Fair Value Gap (FVG).
Invalidation Rule: If price touches the EQ and then closes beyond it (depending on structure), the HOB is invalidated.
2. Breaker Block (BB) Detection
Highlights zones where price made a liquidity grab followed by a strong reversal.
Useful for anticipating support/resistance flips and high-probability reaction areas.
3. Partial Hidden Order Block (PHOB) Detection
A variation of HOBs where price only partially touches the EQ.
Often acts as an early warning zone for reversals or continuation.
Less strict than HOBs, but still institutionally relevant.
4. Traditional Order Block (OB) Detection
Identifies bullish/bearish OBs based on engulfing patterns and displacement.
Marks only the body of the engulfing candle, with the EQ line acting as a key validation/invalidation level.
Once the EQ is touched, the OB is considered invalidated.
5. Engulfing Filter Engine
Customizable logic for OB qualification.
“Easy Engulfing Mode” simplifies detection for newer traders or faster workflow.
Fine-tune aggressiveness and visual clarity with user-defined settings.
6. Multi-Timeframe (MTF) Visualization
Overlay OBs, HOBs, BBs, and PHOBs from higher timeframes (e.g., 4H, 1D) on lower timeframes (15m, 1H).
Enhances top-down confluence without switching charts.
Keeps the visual experience clean and intuitive.
7. Minimalist Visual Design
Only the zone boundaries and EQ lines are displayed.
No extra noise—perfect for both scalpers and swing traders.
Dynamic label positioning and styling for improved chart aesthetics.
8. Performance-Optimized Code
Lightweight, real-time rendering.
Designed for responsiveness—even on lower timeframes with dense historical data.
⚙️ How It Works (Simplified Logic)
Order Block Detection:
Scans for engulfing candles that show displacement.
Defines the OB as the body of the engulfing candle.
EQ line is marked and projected forward until invalidated.
Hidden Order Block Logic:
Starts from a traditional OB, but requires the EQ to pass through at least one FVG.
Upon a close beyond the EQ in the opposite direction, the HOB is invalidated.
PHOB Logic:
Similar to HOBs, but allows partial touches of the EQ before reacting.
Breaker Block Logic:
Identifies liquidity sweeps followed by impulsive moves.
Marks these zones as BBs for potential reaction areas.
📈 Use Cases
Detect institutional price zones with high precision.
Simplify decision-making with visual EQs and MTF overlays.
Integrate seamlessly into:
Smart Money Concepts (SMC)
ICT-style trading
Wyckoff methodology
Discretionary zone-to-zone strategies
🧠 Definitions Summary
OB (Order Block):
Engulfed candle body; EQ is the midpoint of the body. Invalid once EQ is touched.
HOB (Hidden Order Block):
Like OB, but EQ must pass through at least one FVG.
Invalidated when a candle touches EQ and closes beyond it.
PHOB (Partial Hidden Order Block):
Like HOB, but allows partial touch of the EQ to remain valid.
FVG + OB + RSI Divergence + Volume Spikes🧠 FVG + OB + RSI Divergence + Volume Spikes – Market Structure Confluence Tool
This all-in-one indicator brings together four powerful market concepts into a single script designed to help traders identify high-probability trade setups with precision and clarity:
🔍 What It Does
✅ Fair Value Gaps (FVG)
Highlights inefficiencies in price action, showing where the market may return to “rebalance.”
✅ Order Blocks (OB)
Marks key institutional footprints — bullish and bearish order blocks based on engulfing candle structures.
✅ RSI Divergence
Detects both bullish and bearish divergences between price and RSI, signaling potential reversals.
✅ Volume Spikes
Flags bars where volume significantly exceeds the average — a common footprint of smart money.
🎯 How to Use
Use this tool to spot confluences between price inefficiencies (FVG), key reversal zones (OB), momentum shifts (RSI Divergence), and institutional interest (Volume Spikes). The best setups often occur when multiple signals align — especially at key support/resistance or trend zones.
⚙️ Inputs
RSI length (for divergence)
Volume spike sensitivity (multiplier)
Lookback for Order Blocks and FVGs
⚠️ Notes
This is a non-repainting tool.
Ideal for price action, SMC, ICT, and order flow traders.
Combine with your existing strategy and higher time frame bias for best results.

UntouchedIBOB [DTMM]UntouchedIBOB - Indicator for TradingView
What does this indicator do?
The UntouchedIBOB indicator helps you identify special candlestick patterns on your chart: Inside Bars (IB) and Outside Bars (OB). These patterns can provide important signals for your trading decisions.
The two most important patterns:
Outside Bar (OB) - A candle whose high is higher and low is lower than the previous candle. It completely "engulfs" the previous candle.
Inside Bar (IB) - A candle whose high is lower and low is higher than the previous candle. It moves completely "inside" the previous candle.
Tested and recommended by professionals:
We are the main provider of trading indicators for Oliver Klemm , one of the most renowned traders in Germany and the entire DACH region. Our indicators are used daily in real-money trading by successful professional traders and are continuously improved. You benefit from the same professional technology that is used and recommended by leading market experts.
Main features:
Colored candles: Inside and Outside Bars are displayed in different colors
Lines: Shows horizontal lines at the midpoints of IB/OB that remain active until the price breaks through them
Arrows: Optional arrows above/below the IB/OB for better visibility
Alerts: Can notify you when new Inside or Outside Bars form
Special feature:
The indicator not only shows where IB/OBs are located but also tracks which ones are still "untouched" - meaning the price has not broken through that level again. This can be particularly valuable as untouched IB/OB levels often represent important support and resistance areas.
Customization options:
Enable/disable lines, arrows, and areas
Adjust colors for all elements
Arrow size (tiny, small, normal, large)
Choose between solid or dashed lines
Alert functions for new Inside and Outs
ide Bars
Use this indicator to more easily identify important candlestick patterns and identify potential trend reversals or continuations early.
-----------------------------------------------------------------
UntouchedIBOB - Indikator für TradingView
Was macht dieser Indikator?
Der UntouchedIBOB-Indikator hilft Ihnen, spezielle Kerzenmuster im Chart zu erkennen: Inside Bars (IB) und Outside Bars (OB). Diese Muster können wichtige Signale für Ihre Trading-Entscheidungen sein.
Die zwei wichtigsten Muster:
Outside Bar (OB) - Eine Kerze, deren Hoch höher und deren Tief tiefer ist als die vorherige Kerze. Sie "umschließt" also die vorherige Kerze vollständig.
Inside Bar (IB) - Eine Kerze, deren Hoch niedriger und deren Tief höher ist als die vorherige Kerze. Sie bewegt sich also komplett "innerhalb" der vorherigen Kerze.
Von Profis getestet und empfohlen:
Wir sind der Hauptlieferant von Trading-Indikatoren für Oliver Klemm , einen der bekanntesten Trader Deutschlands und der gesamten DACH-Region. Unsere Indikatoren werden von erfolgreichen Profi-Tradern täglich im Echtgeld-Handel eingesetzt und kontinuierlich verbessert. Sie profitieren von der gleichen professionellen Technologie, die von führenden Marktexperten genutzt und empfohlen wird.
Hauptfunktionen:
Farbige Kerzen: Inside und Outside Bars werden in verschiedenen Farben dargestellt
Linien: Zeigt horizontale Linien an den Mittelpunkten der IB/OB, die aktiv bleiben bis der Preis sie durchbricht
Pfeile: Optionale Pfeile über/unter den IB/OB für bessere Sichtbarkeit
Alarme: Kann Sie benachrichtigen, wenn neue Inside oder Outside Bars entstehen
Besonderheit:
Der Indikator zeigt nicht nur an, wo sich IB/OBs befinden, sondern verfolgt auch, welche noch "unberührt" sind - das heißt, der Preis hat das Level noch nicht wieder durchbrochen. Dies kann besonders wertvoll sein, da unberührte IB/OB-Levels oft wichtige Unterstützungs- und Widerstandsbereiche darstellen.
Einstellungsmöglichkeiten:
Ein-/Ausschalten von Linien, Pfeilen und Bereichen
Anpassung der Farben für alle Elemente
Wahl zwischen durchgezogenen oder gestrichelten Linien
Alarmfunktionen für neue Inside und Outside Bars
Nutzen Sie diesen Indikator, um wichtige Kerzenmuster leichter zu erkennen und potenzielle Trendwechsel oder Fortsetzungen frühzeitig zu identifizieren.

MTF OB Supply Demand ZonesHello everyone,
This exceptional indicator provides you with visual representations of bullish and bearish order blocks or supply and demand zones across multiple timeframes. In simple terms, bullish order blocks are represented by a small red candle followed by a large red candle, while bearish order blocks are depicted as a small green candle followed by a large red candle. Supply and demand zones are drawn by using order blocks.
Features:
Display order blocks from up to three different timeframes.
Customize the maximum number of boxes shown and the colors of the zones.
Choose from three different modes: OB (Order Block), Extended OB, and Supply/Demand.
Mode Descriptions:
OB: Includes the body of the candle.
Extended OB: Encompasses the body and wick of the candle.
Supply/Demand: Covers the body, wick, and half the body of the large candle.
Usage:
Ensure that charts 2 and 3 are set to a higher timeframe. For modes 2 and 3, it’s recommended to reduce the maximum number of boxes shown. The zones or boxes are transparent, allowing for overlap. This feature aids in identifying reversal zones or confirmed zones. The more intense the color, the stronger the confirmation. If a green zone overlaps a red zone (or vice versa), it signifies a reversal zone.
Thank you for checking out this indicator!
---
Additional Information:
Order blocks refer to specific price areas where large market participants, such as institutional traders, have previously placed significant buy or sell orders. These clusters of orders can impact price movement, liquidity, and market sentiment.
Order blocks are a strategic approach to identifying key levels of support and resistance based on the behavior of institutional traders. These key levels are then utilized as entry or exit points for trades.
An order block is an area where there has been a large concentration of limit orders awaiting execution. These blocks are identified on a chart by observing previous price action and pinpointing areas where the price experienced significant movement or abrupt changes in direction.
Order blocks are used in the following popular trading philosophies:
Smart Money Concepts (SMC)
Inner Circle Trading (ICT)
Price Action
---
Credits to: @AGFXTRADING

Displacement Order Blocks ~ DOB [Liquidity_Pro]Displacement Order Blocks (DOB)
This indicator shows order blocks with displacement (FVG required) and leans heavily on ICT’s generous and insightful teachings to define midlines for FVG, IFVG, and order blocks. The market structure definitions follow TradingHub’s (TH) rules filtering out inside bars.
It offers alerts for price in order block, liquidity sweep, break of structure (BOS), change of character (CHoCH), and inducement (IDM).
The TH model was chosen because it's programmatic allowing clear structure definitions that allow us to mark inducements (S/O to @albatherium for publishing the first TH market structure indicator).
TH’s Single Candle Order Block (SCOB) rules have also been helpful in refining order block definition, for example in the Transfer case. ICT fans will see when back testing this, that it moves the focus closer to the FVG.
In developing this indicator, we've tried to offer great aesthetic flexibility, to keep the chart uncluttered and to avoid exceeding Trading View’s limitations on boxes and lines. It's also configured to work reasonably well on both light and dark background charts:
We hope this indicator can serve as a teaching tool for ICT’s price action insights and SMC market structure concepts. For this, we've included optional labels for various order block types:
I = inside bar. The bars that follow the order block have been ignored – you will see the number of ignored bars shown after a hyphen. The idea is that inside bars fall in the shadow of a more important candle and can’t be relied on for defining a trade.
S = standard case. The order block candle takes liquidity from the previous candle and is followed immediately after by an FVG on the next candle. This differs technically from the ICT “last down-close/last up-close” order block concept. In practice, this choice has very little impact on ICT trading, because the ICT trader is entering on the FVG anyway.
T = transfer case. This is an order block that has been transferred from the candle that takes liquidity to the candle just prior to the FVG. When you back test this, you will see it is a high probability choice.
TZ = tweezer. This is an option you can turn off that fills a hole in TH teachings. It bypasses the requirement for an order block to take liquidity from the previous candle in the case of equal h/ls. The result is that you will find 2 candle order blocks with equal highs and lows (also known as tweezer tops/bottoms) show on your chart. You will note that every tweezer is a wick on a higher timeframe.
W = wick. this is a big wick candle that we call an order block without requiring an FVG. The presumption is that the displacement is contained within the wick itself on a lower timeframe.
* Asterisk denotes an extreme order block.
Finally, we trade with this indicator (using it together with our Daye Quarterly Theory ~ DQT free indicator, taking trades when price reaches an extreme FVG or order block during a Q2 manipulation).
We will continue developing it along with other indicators we have not yet published. So please boost if you like this and follow us for updates. Also please let us know what new features you would like to see.
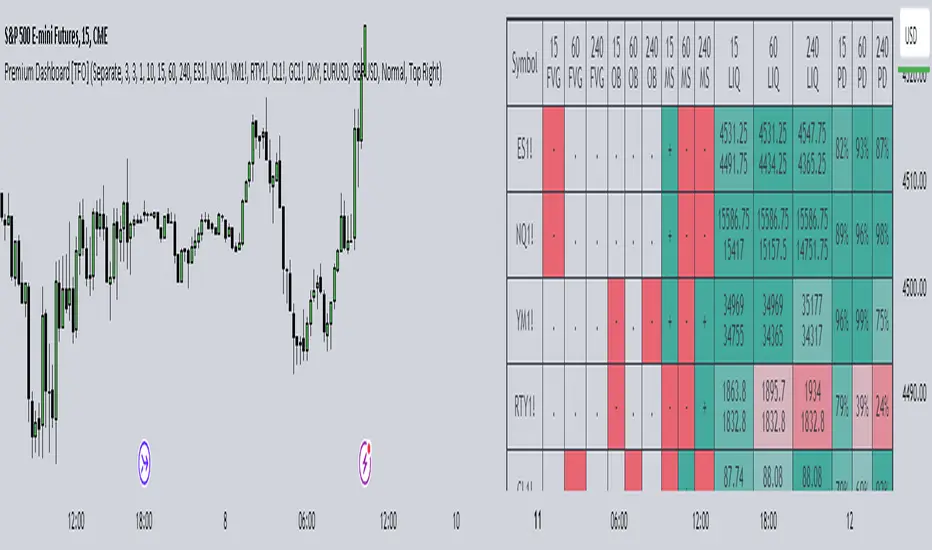
Premium Dashboard [TFO]The purpose of this indicator is to serve as a scanner/dashboard for several symbols across multiple timeframes. At the time of release, the scanner looks for the following criteria on all selected timeframes:
- Whether price is in a Fair Value Gap (FVG)
- Whether price is in an Order Block (OB)
- Current Market Structure
- Nearest Liquidity Pivots
- Proximity to said Liquidity Pivots
For FVGs, the user selects a Displacement Strength to validate FVGs from the selected timeframes; larger values require greater displacement. The table will indicate whether price is presently trading in a valid bullish FVG, bearish FVG, or none.
With OBs, the user selects a similar Displacement Strength to validate OBs from the selected timeframes. Again, larger values require greater displacement to validate an OB. The table will indicate whether price is presently trading in a bullish OB, bearish OB, or none.
For Market Structure, the table will indicate whether the current structure is bullish or bearish on each respective timeframe. A pivot strength parameter is used to determine which swing highs and swing lows warrant valid Market Structure Shifts (reversals) or Breaks of Structure (continuations).
The Liquidity section of the dashboard displays the nearest Buyside and Sellside Liquidity (major highs and lows) from each respective timeframe. A similar pivot strength parameter is used to determine how "strong" the highs and lows must be in order to be considered valid.
The Premium / Discount section offers an alternative view of the nearest Liquidity Pivots, where it will instead display a percent value to describe how close price is to Buyside or Sellside Liquidity. Values approaching 100% imply price is trading close to the nearest Buyside Liquidity, while values approaching 0% imply price is trading close to Sellside Liquidity.
Users can also choose to show any of the above features on their current chart: FVGs, OBs, cumulative Market Structure, and Liquidity, all from the various selected timeframes.
ICT Daily BiasThis indicator is based on ICT's teaching - Daily Bias. Indicator tries to predict which direction (bias) the price will move in the near future and it can tell you in which direction should you take trades on the lower timeframe (buy or sell). It works on every timeframe but best to use on 1D timeframe. It can also show historical Daily Biases. Daily Bias can be BUY, SELL or NEUTRAL. If there is NEUTRAL Daily Bias then you should not take any trade because following price direction is not clear until the Daily Bias changes to BUY or SELL.
Current Daily Bias is shown in the right bottom corner.
Daily Bias can be calculated by 2 types: Previous H/L or Previous Swing H/L.
Previous H/L:
This calculation is based on previous H/L. If actual candle reaches previous high (red line by default) or low (green line by default) with wick then price should reverse into opposite direction. If actual candle closes with body above previous high (green line by default) or below previous low (red line by default) then price should continue in current direction. There are also colorful arrows showing the following daily bias based on previous candle.
Previous Swing H/L:
This calculation is based on previous untested swing H/L. If actual candle reaches previous untested swing high (red line by default) or low (green line by default) with wick then price should reverse into opposite direction. If actual candle closes with body above previous untested swing high (green line by default) or below previous untested swing low (red line by default) then price should continue in current direction. Lookleft and lookright period (default: 3) for swing H/L can be set in indicator settings. This period tells you how many candles left and right from the swing H/L need to be higher (swing low) or lower (swing high). Previous tested swing H/L are labeled by colorful (yellow by default) diamonds. There are also colorful arrows showing the following daily bias based on previous tested swing H/L.
All settings of this indicator should be self-explanatory and some of them have tooltips for better understanding.

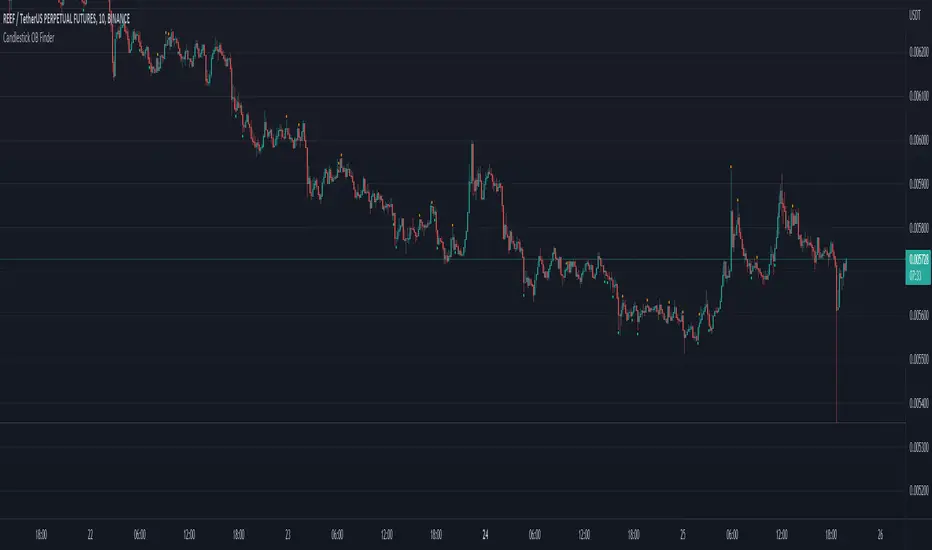
Candlestick OB FinderIntroduction
Hello, this here is a non-repainting candlestick indicator which is able to detect OB looking candlestick formations.
Usage
It can be used to confirm entries, but be aware that it produces a lot of false signals.
Somehow the swings tend to reverse at these points.
I recommend the 10–15 minutes timeframe.
I hope you enjoy this small indicator. :)
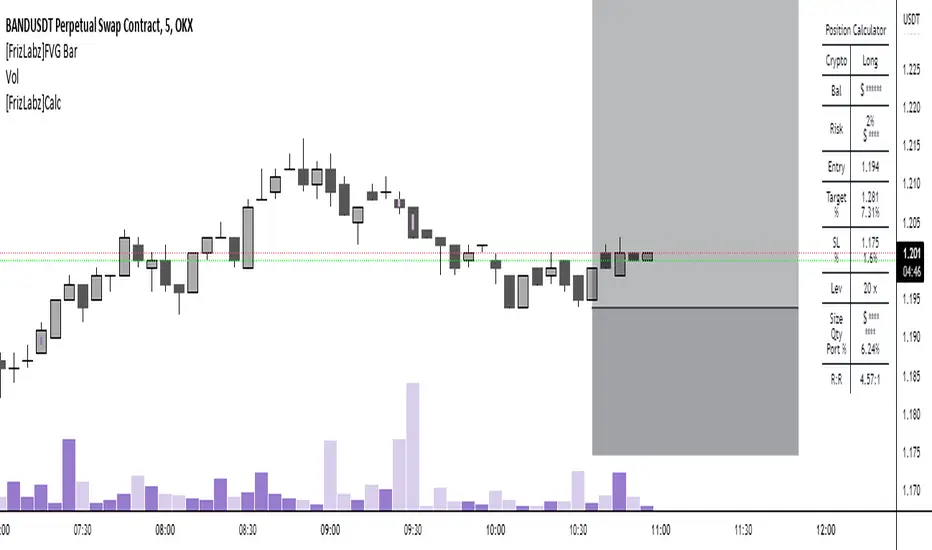
[FrizLabz]FVG Bar
For those of you that like to keep your charts nice and tidy for your Technical Analysis!
FVG = Fair Value Gap
Fair Value Gaps are when impulse movements create an imbalance in price leaving unfilled orders.. they are popular because after one is created we often observe price return to fill these unfilled orders
3 candles make a FVG
When the high/low of most recent candle is lower/high than the low/high of the bar before last
Similar to my other FVG indicator but this one allows you to delete Filled FVGs and have them adjust when filled
Uses a line whose x1 and x2 are on the FVG bar and adjust the size of the FVG with line width because line width on line.new()s doesnt have a cap on line width like plot()s do
Not much too it I made this because a few people were asking if they could delete the FVG after it was Mitigated and since my other uses plots it wasnt possible
so I hope this works for those who were asking about it
hope you enjoy please let me know if you have an idea or find a bug,
Thank You! -
Market Structure Break & Order Block by EmreKbThis indicator shows the market structure break (msb) and order blocks (ob). Msb occurs after the breakout old high when the price make lower lows or occurs after the breakout old low when the price make higher highs. OB occurs after the msb, ob is the last bullish candle before high if msb is bearish but if the msb is bullish then ob is the last bearish candle before low.
Zigzag Lenght - A number for the zigzag calculation
Show Zigzag - Show/Hide Zigzag lines
Fib Factor - Fib level for the breakout confirmation. For example if new high larger than old high to low fib 1+fib_factor when the down trend then it's a breakout.

Order Blocks Finder By DrewAn Order Block is a technical analysis technique that tracks the accumulation of orders (when bullish) and distribution of orders (when bearish) of banks and institutional traders. In other words, it is an area or an indication of where big institutions would pile up their orders to enter the market – their order blocks.
If you know how order blocks works and know how to trade via order blocks, then this indicator will help you in finding order blocks by itself which you don't need to worry about finding any.
For settings, I personally use Box Length as 10 and Box Transparency 80. Hope this helps! Feel free to drop a comment for any questions :)
Would appreciate you all if you can LIKE and FAVOURITE this indicator.
