On Balance Volume with candlesWhen it comes with On balance volume we have only line Indicator
It's difficult to identify what happening
So this indicator will help to identify what happening in On Balance Volume with Candle stick pattern
You can add SMA as well as EMA in code accourding to your strategy
Thank you
مؤشر OBV

KoadzOscillatorOscillator based on PVT and OBV.
Important levels to buy :
< 30, 40 for OBV
< 30 for PVT

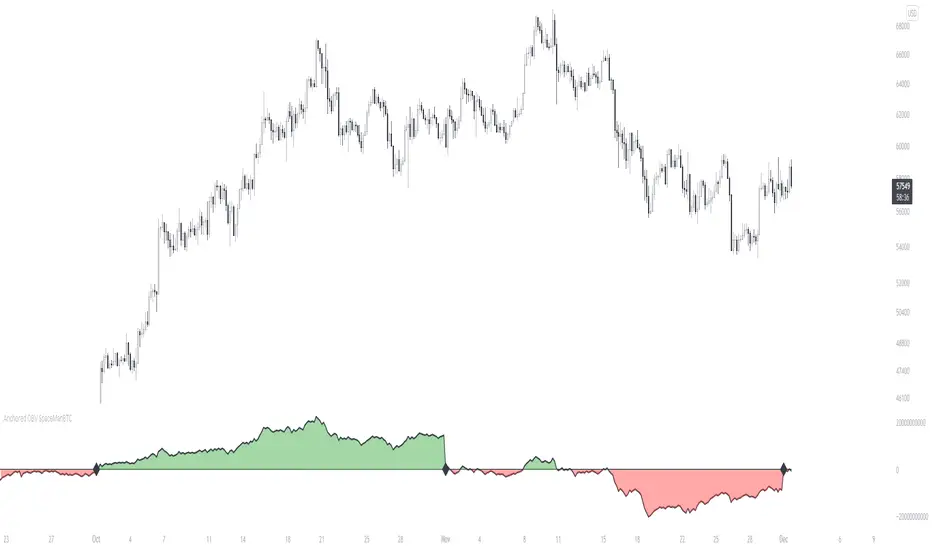
Anchored OBV SpaceManBTC Anchored OBV SpaceManBTC
The On Balance Volume indicator (OBV) is used in technical analysis to measure buying and selling pressure.
On Balance volume is primarily used to confirm or identify overall price trends or to anticipate price movements after divergences.
Anchored On Balance Volume unlike traditional OBV resets on your specified sessions: D, W, M, 3M, 4M, 6M, 1Y.
The actionable data is more useful HTF to see a potential long term trend change relative to the session reset chosen.
User can choose to disable highlightable session reset.
Recommended settings:
Daily tf with 3Month session pretty useful for the run so far. But please experiment away and share your results!
ToDo:
Non Reset Functionality,
Perhaps more timeframes
Position size FX and CryptoThis indicator I am using to calculate the position size to order for Forex and Crypto Future

Stochastic Spread AnalyzerA comparative version of the previously published Stochastic Structure Analyzer. It incorporates the 3-TF stochastics against both price and OBV values of the spread.

+ Breadth & Volumenote* If you've used my "+ Rate of Change Indicator", I am updating that without the OBV, which has been moved here. Just an FYI.
This "indicator" is basically a variety of indicators that measure volume, or accumulation/distribution. There's a bit of a story about how this came about but
it's not that interesting, so I'll spare you.
Indicators from which you may choose here are On Balance Volume (OBV), Money Flow Index (MFI), Chaikin Money Flow (CMF), Chaikin Oscillator, and Positive & Negative Net Volume.
I'll give a brief overview of these below, and if you want to educate yourself further on them you may. There are many web resources for that.
Most people are probably familiar with OBV. It's one of the more commonly used volume indicators, especially in the crypto crowd (at least amongst those traders I follow). It's basically a cumulative (doesn't oscillate around a midpoint) momentum indicator that measures volume of the current period versus volume of the previous period and adds it if price closed higher, but subtracts it if price closes lower. It's another way of using volume to confirm trend.
The MFI is a momentum indicator that measures the flow of money into and out of an asset over some period of time (user input). It's calculated using the RSI, so it can be used similarly to RSI (divergences, overbought, oversold, etc.), but of course unlike the RSI it's calculated primarily using volume and comparing the most recent candle close to the previous one (similar to OBV).
CMF is a volume-weighted average of accumulation and distribution over a some period of time (typically 21). It's a way of measuring accumulation versus
distribution in an asset, and oscillates around a zero line. You would use it similarly to any other oscillator, in that you can look for divergences, and general positive or negative momentum.
Chaikin Oscillator is basically a MACD (without signal line) of the accumulation and distribution index (or line--which is somehow different than simply accumulation and distribution). I haven't looked into these differences deeply, but if you look below at the calculations, and substituted 'ad' for 'accdist' you get very different readings. I actually did that, and what it looks like it would do is turn the actual Oscillator into a MACD signal line. So, by substituting 'ad' for 'accdist' (or the accumulation/distribution index) you produce a signal line of the Chaikin Oscillator.
Anyway, all that confusion out of the way, as I said, it's a MACD on the accumulation and distribution index, therefore it is another zero line oscillator, and similarly to CMF, it's a way of measuring price movements in the chart versus a/d. The zero line isn't just any old zero line, however, it is actually the accumulation distribution line. I've made an OBV version of this by substituting the OBV for AD, so if you prefer OBV maybe you will like that.
Pos. & Neg Net Volume is actually an indicator I had seen made by RafaelZioni. It basically takes net volume, calculates a cumulative of that, then subtracts a moving average of some period from the cumulative net volume in order to create a volume oscillator. Use it like the other oscillators!
Added Donchian Channels, moving averages, Bollinger Bands, colored everything, and alerts.
Enjoy!
Below I will post images with the different indicators, everything on default settings (except for lookback period, which I have adjusted to my personal preferences).
Above is an image with the MFI being compared to the RSI since they are very similar (MFI being basically a volume derivative of the RSI).
Chaikin Money Flow set to lookback of 13. You could probably extend that a bit if you wanted to smooth the line more.
Chaikin Oscillator and Chaikin Oscillator of OBV, with a zoomed in look below, to see the differences more clearly.
CO and COBV closer look.
Positive & Negative Net Volume.

On Balance Volume EMA TrendI have just taken the On Balance Volume and added an EMA with a little color to visualize the current trend.

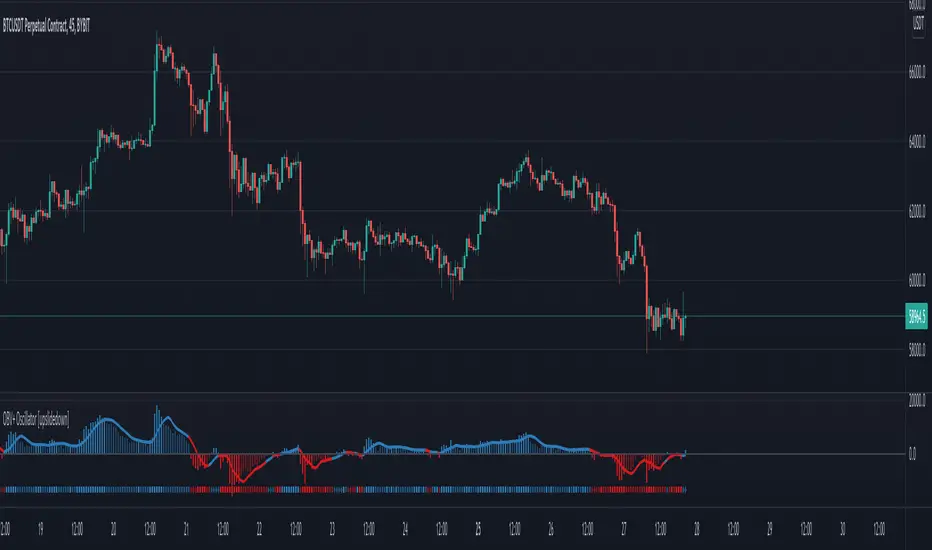
OBV+ Oscillator [upslidedown]This is the classic OBV (On-Balance Volume) formula modified to evaluate OBV state based on a moving average. OBV is a momentum indicator that uses volume flow to predict changes in asset price. While I am not an expert on OBV, my thesis for the logic conditions I have implemented follow fairly standard confirmation/invalidation logic used in many other indicators. I use the below icons across many of my scripts to evaluate bar state and to help confirm current conditions in a trade.
Key:
🟦 = safe bullish conditions
▩ (transparent blue) = bullish warning (decreasing conditions)
🔹 = reversal condition (early indication of bullish behavior or simply chop)
🟥 = safe bearish conditions
▩ (transparent red) = bearish warning (decreasing conditions)
♦️ = reversal condition (early indication of bearish behavior or simply chop)
If you have questions about how to use this, want to offer ❤️, or have ideas for improvement feel free to PM me.
CDC DivergencesA handy little indicator to help identify different kinds of convergences/divergences
The indicator compares price movements with the momentum and volume movements, Hidden divergences are left out, at least in the first version, because I wanted this indicator to be as simple as possible.
The divergences are shown with labels, user can change the momentum/volume indicator used to identify divergences in the settings.

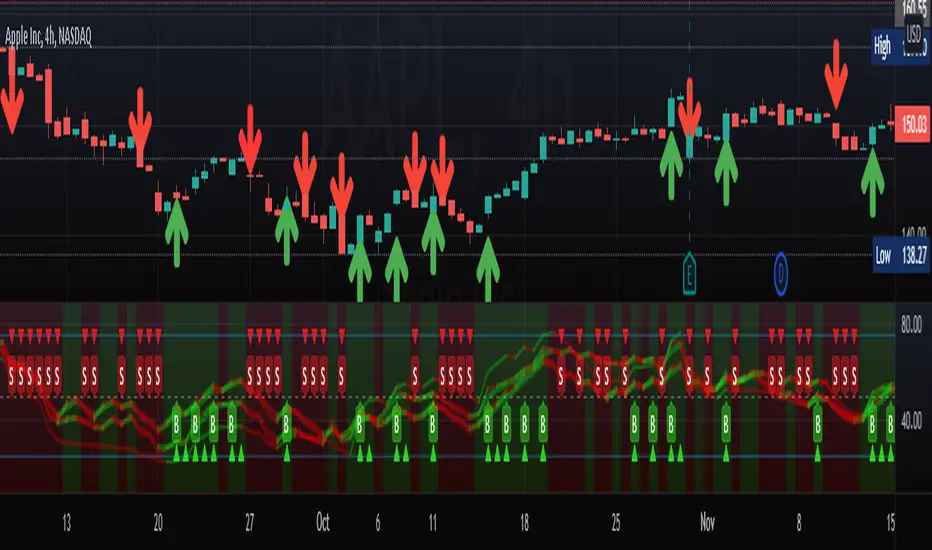
M.Right_ OBV / Volume Smoothed RSI & 3 RSI EMAsFirst, I'd like to thank all those coders who've inspired me to learn and code my own indicator. This is the result of tireless hours of work learning to code and tweaking until everything fits exactly what I was looking for. After using it for a while and seeing the benefits personally, I figured now might be a good time to share with everyone while we are in such great market volatility , maybe I can save you some losses.
Basically, my indicator is meant to use RSI, Volume, and Volatility to show where oversold and overbought levels are, but also good times to buy and alerts.
I've tried to make my indicators as customizable as possible with all the bells and whistles you'd expect, but to have Proprietary calculations under the hood that you probably won't find anywhere else.
This indicator is a great pair with my Top and Bottom Finder.
Features:
Works on all timeframes.
Alerts.
Background highlights.
Buy/Sell signals and arrows (with the option to remove them).
Let me know if you have any questions, and enjoy.
Cheers,
Mike
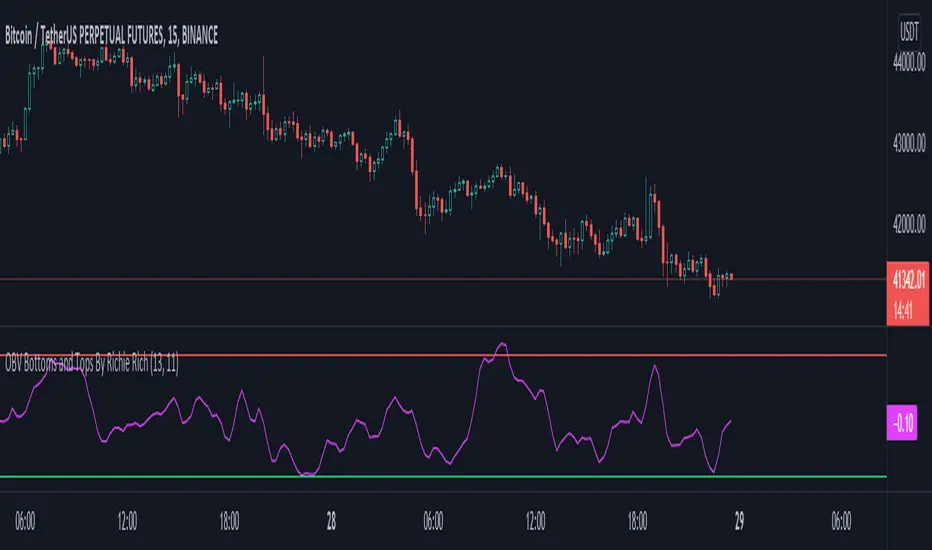
OBV Bottoms and Tops by Richie RichHello and Welcome to Trading With Richie Rich's Indicator Suite!
This Indicator is known as OBV Bottoms and Tops Finder because it has been consistent with the bottoms and tops to the extreme levels possible with the help of On Balance Volume (OBV) which can be used for scalping as well Investing.
How to Use OBV Bottoms and Tops Finder Indicator?
General Idea - Everyone in trading is familiar with On Balance Volume (OBV) and it is mainly used to calculate Divergences and catch breakouts and breakdowns. But is it possible to catch the bottom or top price of an asset with the help of On Balance Volume? Typically with the normal OBV it is not but with this one.... Yes, it is Now! We'll learn it soon enough.
- After getting access to the indicator you must apply it to your chart and Favorite it so that it becomes handy all the time.
- There are 2 line namely,
1. The Overbought Line (color coded Red) - which helps you to know when the asset has been highly overbought in short term and is due for a correction short term.
2. The Oversold Line (color coded Green) - this helps you know when the price of asset has been really highly oversold and is highly due for a bounce to its main interest
levels.
- Long / Buy Setup - Wait for the main oscillator to fall back below the oversold level ,i.e, -1 and wait for the candle close to always verify it. Once it is in the region of below -1 you should either start to DCA (Dollar Cost Averaging) in a Trade or if you believe the asset is due for a more dump in coming minutes, wait for the indicator to bottom out in the -1.2 to -1.5 region, which will be your ultimate bottom to long. Once you have entered the trade which will basically (might be) the bottom for short term - mid term you should then start focusing on your Risk Reward Ratio. For Scalpers, in my opinion it is enough to target 1-2% on each trade and then flip and rotate.
If you are with a large sized portfolio and are basically an investor rather than a Trader. You should switch the chart to 4hour chart and apply the indicator and just basically wait for the Trade God and the Extreme Top and Bottom Finder to completely bottom out. Once they both are at there lowest you might have entered the Bottom once again at start focusing on your Risk Reward Ratio. After Bottoming out on a 4hour chart, i have backtested to find out that the asset price usually rises to 10-20% a minimum that will be your Take Profits Zone!
- Short / Sell Setup - Wait for the main oscillator to rise above below the overbought level ,i.e, +1 and wait for the candle close to always verify it. Once it is in the region of above +1 you should either start to DCA (Dollar Cost Averaging) in a Trade or if you believe the asset is due for a more pump in coming minutes, wait for the indicator to Top out in the +1.2 to +1.5 region, which will be your ultimate Top to short. Once you have entered the trade which will basically (might be) the Top for short term - mid term should then start focusing on your Risk Reward Ratio. For Scalpers, in my opinion it is enough to target 1-2% on each trade and then flip and rotate.
If you are with a large sized portfolio switch to low leverage mode and switch the chart to 4hour chart and apply the indicator and just basically wait for the Trade God and the Extreme Top and Bottom Finder to completely Top out or show Bearish Divergence after topping out once. Once they both are at there highest or have started to show bearish divergences you might have entered the Top once again at start focusing on your Risk Reward Ratio. After Topping out on a 4hour chart, i have backtested to find out that the asset price usually fall up to 10-20% a minimum that will be your Take Profits Zone!
This really comes in handy when paired with my Trade God/Scalp God and the Extreme Top and Bottom Finder indicator Setup!
All the above examples are backtested and can be checked via applying the indicator on the chart!
OBV RSI TunTuneCombination of OBV and RSI.
Use as RSI like normal way. You can add another indicator as Bollinger Band for more power .

On Balance VolumeEnhanced the original OBV (On Balance Volume) indicator:
- Draw max lines of OBV in the last 30 candles so that we can notice the trend, as well as divergences easier.
- If you use fiat as base currency (USDT in cryptocurrency for example), we can display the OBV in fiat, so that we can compare total trading volume across a list of symbols to find healthy symbols to trade easier.

On-Balance Volume Oscillator with Divergence and PivotsThis is On-Balance Volume recalculated to be an Oscillator, a Divergence hunter was added, also Pivot Points and Alerts.
On-Balance Volume, or OBV is considered a "leading indicator" - in contrast to a "lagging indicator" just as Moving Averages it does not show a confirmation what already happened, but it shows what can happen in the future. For example: The chart is climbing while the OBV oscillator is slowly declining, gets weaker and weaker, maybe even prints bearish divergences? That means that a reversal might be occurring soon. Leading indicators are best paired with Stop and Resistance Lines, general Trendlines, Fib Retracements etc...Your chart is approaching a very important Resistance Trendline but the OBV shows a very positive signal? That means there is a high probability that the Resistance is going to be pushed though and becomes Support in the future.
What are those circles?
-These are Divergences. Red for Regular-Bearish. Orange for Hidden-Bearish. Green for Regular-Bullish. Aqua for Hidden-Bullish.
What are those triangles?
- These are Pivots. They show when the OBV oscillator might reverse, this is important to know because many times the price action follows this move.
Please keep in mind that this indicator is a tool and not a strategy, do not blindly trade signals, do your own research first! Use this indicator in conjunction with other indicators to get multiple confirmations.

OBV + Simple Moving AverageThird time is a charm. On Balance Volume with simple moving average. Hopefully we don't get this kicked back to us.

On Balance Volume - Color Packed Patch'emOBV is provided as a built-in by TradingView.
This contribution grew out of reading about trend discovery, and since the library kept on this end was lacking in a volume-centric indicator, it looked like a good time to play around.
This approach isn't all that much different than many others with the possible exception of its color scheme.
Should you decide to use the script, it might be worth your while to work with the logic of color and line, to produce alerts.
Enjoy.

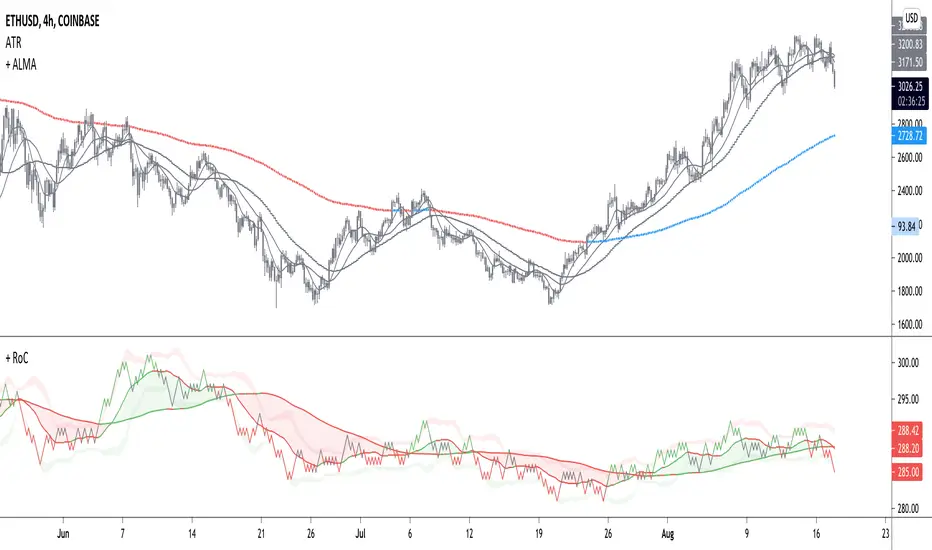
+ Rate of Change (and OBV)The Rate of Change, or RoC, is a momentum indicator that measures the percentage change in price between the current period and the price n periods ago. It oscillates above and below a zeroline, basically showing positive or negative momentum. I applied the OBV's calculation to it, but without the inclusion of volume (also added a lookback period) to see what would happen.
Actually what happened was I was looking at hot-rodding the OBV indicator, but then wondered if I could apply the cumulative calculation to another indicator to see what would happen. Not sure why I chose the Rate of Change, but it seemed a neat idea. And it worked! And so I called it the "Cumulative Rate of Change." I only recently realized that this is actually just the OBV without volume, HOWEVER the OBV does not have a lookback period, and its source is the close of each period. Basically, when you look at the calculation for the OBV you'll notice that it's a cumulative measure of the "change" of the closing price against the previous close times the volume. The Rate of Change is basically that measurement over more than one period, excluding the volume, and is not cumulative. Thus the "Cumulative Rate of Change" is basically an OBV without the volume but with the capability to adjust the lookback period.
Anyway, after days and weeks of playing with the indicator pretty infrequently I did decide that I actually really liked it, especially with the addition of moving averages and bollinger bands. So I decided to play with it a bit more.
I added a drop-down menu to include the standard Rate of Change indicator, and then thought I may as well add the OBV too, in case someone might like to compare that to the C-RoC, or just wants an OBV with myriad moving averages and bollinger bands.
By default I have the indicator set to the "C-RoC" and the lookback is set to 1, but play with longer settings (this is pretty much necessary if using the traditional RoC, which is by default set to 10 in TradingView, and is nigh on useless at 1).
I also recommend playing with the source. 'Close' is nice, but 'ohlc4' provides some very nice signals as well, as it follows the price flow for each period completely, filtering the noisiness of 'close' as source.
Hope you guys like this. With the bollinger bands and your preferred moving average settings this can be a powerful tool for re-entering trades in trend, taking profits, determining momentum swings.
Advanced VolumeThis simple indicator improves upon the built in volume indicator by adding the following:
-Option to use an EMA instead of SMA
-Advanced Coloring: Lighter bars show growing volume, darker bars show falling volume. Gray bars show very low relative volume (less than or equal to 50% of the moving average), while bars which have a highlighted background have a high relative volume( you can choose the threshold level, default is 2 times the RVOL).
Enjoy!

Cumulative Volume OscillatorCVO: Cumulative Volume Oscillator allows you to choose between 3 types of oscillators based on volume indicators:
-OBV (On Balance Volume)
-CVD (Cumulative Volume Delta)
-PVT (Price Volume Trend)
Being a volume based oscillator this indicator allows for the detection of divergences between price action and volume, ideal for predicting reversals.
As an oscillator you can choose the length of the fast & slow EMAs, and a signal line is provided for trend following.

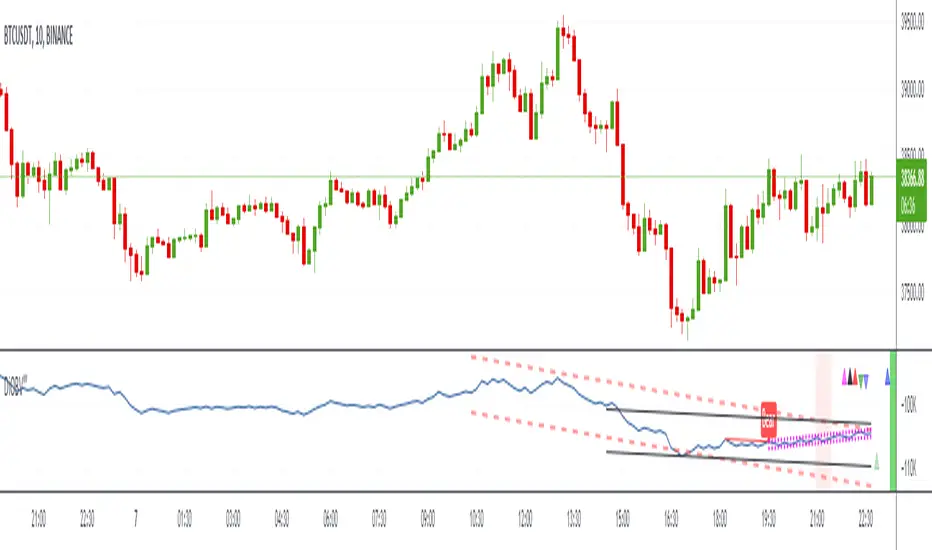
DI-OBV‴ | Divergence Indicator OBV‴What does it do?
Does the same as the ordigary OBV, but it has embeeded the 4TC indicator that provides trending channels that helps understand the strength of direction changing and divergencies with the price.
How does it work?
Works the exact same way as the ordinary OBV, but trending channels are drawn in order for you to see the OBV movement and potential reversal movements. Only 2 channels are drawn but you can activate the other 2 and also change their timeframes.
All channel directions are plotted in triangles on the top of the indicator frame which shows their direction (up or down).
The light red background shade signals that Volatility is activated and that price spread and volume are to be expected
What's my filling?
Helps confirm the volume movement and potential reversal and/or direction, as well as the divergency with price.
To have access to this indicator, please DM me.
Don't contact me in the comment area.
Trigonometric On Balance Volume (OBV) OscillatorLove volume analysis but it's hard for you to implement a simple strategy by it?
Use OBV.
Is OBV still not quite as it should be for you to get it in your trading system?
Use OBV Oscillator.
Does OBV Oscillator give you too many false signals and when you smooth it, it lags by a ton?
Then this indicator is the answer to your problem.
Introducing the Trigonometric OBV Oscillator.
The Trigonometric OBV Oscillator or "Trig OBV" for short, uses an old, but uniquely extremely reliable mathematical formula to smooth the OBV, while eliminating more than 95% of its false signals (noises) and keeping with the real direction of the trend without introducing any lags.
It is very responsive, predictive even to some degree, very reliable, and keeps you out of false trades (like false breakouts, sudden changes in the price, etc).
To go long: wait until the white line crosses up the purple line and continues in that direction.
To go short: wait until the white line crosses down the blue line and continues in that direction.
To exit, do the opposite.
Better to be used with a baseline filter such as Kaufman's moving average.
Use it and let me know what you think about it.

OBV High / LOW (On-Balance Volume )This is a simple application of OBV indicator (On-Balance Volume ), to visually determine when a given stock current obv is near the highest or lowest based on the number of lookback bars.
Indicator examples:
### OBV value is near an all-time high ##
breakthrough , stock value could set new all-time highs.
rejection , stock value could come down or consolidate.
Example
Inputs
OBV High Lookback -> numbers of bars to look back for the obv high.
OBV LowLookback -> numbers of bars to look back for the obv low.
OBV EMA Length -> Ema length
Notes:
This script also comes with an ema indicator based on obv for smoothing the obv signal since it gets noise at lower timeframes (by default comes disabled)
OBV information
www.investopedia.com
Comments:
This is my first script any ideas, suggestions, or detected errors (language/script) don´t hesitate to send a message.
Best regards, Mauro.

OBV+ (Div/Trends) [Anan]Hello friends,
As you requested, this is my own version of OBVwith these features:
- Plot various types of moving averages ("SMA","Smooth SMA","SuperSmooth MA","EMA","DEMA","TEMA","Triangular MA","QEMA","RMA","Hull MA","KAMA","WMA","VWMA","CTI","LSMA","VIDYA","Blackman Filter","Adaptive RSI","Probability")
- Change the length of moving average
- Change the Source of OBV
- Bullish/Bearish Regular/Hidden divergences
- Trend lines on OBV
