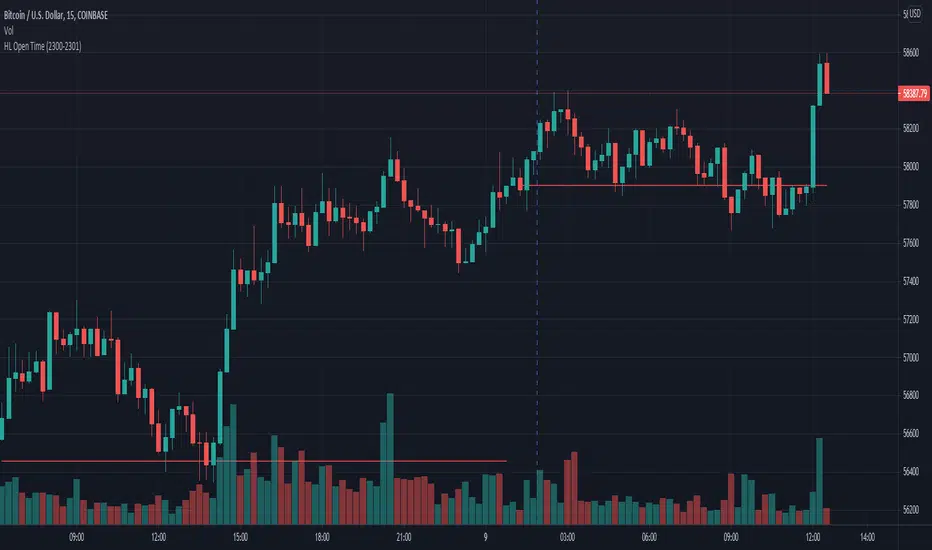
Custom Opening TimesThis indicator displays custom opening levels on your chart. Define multiple opening times, each with its own customizable style. Display these levels as horizontal lines at the opening price, or as vertical lines to mark the opening time.
Custom Opening Times
4 Independent Groups with 4 custom opening levels each
Set any custom opening time (displayed in New York Local Time)
Choose between Opening Price lines, Vertical time markers, or Both
Cutoff Times: Stop extending lines after specified times
Higher Timeframe Levels
5 Configurable HTF levels supporting any timeframe
Display opening prices from Daily, Weekly, Monthly, Quarterly, and custom timeframes
Show Previous High/Low levels from higher timeframes
Openprice

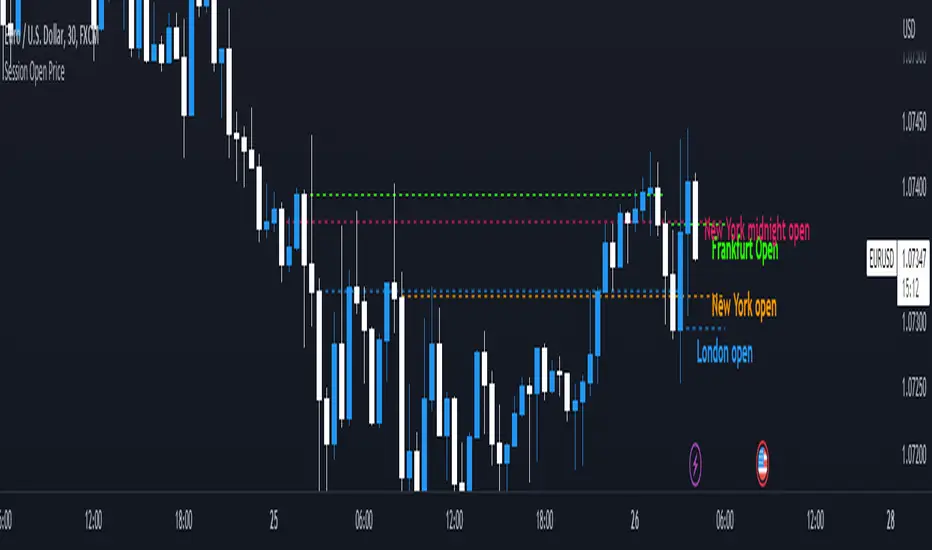
Session Open PriceThis Indicator displays the ICT kill zones' open price
You will be able to see the following open prices (ALL TIMES ARE IN NEW YORK TIME)
All times and appearances are customisable to your own liking.
The default time setting is recommended
- 00:00 AM Midnight New York Open Price (RED DASH LINE)
- 2:00 AM Frankfurt Open Price (GREEN DASH LINE)
- 3:00 AM London Open Price (BLUE DASH LINE)
- 8:30 AM New York Open Price (ORANGE DASH LINE)
HOW TO USE SESSION OPEN PRICE IN YOUR TRADING
If the price is above the opening price you only look for sells whereas if the price is under the opening price you only look for buys
BUY EXAMPLE
Wait for Midnight New York and Frankfurt open price to display
The price must be under both prices
Look for a Market maker buy model or your own entry model
Stoploss will be at the swing low and Take profit can be a fixed RR or how you calculate your take profit level
OHMLC Candles LevelsPlot Open / High / Middle / Low / Close Lines of current and previous candles.
The indicator is Multi-Timeframe.
Choose the line style and the type of extension.

Open Price v5This is a better way to plot open price support & resistance on your chart.
Using the newest v5 pine scripts.
The background color shows the current trend, but if you find it annoying you can turn it off in the settings.

Open Price StrategyThis strategy is based on the idea of buying off the open price and then holding until the end of the trading day. It will however swap if price crosses over the open price line.
It will plot a line based on the open price at the time you select for it to search for the open price. You can also select the open price source and time frame.
Next select your entry price source and time frame which will be used to determine if price is above or below the line for entry or swap.
You can then select the time frame for when you can enter trades. This is useful if you want it to only enter and swap for the first say 30 minutes of the day then hold.
Next select your time frame to exit trades. If your ending time is 1555 for example it will exit the open trade at 1555 so that way you don't hold it overnight. You must select "Enable Close Trade At End Of Exit Time Frame" or it will hold the trade.
Lastly there's a stop loss and take profit you can enable and use. It will be up to you if you want to use it since if stop loss or take profit is hit then it will still re-enter and continue trading.

Plot Horizontal Line at Open ValueThis simple indicator plots a horizontal line during the session showing the Open value at the chosen UTCTimeInput value. Remember that any value introduced for this parameter has to be expressed in UTC time.