Opening Prices by RiseOpening Prices by Rise - Multi-Timeframe Key Level Tracker
This comprehensive indicator identifies and displays critical opening price levels across multiple timeframes and customizable time-based intervals, providing traders with essential reference points for intraday and swing trading strategies.
The indicator systematically tracks opening prices from various market sessions and timeframe candles, creating persistent horizontal reference levels that extend forward on the chart. These levels represent institutional positioning points and psychological price zones where significant market reactions frequently occur.
Following level establishment, the indicator provides extensive visualization tools including customizable line styles, colors, widths, and optional vertical session markers. Advanced configuration options allow traders to display historical levels from previous trading days, implement custom time-based levels, and track higher timeframe candle opens—all within a single, streamlined interface.
This powerful solution delivers unmatched functionality for traders seeking to identify and monitor key opening price levels across multiple dimensions. Unlike basic session markers that display only current day levels, this indicator combines three distinct tracking systems—pre-configured key times, dynamic higher timeframe candle opens, and fully customizable time-based levels—into one cohesive tool. With its robust customization engine, historical multi-day tracking, and industry-leading custom level creation system, it provides capabilities that dramatically surpass conventional opening price indicators by offering complete control over every visual and functional aspect.
What are Opening Price Levels?
Opening prices represent the first traded price at the beginning of a specific time period. These levels are critical reference points because they often act as support or resistance zones throughout the trading session. The indicator tracks three primary categories:
Key Time-Based Opens
Pre-configured opening prices at strategically important times:
Daily Open -> The first price when the trading day begins
Midnight Open (00:00) -> Session start in 24-hour markets
New York Open (09:30) -> Major market session beginning
Higher Timeframe Candle Opens
Opening prices from larger timeframe candles that provide multi-timeframe context:
Monthly Open -> Beginning of each monthly candle
Weekly Open -> Start of each weekly period
4-Hour Open -> Intraday structural reference points
Each timeframe level can display multiple historical opens, allowing traders to see how price interacts with previous period opening levels.
Custom Time Levels
This indicator features a revolutionary custom level system that allows users to define unlimited time-based opening prices with complete control over styling and display options. Unlike other indicators with rigid preset times, this text-area based system provides unparalleled flexibility—simply add new levels using an intuitive comma-separated format. Each custom level has independent control over display type, line style, color, and width, making this the most versatile opening price tracking system available.
Historical Display
The indicator provides optional historical tracking, displaying opening price levels from previous trading days. This feature is invaluable for identifying recurring support/resistance zones and understanding how current price action relates to prior session opens. Most competing indicators only show current day levels, limiting their analytical value.
What Makes This Indicator Different?
Unified Multi-System Approach -> Combines time-based, candle-based, and custom levels in one indicator instead of requiring multiple tools
Advanced Historical Tracking -> Display previous days of opening levels, unlike competitors limited to current day only
Intelligent Timeframe Detection -> Automatically prevents display issues on incompatible chart timeframes for clean visualization
Industry-Leading Custom System -> Text-area based custom level creation with full parameter control per level—unmatched flexibility
Dual Display Options -> Every level can show horizontal price lines, vertical time markers, or both simultaneously
Complete Style Control -> Individual color, style, width, and text formatting for each level type
Multi-Timeframe Candle Tracking -> Display multiple previous opens from any timeframe (show last 1-5 occurrences)
Professional Label System -> Customizable text display with font, size, format, and alignment options
Smart Extension Logic -> Configurable forward extension with automatic endpoint detection
Dual Display Mode
Each opening level can be displayed as:
Horizontal price line showing the opening level
Vertical time marker indicating when the open occurred
Both simultaneously for complete context
Input Settings:
This tool offers extensive customizable options, which could be overwhelming to some users. Below you will find an in-depth definition of every input's purpose to complement the tooltips that can be found directly in the indicator's settings.
Historical 📜
Number of previous trading days to display opening levels for (0-50). Setting this to 25 or higher displays all available historical data. When set to 0, only the current day's levels are shown.
Offset 📏
Amount of bars to extend horizontal price lines past the current bar (0-50). This creates forward-looking reference levels that extend beyond the most recent price action.
Key Levels 🔑
Pre-configured opening times with individual controls for each level:
Daily -> Trading day open (typically midnight or session start)
00:00 -> Midnight open for 24-hour markets
09:30 -> New York market open
For each key level:
Checkbox -> Enable/disable this level
Type -> Display as "Open Price" (horizontal line), "Vertical Line" (time marker), or "Both"
Color -> Custom color selection
Style -> Line style (Solid, Dashed, or Dotted)
Width -> Line thickness (1-3)
Candle Levels 🕯️
Higher timeframe candle opening prices with enhanced controls:
Checkbox -> Enable/disable this timeframe
Name -> Custom label text for the level
Timeframe -> Select any timeframe (1M, 1W, 240, etc.)
Show Last -> Number of previous timeframe opens to display (1-5)
Type -> Display mode (Open Price, Vertical Line, or Both)
Color -> Custom color selection
Style -> Line style (Solid, Dashed, or Dotted)
Width -> Line thickness (1-3)
Text ✏️
Label configuration for all displayed levels:
Label -> Display "Time" (HH:mm format), "Name" (custom text), or "None"
Size -> Text size (Tiny, Small, Normal, Large, or Huge)
Font -> Font style (Default or Monospace)
Format -> Text formatting (Default, Bold, or Italic)
Align -> Vertical positioning (Top, Middle, or Bottom) and horizontal alignment (Left, Center, or Right)
Custom Levels ⚙️
Advanced custom level creation system using comma-separated parameters:
Format:
HHmmss,Label Text,Type,Style,Color,Width
Parameters:
Time -> HHmmss format (e.g., 060000 for 6:00 AM)
Text -> Custom label for this level
Type -> "Open Price", "Vertical Line", or "Both"
Style -> "Solid", "Dotted", or "Dashed"
Color -> "Red", "Green", "Blue", "Yellow", "Orange", "Purple", "Pink", "White", or "Black"
Width -> Line thickness (1-3)
Example:
060000, ,Open Price,Dotted,Blue,1
083000, ,Both,Solid,Green,2
140000, ,Vertical Line,Dashed,Orange,1
Each custom level must be on a separate line. The text area accepts multiple custom levels for maximum flexibility.
Use Cases:
Identify key support and resistance levels from session opens
Track institutional positioning zones across multiple timeframes
Establish reference points for range-bound trading strategies
Monitor previous day opens for gap trading opportunities
Create custom session markers for specific trading strategies
Analyze price reactions at higher timeframe opening levels
Build systematic entry and exit strategies around opening prices
This indicator is for educational and informational purposes only. Past performance and historical patterns do not guarantee future results. Trading involves substantial risk of loss and is not suitable for all investors. Always conduct your own analysis and consider your financial situation before making any trading decisions. The identification of patterns does not constitute trading advice.
For any additional questions and/or feedback related to this indicator, users can comment below!
Openprice

Custom Opening TimesThis indicator displays custom opening levels on your chart. Define multiple opening times, each with its own customizable style. Display these levels as horizontal lines at the opening price, or as vertical lines to mark the opening time.
Custom Opening Times
4 Independent Groups with 4 custom opening levels each
Set any custom opening time (displayed in New York Local Time)
Choose between Opening Price lines, Vertical time markers, or Both
Cutoff Times: Stop extending lines after specified times
Higher Timeframe Levels
5 Configurable HTF levels supporting any timeframe
Display opening prices from Daily, Weekly, Monthly, Quarterly, and custom timeframes
Show Previous High/Low levels from higher timeframes

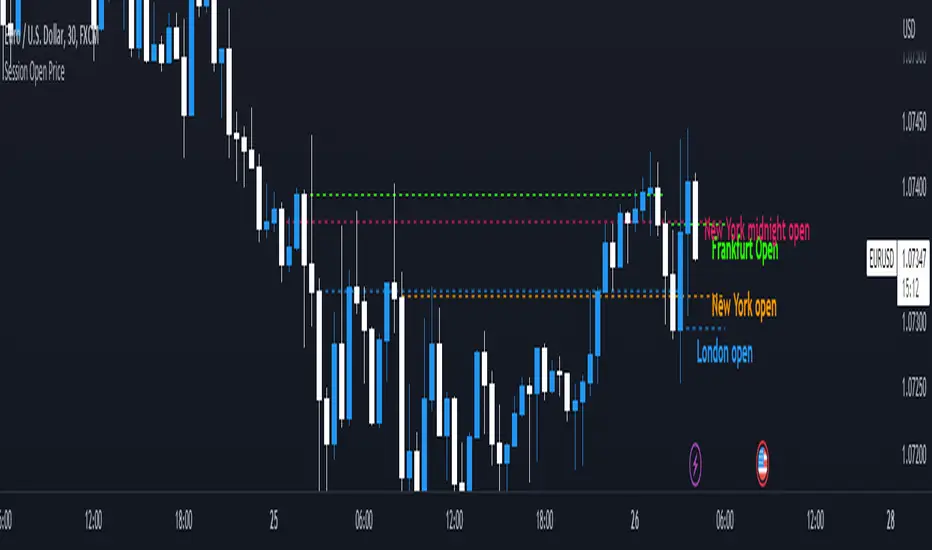
Session Open PriceThis Indicator displays the ICT kill zones' open price
You will be able to see the following open prices (ALL TIMES ARE IN NEW YORK TIME)
All times and appearances are customisable to your own liking.
The default time setting is recommended
- 00:00 AM Midnight New York Open Price (RED DASH LINE)
- 2:00 AM Frankfurt Open Price (GREEN DASH LINE)
- 3:00 AM London Open Price (BLUE DASH LINE)
- 8:30 AM New York Open Price (ORANGE DASH LINE)
HOW TO USE SESSION OPEN PRICE IN YOUR TRADING
If the price is above the opening price you only look for sells whereas if the price is under the opening price you only look for buys
BUY EXAMPLE
Wait for Midnight New York and Frankfurt open price to display
The price must be under both prices
Look for a Market maker buy model or your own entry model
Stoploss will be at the swing low and Take profit can be a fixed RR or how you calculate your take profit level
Smart Money Add-Ons [TFO]Supplementing my “Smart Money Essentials ” indicator, these add-ons provide some more commonly used “Smart Money Concepts,” including SMT Divergence, and HTF POI, and open price lines for added confluence.
Smart Money Technique (SMT) Divergence is meant to annotate divergence between closely correlated assets. Take $ES_F and $NQ_F for example (S&P 500 and Nasdaq 100 futures). These two names normally track each other very closely, but if $ES_F is steadily rising towards a large institutional level and making higher highs, while $NQ_F is approaching a similarly important level and making lower highs on that same timeframe, this would indicate a divergence between the two assets that could foreshadow a “Smart Money Reversal.”
Open price lines can provide intraday levels of interest from important times of day, where the defaults are set to midnight (12:00 AM), 8:30 AM for news releases, and 9:30 AM New York market open (New York local time). The open prices at these times can often act as support and resistance when other confluence factors are present. Higher timeframe points of interest (HTF POI) are also helpful to remain mindful of imbalances and other inefficiencies in which lower timeframe price action may create some reversal structure.

OHMLC Candles LevelsPlot Open / High / Middle / Low / Close Lines of current and previous candles.
The indicator is Multi-Timeframe.
Choose the line style and the type of extension.

Open Price v5This is a better way to plot open price support & resistance on your chart.
Using the newest v5 pine scripts.
The background color shows the current trend, but if you find it annoying you can turn it off in the settings.

Open Price StrategyThis strategy is based on the idea of buying off the open price and then holding until the end of the trading day. It will however swap if price crosses over the open price line.
It will plot a line based on the open price at the time you select for it to search for the open price. You can also select the open price source and time frame.
Next select your entry price source and time frame which will be used to determine if price is above or below the line for entry or swap.
You can then select the time frame for when you can enter trades. This is useful if you want it to only enter and swap for the first say 30 minutes of the day then hold.
Next select your time frame to exit trades. If your ending time is 1555 for example it will exit the open trade at 1555 so that way you don't hold it overnight. You must select "Enable Close Trade At End Of Exit Time Frame" or it will hold the trade.
Lastly there's a stop loss and take profit you can enable and use. It will be up to you if you want to use it since if stop loss or take profit is hit then it will still re-enter and continue trading.

Plot Horizontal Line at Open ValueThis simple indicator plots a horizontal line during the session showing the Open value at the chosen UTCTimeInput value. Remember that any value introduced for this parameter has to be expressed in UTC time.