SMC Academy [PhenLabs]📊 SMC Academy
Version: PineScript™ v6
📌 Description
The SMC Academy indicator is a comprehensive educational tool designed to demystify Smart Money Concepts (SMC) for traders of all levels. Unlike standard indicators that simply print signals, this script uses a “Learning Phase” system that allows users to toggle between individual concepts—such as Market Structure, Liquidity, Imbalances, and Order Blocks—or view them all simultaneously. It lets you focus on one piece of the puzzle at a time.
🚀 Points of Innovation
Progressive Learning Modes: Toggle between 5 distinct phases to master concepts individually before using the Full Strategy Mode.
Educational Tooltips: Hover over labels to read detailed explanations of why a BOS, MSS, or Liquidity zone was identified.
Smart Filtering: Uses ATR and Volume integration to filter out low-quality Fair Value Gaps and weak Order Blocks.
HTF Dashboard: A built-in panel analyzes Higher Timeframe (4H) data to ensure you are trading in alignment with the broader trend.
🔧 Core Components
Market Structure Engine: Automatically detects Swing Highs and Lows to map out market direction using configurable swing lengths.
Liquidity Manager: Identifies unmitigated swing points that serve as Buy-Side (BSL) and Sell-Side (SSL) liquidity magnets.
Imbalance Detector: Highlights Fair Value Gaps (FVG) where price inefficiencies exist, using ATR thresholds to ignore noise.
Order Block Identifier: Locates the specific candles responsible for structure breaks, validated by volume analysis.
🔥 Key Features
Break of Structure (BOS): Automatically marks trend continuation signals with solid lines and color-coded labels.
Market Structure Shift (MSS): Identifies potential trend reversals when significant swing points are breached.
Dashboard Context: Displays the current trend direction and the 4H context directly on your chart.
Custom Alerts: Built-in alert conditions for structure breaks and new Order Blocks allow for automated tracking.
🎨 Visualization
Structure Lines: Solid lines indicate confirmed breaks (Green for Bullish, Red for Bearish).
Liquidity Zones: Dotted lines extending rightward indicate resting liquidity levels that price may target.
FVG Boxes: Shaded boxes highlight imbalance zones, automatically extending for a user-defined number of bars.
Dashboard: A clean, non-intrusive table in the top-right corner displays trend status and active mode.
📖 Usage Guidelines
Setting Categories
Learning Mode: Select from ‘1. Market Structure’ through ‘5. Full Strategy Mode’ to filter what appears on the chart.
Swing Detection Length: Default (5). Determines the sensitivity of the swing high/low detection.
Structure Break Type: Options (Close/Wick). Choose whether a candle close or just a wick is required to confirm a break.
Min FVG Size: Default (0.5 ATR). Filters out gaps smaller than this multiplier to reduce noise.
Filter Weak OBs by Volume: Default (True). Only highlights Order Blocks where volume exceeds the 20-period average.
✅ Best Use Cases
Educational Study: Isolate “Phase 1: Market Structure” to practice identifying trend changes without distraction.
Trend Following: Use “Phase 3: Imbalances” to find entry points within an established trend.
Reversal Trading: Combine “Phase 2: Liquidity” and “Phase 4: Order Blocks” to catch reversals at key levels.
⚠️ Limitations
Subjectivity: Market structure can be interpreted differently depending on the swing length settings used.
Ranging Markets: Like all trend-following concepts, false BOS/MSS signals may generate during choppy, sideways price action.
Repainting: While the signals are non-repainting once confirmed, the live candle may flash a signal before the close if “Close” mode is selected.
💡 What Makes This Unique
Interactive Learning: The inclusion of tooltip explanations transforms this from a simple tool into an active mentor.
Phase-Based Workflow: The ability to strip the chart back to basics at the click of a button is unique to the PhenLabs ecosystem.
🔬 How It Works
Swing Analysis: The script calculates pivot highs and lows based on your length input to define the structural landscape.
Break Validation: It checks if price crosses these pivot points to trigger BOS (Continuation) or MSS (Reversal) logic.
Volume Confirmation: For Order Blocks, it looks back inside the swing leg to find the specific candle responsible for the move, verifying it has significant volume.
💡 Note:
For the best experience, start in Phase 1 to calibrate your Swing Detection Length to the specific volatility of the asset you are trading before enabling Full Strategy Mode.
Orderblocks

Order Block Finder [MHA Finverse]A comprehensive order block detection indicator that identifies institutional buying and selling zones with advanced volume filtering and King Order Block (KOB) detection.
Key Features
Dual Structure Detection
- Internal Order Blocks: Short-term zones based on 5-bar pivots for precise entries
- Swing Order Blocks: Higher timeframe zones based on 50-bar pivots for major support/resistance levels
- Toggle between structures or display both simultaneously
King Order Block (KOB)
The indicator automatically identifies the order block with the highest volume and marks it as the "King Order Block" - typically the most significant institutional zone that deserves priority attention. You can optionally color-code KOB blocks differently for instant visual recognition.
Intelligent Volume Filtering
Uses ATR or Cumulative Mean Range to filter out low-quality blocks and focus only on institutional-sized moves. This ensures you're trading zones where smart money has left clear footprints.
Volume Metrics Display
Each order block shows its actual volume and percentage contribution, helping you prioritize which zones to trade. Higher volume blocks indicate stronger institutional interest.
Flexible Lookback Periods
Choose from preset trading styles (Scalping: 50 bars, Day Trading: 150 bars, Swing Trading: 400 bars, Position Trading: 750 bars) or set custom lookback periods to match your strategy.
Advanced Mitigation Options
Select between Close or High/Low mitigation methods to control when order blocks are considered invalidated.
King Order Block (KOB)
The King Order Block is the order block with the highest volume among all active blocks on your chart. It represents the zone where the largest institutional activity occurred, making it the most significant level for potential reversals. When multiple order blocks are present, the KOB should be your primary focus as it typically offers higher probability setups. The indicator automatically identifies and marks the KOB with a special label, and you can optionally color-code it differently for instant visual recognition. KOB zones often produce stronger reactions when price returns to test them, allowing for more confident entries with tighter stop losses.
How to Use
1. For Short-Term Trading: Enable Internal Order Blocks to identify quick reversals and entries on lower timeframes.
2. For Position Trading: Enable Swing Order Blocks to find major institutional zones on higher timeframes.
3. Focus on KOB: When multiple blocks appear, prioritize the King Order Block as it represents the highest volume zone.
4. Volume Confirmation: Check the volume metrics - blocks with 30%+ volume contribution are typically stronger zones.
5. Entry Strategy: Wait for price to return to an order block, look for rejection signals (pin bars, engulfing patterns), then enter with stops below/above the block.
6. Adjust Lookback: Match the lookback period to your trading timeframe for optimal block visibility.
Color Themes
- Colored Mode: Distinct colors for bullish/bearish and internal/swing blocks
- Monochrome Mode: Professional grayscale palette for clean charts
Alert System
Comprehensive alerts for:
- Order block creation (internal/swing, bullish/bearish)
- Order block mitigation
- King Order Block events
Perfect for traders who follow Smart Money Concepts (SMC), institutional order flow, and supply/demand zones.
Disclaimer
This indicator is for educational and informational purposes only. It does not constitute financial advice or trading recommendations. Past performance does not guarantee future results. Always conduct your own analysis, use proper risk management, and never risk more than you can afford to lose. Trading involves substantial risk of loss.

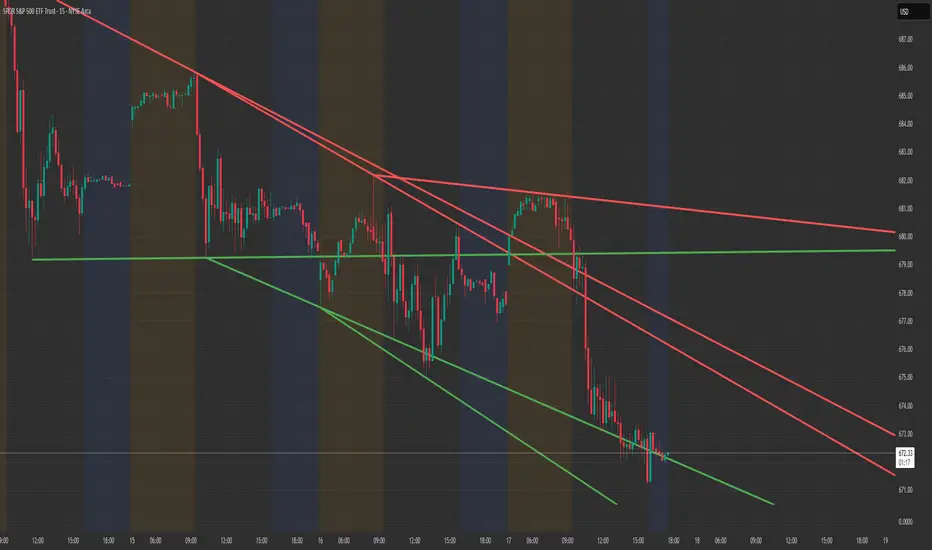
Structure Lite - Automatic Major Trend LinesStructure Lite — Automatic Major Trend Lines
Structure Lite automatically detects and plots major market structure using higher-timeframe pivot highs and lows.
It is designed to provide a clean, lightweight view of primary support and resistance without manual drawing or chart clutter.
This script focuses only on major structure and intentionally excludes short-term noise, advanced liquidity concepts, or signal logic.
Features
Automatically plots major resistance (red) and major support (green) trend lines
Uses higher-period pivots to reflect macro / swing structure
Lines extend right for forward projection
Keeps only the most recent major levels to reduce clutter
Optional toggle to hide all trend lines for a clean chart view
How to Use
Add the indicator to your chart
Adjust Major Pivot Period to control how swing-based the structure is
Higher values = fewer, more important levels
Lower values = more responsive structure
Use the plotted lines to:
Identify higher-timeframe support and resistance
Contextualize price action and trend bias
Toggle Hide All Trend Lines to quickly remove structure without removing the indicator
This tool is intended for context and structure awareness, not trade signals.
Design Philosophy
Structure Lite is intentionally minimal:
No alerts
No buy/sell signals
No predictions
No performance claims
It is built as a foundational structure tool that can be combined with the user’s own methodology.
Notes
Some inputs reference advanced features available in a separate professional version
These options are disabled here and included only for interface consistency
No external links, promotions, or monetization are included in this script
Disclaimer
Educational and informational purposes only.
This script does not provide financial advice or trade recommendations.
Past market behavior does not guarantee future results.
© 2025 GammaBulldog
TWT_MAHA+REVERAL🔹 TWT_MAHA + REVERSAL (Smart Money Reversal System)
TWT_MAHA + REVERSAL is a non-repainting support–resistance + price-action reversal indicator designed to catch high-probability market turning points near extremes.
It combines:
Dynamic Support & Resistance (multi-timeframe)
RSI + MACD momentum exhaustion
Smart Money concepts (Order Blocks & Liquidity grabs)
Advanced price-action patterns (pin bars, engulfing, failures)
✅ How to Use (Simple Rules)
🟢 BUY SETUP
Look for Buy signals near Support / Extreme Lows when:
RSI is oversold and starting to reverse
MACD shows loss of bearish momentum
Strong bullish price action appears (long wick, engulfing, reversal pattern)
A Bullish Order Block (OB) or Bullish SFP (liquidity grab) is printed
📌 Best entries:
First retest of a bullish OB
Strong reversal candle close near support
🔴 SELL SETUP
Look for Sell signals near Resistance / Extreme Highs when:
RSI is overbought and rolling over
MACD shows loss of bullish momentum
Strong bearish price action appears
A Bearish Order Block (OB) or Bearish SFP is printed
📌 Best entries:
First retest of a bearish OB
Rejection wick or strong bearish candle near resistance
🎯 Risk–Reward Guidance
Intraday / Scalping:
🔸 Typical RR: 1:1.5 to 1:2
Swing / Positional:
🔸 Typical RR: 1:2 to 1:4
🛑 Stop-loss:
Just beyond the OB zone or recent swing high/low
🎯 Targets:
Nearest opposing S/R
Partial at 1R, trail the rest
🧠 Key Notes
Works best on 5m, 15m, 30m for intraday
Also effective on 1H+ for swing trading
Designed to reduce noise and avoid late entries
No repainting signals
🔐 Access & Updates
This indicator is private.
📩 To get access:
👉 DM me directly on TradingView
(Serious traders only — this tool is built for education Purpose Only. Before taking any Real Trade consult your own Financial Advisor)

Hybrid Strategy: Trend/ORB/MTFHybrid Strategy: Trend + ORB + Multi-Timeframe Matrix
This script is a comprehensive "Trading Manager" designed to filter out noise and identify high-probability breakout setups. It combines three powerful concepts into a single, clean chart interface: Trend Alignment, Opening Range Breakout (ORB), and Multi-Timeframe (MTF) Analysis.
It is designed to prevent "analysis paralysis" by providing a unified Dashboard that confirms if the trend is aligned across 5 different timeframes before you take a trade.
How it Works
The strategy relies on the "Golden Trio" of confluence:
1. Trend Definition (The Setup) Before looking for entries, the script analyzes the immediate trend. A bullish trend is defined as:
Price is above the Session VWAP.
The fast EMA (9) is above the slow EMA (21). (The inverse applies for bearish trends).
2. The Signal (The Trigger) The script draws the Opening Range (default: first 15 minutes of the session).
Buy Signal: Price breaks above the Opening Range High while the Trend is Bullish.
Sell Signal: Price breaks below the Opening Range Low while the Trend is Bearish.
3. The Confirmation (The Filter) A signal is only valid if the Higher Timeframe (default: 60m) agrees with the direction. If the 1m chart says "Buy" but the 60m chart is bearish, the signal is filtered out to prevent false breakouts.
Key Features
The Matrix Dashboard A zero-lag, real-time table in the corner of your screen that monitors 5 user-defined timeframes (e.g., 5m, 15m, 30m, 60m, 4H).
Trend: Checks if Price > EMA 21.
VWAP: Checks if Price > VWAP.
ORB: Checks if Price is currently above/below the Opening Range of that session.
D H/L: Warns if price is near the Daily High or Low.
PD H/L: Warns if price is near the Previous Daily High or Low.
Visual Order Blocks The script automatically identifies valid Order Blocks (sequences of consecutive candles followed by a strong explosive move).
Chart: Draws Green/Red zones extending to the right, showing where price may react.
Dashboard: Displays the exact High, Low, and Average price of the most recent Order Blocks for precision planning.
Risk Management (Trailing Stop) Once a trade is active, the script plots Chandelier Exit dots (ATR-based trailing stop) to help you manage the trade and lock in profits during trend runs.
Visual Guide (Chart Legend)
⬜ Gray Box: Represents the Opening Range (first 15 minutes). This is your "No Trade Zone." Wait for price to break out of this box.
🟢 Green Line: The Opening Range High. A break above this line signals potential Bullish momentum.
🔴 Red Line: The Opening Range Low. A break below this line signals potential Bearish momentum.
🟢 Green / 🔴 Red Zones (Boxes): These are Order Blocks.
🟢 Green Zone: A Bullish Order Block (Demand). Expect price to potentially bounce up from here.
🔴 Red Zone: A Bearish Order Block (Supply). Expect price to potentially reject down from here.
⚪ Dots (Trailing Stop):
🟢 Green Dots: These appear below price during a Bullish trend. They represent your suggested Stop Loss.
🔴 Red Dots: These appear above price during a Bearish trend.
🏷️ Buy / Sell Labels:
BUY: Triggers when Price breaks the Green Line + Trend is Bullish + HTF is Bullish.
SELL: Triggers when Price breaks the Red Line + Trend is Bearish + HTF is Bearish.
Settings
Session: Customizable RTH (Regular Trading Hours) to filter out pre-market noise.
Matrix Timeframes: 5 fixed slots to choose which timeframes you want to monitor.
Order Blocks: Adjust the sensitivity and lookback period for Order Block detection.
Risk: Customize the ATR multiplier for the trailing stop.
Disclaimer
This tool is for educational purposes only. Past performance does not guarantee future results. Always manage your risk properly.

Supply and Demand Zones [BigBeluga]🔵 OVERVIEW
The Supply and Demand Zones indicator automatically identifies institutional order zones formed by high-volume price movements. It detects aggressive buying or selling events and marks the origin of these moves as demand or supply zones. Untested zones are plotted with thick solid borders, while tested zones become dashed, signaling reduced strength.
🔵 CONCEPTS
Supply Zones: Identified when 3 or more bearish candles form consecutively with above-average volume. The script then searches up to 5 bars back to find the last bullish candle and plots a supply zone from that candle’s low to its low plus ATR.
Demand Zones: Detected when 3 or more bullish candles appear with above-average volume. The script looks up to 5 bars back for a bearish candle and plots a demand zone from its high to its high minus ATR.
Volume Weighting: Each zone displays the cumulative bullish or bearish volume within the move leading to the zone.
Tested Zones: If price re-enters a zone and touches its boundary after being extended for 15 bars, the zone becomes dashed , indicating a potential weakening of that level.
Overlap Logic: Older overlapping zones are removed automatically to keep the chart clean and only show the most relevant supply/demand levels.
Zone Expiry: Zones are also deleted after they’re fully broken by price (i.e., price closes above supply or below demand).
🔵 FEATURES
Auto-detects supply and demand using volume and candle structure.
Extends valid zones to the right side of the chart.
Solid borders for fresh untested zones.
Dashed borders for tested zones (after 15 bars and contact).
Prevents overlapping zones of the same type.
Labels each zone with volume delta collected during zone formation.
Limits to 5 zones of each type for clarity.
Fully customizable supply and demand zone colors.
🔵 HOW TO USE
Use supply zones as potential resistance levels where sell-side pressure could emerge.
Use demand zones as potential support areas where buyers might step in again.
Pay attention to whether a zone is solid (untested) or dashed (tested).
Combine with other confluences like volume spikes, trend direction, or candlestick patterns.
Ideal for swing traders and scalpers identifying key reaction levels.
🔵 CONCLUSION
Supply and Demand Zones is a clean and logic-driven tool that visualizes critical liquidity zones formed by institutional moves. It tracks untested and tested levels, giving traders a visual edge to recognize where price might bounce or reverse due to historical order flow.

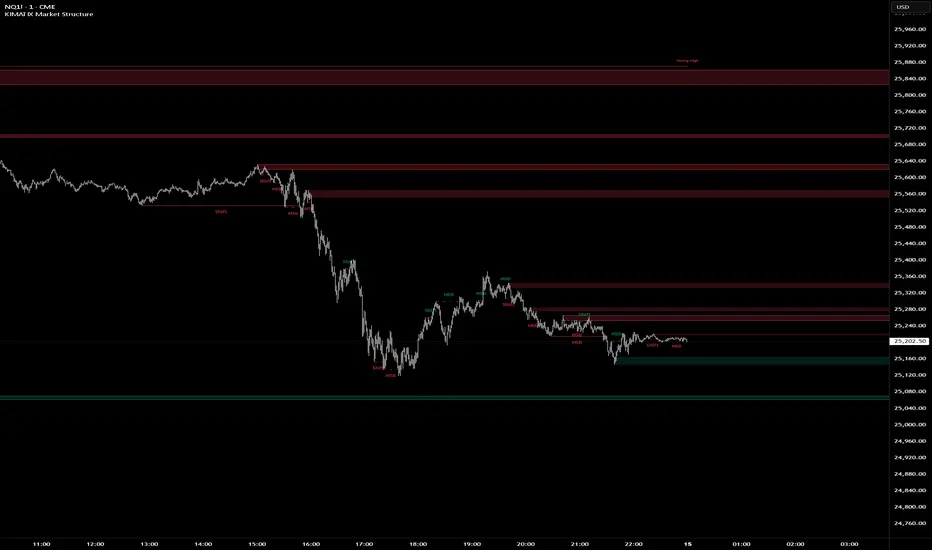
KIMATIX Market StructureKIMATIX Market Structure is a professional-grade market structure and liquidity framework built for traders who focus on institutional price behavior, not lagging indicators.
This tool continuously analyzes price to map internal (micro) and external (macro) structure, giving you a clear read on whether the market is in continuation, transition, or reversal. Instead of guessing trend direction, you see it unfold in real time through structure breaks and shifts.
What the indicator helps you identify
Micro & Macro Market Structure
Internal structure for execution and timing
Higher-structure context for directional bias
Market Structure Breaks (MSB) vs. Shifts
MSB highlights continuation strength
Shift signals potential trend transition
Institutional Zones
Automatically derived zones where displacement occurred
Designed to highlight areas of likely reaction, mitigation, or continuation
Strong vs. Weak Highs and Lows
Instantly see which extremes are protected and which are vulnerable to liquidity raids
Optional Swing Logic (HH / HL / LH / LL)
For traders who want classic structure confirmation layered on top
Historical vs. Present Mode
Study full structure development or keep the chart clean and execution-focused
The indicator is intentionally not a signal generator. It is a decision-support tool designed to give clarity, context, and confluence. Best results come from combining it with session timing, liquidity concepts, and your execution model.
Built with strict object management and internal safeguards, the script remains fast and stable even on lower timeframes and extended chart history.
If you trade price action, liquidity, and structure, this tool is designed to fit seamlessly into your workflow.
More Indicators here: kimatixtrading.com
Order Blocks v2This is a short code script that shows you a REAL Order Blocks.
There is many indicators that show you random blocks on the screen, these are by definition Order Blocks. The code is simple and short.
You can use this indicator as an extra confluence or as a place to put your stop losses or to put your stop losses in profit.
I recommend always keeping the "Consider order block only with following FVG" on, as the best Order Blocks are found with that setting on.
I have a lot more code i can share, use this and let me know how it works for you!
THE SETTINGS I USE ARE:
(NO) Only show on on time levels 3,7,11,14
fractal bars 3
Order blocks on break of Fractal close or HL Close
(YES) Consider order block only with following FVG
Max distance of FVG following Order Blocks 2
Oder Block Height Body
Dotted 13 length and 3 width

ADAPTIVE ICT MULTI-ZONEAdaptive ICT Multi-Zone
Why Another ICT Script?
Most public ICT zone scripts flood your chart with dozens of noisy, overlapping boxes that never get cleaned up, use fixed lookbacks that work on one asset and fail on another, and mark every tiny gap as “FVG” — turning the chart into a rainbow mess that’s impossible to trade.
ADAPTIVE ICT MULTI-ZONE is built differently:
Only the strongest, most recent zones pass the adaptive filter (default 3 bullish OB + 3 bearish OB + 3 FVG). No more chart clutter.
Fair Value Gaps are filtered by ATR (default ≥ 0.7 × ATR) and optional high-volume confirmation so you only see gaps that actually matter.
Order Blocks are true swing-based (pivot high/low).
Every zone automatically extends far to the right until price closes through it — you never miss a mitigation.
Zero repainting. Zero lag. Zero memory leaks. Runs perfectly on every time frame.
In short: while many ICT scripts are noisy toys, this one is a surgical tool that shows exactly what institutional desks are up to.
How to Trade It Best (Simple & Effective)
Wait for price to return to a freshly drawn zone (watch the newest ones — they have the highest probability).
Look for confluence:
Price inside a Bullish Order Block + bullish engulfing or strong volume → aggressive long.
Price inside a Bearish Order Block + bearish engulfing or strong volume → aggressive short.
Price sweeping into an FVG and instantly rejecting → high-probability reversal (especially if the FVG had high volume when created).
Use higher-timeframe bias: if the daily/4H zone aligns with your 15-min or 5-min zone → stack size.
Take partials at the opposite-side order block or next FVG. Let runners go to next liquidity zone.
That’s it.
This script doesn’t try to do everything. It does one thing — show you the exact institutional zones that actually get respected — and it does it cleaner and smarter.
Add it, delete every other OB/FVG script you own, and catch more accurate reversals.

Smart Money Concepts [Kodexius]Smart Money Concepts is a price action framework designed to integrate market structure, liquidity behavior, and inefficiencies into a single, readable view. Rather than acting as a signal generator, it serves as a live market map highlighting where price has displaced, where liquidity may be resting, which zones remain valid, and how that context updates as new candles print.
What separates this script from typical “SMC bundles” is not the presence of familiar concepts like swings, order blocks, FVGs or liquidity sweeps. The value is in the engine design and how the components are maintained together as a consistent state, with automatic pruning and prioritization so the chart stays usable over time. Many tools can draw boxes, but fewer tools manage the lifecycle of those zones, reduce overlap, rank relevance, and keep the display focused on what still matters near current price.
At the core is a structure model that tracks directional state and labels structural transitions as they happen. CHoCH and BoS are not just printed whenever price crosses a line. Each event is anchored to a swing reference and handled in a way that reduces repeated triggers from the same context, helping you see genuine transitions versus minor noise. This gives structure a “narrative” across time instead of a cluttered sequence of identical labels.
Order blocks are built from the most relevant candle within the post break window and displayed as true zones that extend forward while they remain valid. Beyond the zone itself, the script adds context that is usually missing in basic OB implementations: a volumetric pressure visualization and a displacement strength score that is normalized and ranked over a rolling window. In practice, this creates an information hierarchy. You can quickly see which zones carried more participation, whether the internal push was dominated by buying or selling pressure, and whether the move that created the zone had meaningful displacement relative to recent history. This is designed to help prioritization, not to claim prediction.
Imbalances are handled as a dedicated module with multiple detection modes (FVG, VI, OG, IFVG) and optional MTF logic so you can map inefficiencies from a higher timeframe while executing on a lower timeframe. Each imbalance is displayed as a zone with a midline reference, and mitigation behavior can be tuned (wick or close). IFVG adds lifecycle depth by tracking inversion behavior rather than simply deleting the zone, which can be useful for monitoring how price rebalances and flips inefficiencies over time. An optional sentiment style internal fill is available for visual context, but it is intentionally framed as informational rather than a “buy/sell meter.”
Liquidity is treated as an event driven layer. Pivot highs and lows are tracked as potential liquidity pools, then monitored for sweeps and rejection behavior. If you enable EQH/EQL logic, the script can label equal highs and lows during the sweep process to highlight common resting liquidity formations. A volume filter is available to reduce low quality levels, aiming to keep the liquidity map focused on swings that occurred with meaningful participation rather than every small fluctuation.
Swing Failure Patterns (SFP) are included as a separate confirmation style tool that focuses on rejection after liquidity is taken. The module supports optional volume validation using lower timeframe volume distribution outside the swing level, which helps filter some low quality SFPs on noisy instruments. The output is a cleaner set of events intended to complement structure, liquidity and zones, not replace discretionary decision making.
For higher timeframe context, the HTF candle projection panel can display a compact set of higher timeframe candles to the right of current price, with classic or Heikin Ashi style and configurable sizing, spacing and labels. This allows you to maintain HTF awareness without switching charts, which is especially helpful when structure and zones are being interpreted across multiple timeframes.
Finally, the alert framework is designed around well defined structural and zone states. Alerts cover structural shifts (CHoCH, BoS), liquidity sweeps, new and broken order blocks, breaker behavior (if enabled), new and approached imbalances, premium and discount entries, trendline events, and SFP detection. These alerts are intended as monitoring prompts so you can review context, not as automated trade execution signals.
Every major component is modular and configurable. You can run a minimal structure only layout or enable a full framework with zones, imbalances, liquidity, SFP and HTF projection. The guiding principle is chart clarity and relevance: keep the most important information visible, reduce overlap and stale objects, and maintain a consistent view of how price is interacting with liquidity and value over time.
🔹 Features
🔸 Market Structure Engine (CHoCH and BoS)
This script automatically tracks zigzag based market structure and differentiates between:
CHoCH (Change of Character) : the first meaningful structural shift that suggests the prior directional leg is weakening.
BoS (Break of Structure) : continuation breaks that confirm structure extension in the active direction.
Instead of relying on plain pivot dots, our market structure swings are built with a lightweight zigzag style engine that tracks direction and “locks in” the true leg extreme only when the leg flips. This produces cleaner, more consistent swing highs/lows for BOS/CHoCH than simple left/right pivot checks.
Bullish CHoCH:
Bearish CHoCH:
Bullish BoS:
Bearish BoS:
🔸 Order Blocks with Volumetric and Displacement Insight
The script identifies recent bullish and bearish order block zones around meaningful structural reactions and keeps the display focused on the most relevant areas. Instead of drawing a static rectangle and leaving it there forever, each zone is maintained as an active region on the chart and can be limited by a user defined visibility depth to avoid clutter. When enabled, the overlay also adds compact volume based context inside the block so you can quickly compare relative participation between recent zones and see whether the origin move showed strong follow through versus a softer transition. The intention is to provide structured context and cleaner prioritization on the chart, not to present a trade call or a guaranteed reaction level.
Bullish Order Block:
Bearish Order Block:
Order blocks are derived from the structure shifts, marking the institutional “origin zone” behind a decisive move and projecting it forward as a live area of interest. In practice, it highlights the candle cluster where price last rebalanced before expanding away, so you can track potential retests with context instead of guessing.
Inside each order block, the internal bars act as a compact strength meter green vs red summarizes the relative bullish vs bearish participation, while the blue segment reflects the “departure force” (displacement/momentum) away from the zone. It’s meant to help you scan which blocks left clean and strong versus those that moved out more slowly or with mixed pressure.
🔸 Breaker Blocks & Mitigation Tracking
Tracks when previously identified order blocks fail and converts them into breaker blocks, visually marking a change in how price is interacting with that zone.
Bullish Breaker Block :
Bearish Breaker Block :
Separate handling of bullish and bearish breakers with clear color differentiation.
Includes optional “mitigation” logic using either wick or close to determine when a block is considered broken or mitigated.
Breaker blocks are updated and removed dynamically as price trades through them, keeping the chart focused on current, active zones.
🔸 Imbalances
The imbalance module maps common price inefficiencies as zones, with support for multiple detection styles such as Fair Value Gaps, volume style imbalances, opening gaps, and an inverted gap mode. Each imbalance is drawn as a practical area on the chart with a midpoint reference, so you can quickly see where price may be revisiting unbalanced movement. You can also choose how mitigation is evaluated (wick or close) and optionally run imbalance detection on a separate timeframe for cleaner higher timeframe context while staying on your execution chart.
Fair Value Gaps:
Inverse Fair Value Gaps:
Opening Gaps:
🔸 Liquidity Sweeps, EQH/EQL, and Optional Volume Filter
Liquidity levels are derived from swing highs and lows and then monitored for sweep behavior, where price trades beyond a prior level and rejects back. If you enable EQH/EQL marking, the script can highlight equal highs and equal lows behavior around those liquidity areas to make common pool formations easier to spot. An optional volume filter can be used to reduce tracking of low participation swings, helping keep the liquidity layer focused and less noisy on instruments that produce frequent small pivots.
Sellside Liquidity Sweep Definition:
Buyside Liquidity Sweep Definition:
Highlights equal highs (EQH) and equal lows (EQL) when sweeps occur, marking where price probed above/below prior liquidity and then rejected.
Optional volume filter to ignore low volume swings and focus on more meaningful liquidity zones.
🔸 Premium, Discount, and Equilibrium
The premium and discount view provides a simple contextual map of where price is trading within a measured range, alongside an optional equilibrium line as a midpoint reference. This is intended as a higher level framing tool to help you avoid treating every price location the same, especially when combining structure with reaction zones. Price labels can be enabled for quick orientation, and the display updates as the underlying range evolves.
Projects premium and discount bands based on a dynamically measured range, offering a simple view of where price is trading relative to that range.
Draws separate Premium and Discount boxes with optional price labels for quick orientation.
Optional mid line (equilibrium) to visualize the “50%” of the current range, often used as a reference for balanced versus extended price.
Zones auto update as the underlying range evolves, with logic to prevent stale levels from cluttering the chart.
🔸 Trend Channels
When enabled, the trend module draws swing based diagonal structure using trendlines and a channel style visualization. You can tune sensitivity and choose whether the source should be depending on how you prefer to read trend behavior. The channel is maintained dynamically so you can keep directional context without manually drawing and constantly adjusting diagonal lines, and the script can highlight basic break behavior when price pushes beyond the active diagonal reference.
🔸 Swing Failure Pattern (SFP) Detector
The SFP module highlights common swing failure behavior, where price briefly trades beyond a swing level and then reclaims it, often reflecting a liquidity grab followed by rejection. Bullish and bearish SFPs can be enabled independently, and the display is designed to keep the key level and the rejection visible without excessive clutter. Optional volume validation can be used as a filter, so you can choose whether you want the detector to be more permissive or more selective based on participation characteristics.
🔸 HTF Candle Projection Panel
The HTF panel projects a compact set of higher timeframe candles to the right of price, giving you higher timeframe context without switching charts. You can select classic candles or Heikin Ashi style, adjust the scale and spacing, and optionally display reference lines and labels for OHLC values. This is a visual context tool intended to support multi timeframe reading, not a replacement for your own higher timeframe analysis.
In addition to projecting higher timeframe candles, the HTF panel can also detect and visualize higher timeframe liquidity sweeps directly within the projected candle set. The script monitors each completed HTF candle’s high and low and evaluates subsequent HTF candles for sweep behavior i.e., when price briefly trades beyond a prior HTF extreme but fails to hold acceptance beyond it (filtered using the later candle’s body positioning). When a sweep is detected, the panel draws a dotted sweep line and marks the event, allowing you to spot HTF stop runs and failed breaks without switching timeframes. Sweeps are dynamically invalidated if a later HTF candle shows genuine acceptance beyond that level, ensuring the display stays context relevant and avoids stale markings. This turns the HTF projection from a passive visualization into an actionable context layer for identifying HTF liquidity events while executing on lower timeframes.
🔸 Alerts
Alerts are included for the most practical events produced by the overlay, such as structure shifts (CHoCH and BoS), liquidity sweeps, new and invalidated zones, price approaching recent zones, imbalance creation and mitigation, premium or discount entries, trendline events, and SFP detections. The alerts are designed to function as a monitoring layer so you can be notified when something changes in your mapped context, rather than acting as standalone trade instructions.
🔸 Originality & Usefulness
This script is not a collection of separate SMC drawings layered on top of price. It is built as a unified price action engine where market structure, order blocks, inefficiencies, and liquidity are produced from the same evolving state. That matters because most SMC indicators treat these concepts as independent overlays, which often leads to contradictory markings and excessive clutter. Here, the design priority is consistency and readability: modules update in sync, older elements are managed, and the chart stays usable during live conditions.
A key differentiator is the internal swing logic, which functions like a compact zigzag style structure engine. Instead of reacting to every minor fluctuation, it aims to focus on meaningful swing decisions and treat structure as a sequence. This reduces repetitive labeling and makes structural transitions easier to follow. Structure events are anchored to the swing that defined them and are designed to trigger in a clean, non spammy way, which is critical for anyone who uses structure as a workflow backbone.
The structure layer is intentionally narrative oriented. It separates a transition event from continuation events, so CHoCH is used to highlight the first meaningful shift after an established leg, while BoS is used to mark follow through in the same direction. This is not a prediction claim. It is a clarity feature that helps users read “phase changes” versus “continuation” without constantly second guessing whether the script is just printing noise.
Order blocks are where this script becomes especially distinctive compared to typical SMC tools. Instead of drawing identical rectangles, each block is rendered with an internal gauge that communicates participation and directional dominance at a glance. The zone is visually segmented to reflect bullish and bearish pressure components, and it also carries a volume readout plus a relative weight compared to other recent blocks. This creates a ranked view of blocks rather than an unfiltered pile. In practice, you can prioritize zones faster because the script surfaces which blocks had more meaningful participation and whether the internal push looked one sided or mixed. The result is less subjective filtering and a cleaner chart.
Imbalances are handled as structured inefficiency zones with clear references and optional context. Beyond drawing the zone and midpoint, the script can overlay a sentiment style gauge that divides the imbalance into bullish and bearish portions and updates as new data comes in. The practical value is that you can see whether an inefficiency remains strongly one sided or is gradually being balanced. This turns imbalances from static boxes into a living context layer, which is particularly useful when you monitor reactions over time instead of treating every touch the same.
Liquidity is treated as an event driven tracking system rather than simple pivot plotting. Liquidity pools are identified from swing behavior and can be gated through a participation filter so the script focuses on levels that formed with meaningful activity rather than low quality noise. Once tracked, levels are monitored for outcomes like sweeps and equal high/low behavior, and then updated or retired when they are decisively resolved. This prevents the display from accumulating stale levels and keeps the liquidity layer focused on what is still relevant now.
Swing failure patterns are integrated as selective events rather than continuous spam. The intent is to produce fewer but more structurally meaningful SFPs, aligned with the liquidity narrative, instead of printing clusters around the same price area. This keeps the pattern readable and reinforces the “event based” design philosophy across the script.
Higher timeframe context is supported through a compact HTF projection panel that provides quick orientation without forcing constant timeframe switching. It lets you see where current price action sits inside a larger timeframe candle and range, which helps maintain consistency when you are executing on a lower timeframe but respecting higher timeframe structure.
Disclaimer: This indicator is for educational and analytical purposes only. It does not provide financial advice, and it does not guarantee results.
🔹 How to Use
This tool is designed to support multiple trading styles, but it is most effective when you treat it as a top down mapping and decision support tool. A practical workflow looks like this.
1) Establish higher timeframe bias and context
Start on your reference timeframe such as H4 or Daily and read the market’s dominant story first. Use the Market Structure Engine to identify whether the market is in continuation mode or transition mode. The goal is to avoid executing lower timeframe ideas that conflict with the larger structure narrative.
Use the HTF Candle Projection Panel as a fast orientation aid. It helps you judge whether current price is building acceptance near the highs of the larger candle, rotating back toward its open, or rejecting from its extremes. This is especially useful when you execute on lower timeframes but want to stay aligned with higher timeframe positioning.
Add Premium and Discount framing to understand location. When price is trading in premium, continuation longs are often more selective and require stronger confirmation, while shorts may have better location if structure supports it. When price is in discount, the opposite applies. Treat this as location context, not a rule.
2) Map your key reaction zones with prioritization
Next, build your map of where reactions are most likely to occur. Enable Order Blocks with Volumetric Insight to highlight the most relevant origin zones that form after important structure events. Keep your focus on the most recent blocks and adjust the visible depth so the chart stays clean.
Use the internal gauge and participation readouts to prioritize. Instead of treating every zone as equal, treat higher participation blocks as primary candidates and lower participation blocks as secondary. The bullish and bearish split inside the gauge helps you quickly judge whether the zone formed from a clearly one sided push or a more mixed move, which can inform how strict you want to be with confirmation on a retest.
If you use Breaker Blocks, treat them as role shift zones. They are especially useful when the market has clearly transitioned and you want to track where a previously defended origin area may become a meaningful retest level later.
3) Layer in inefficiencies only where they add clarity
If your workflow includes imbalances, add them selectively to avoid visual overload. Use Fair Value Gaps, Volume Imbalances, or Opening Gaps as secondary reaction areas that often sit inside, near, or between larger zones.
If you enable the internal sentiment gauge, read it as context rather than a signal. It is meant to help you see whether the imbalance remains one sided or has started to balance out as price develops. A strongly one sided presentation can support the idea of continuation through the zone, while a more balanced presentation can support the idea of deeper mitigation or chop. Use it to refine expectations, not to force entries.
4) Track liquidity as events, not as static levels
Enable Liquidity Sweeps and EQH/EQL tagging to highlight where resting liquidity is likely concentrated and when it gets taken. The main value here is narrative: you can see when price runs obvious highs or lows and whether it immediately rejects back into structure or accepts beyond the level.
If you use the volume filter, treat it as a quality gate. The point is to ignore small, low participation swings and keep the liquidity layer focused on levels that formed with meaningful activity. This tends to reduce noise and makes sweeps and equal level behavior more relevant.
Combine the liquidity layer with the Swing Failure Pattern detector to isolate moments where liquidity is taken and then rejected. The cleanest use is when SFPs occur at or near your pre mapped reaction zones, after a sweep, and in alignment with your higher timeframe bias.
5) Refine execution timing on your entry timeframe
Drop to your execution timeframe and use local structure shifts as timing tools. CHoCH and BoS on the lower timeframe can help you see when micro structure is flipping in your intended direction after price interacts with your mapped zone.
If you use the Trend Channel framework, treat it as diagonal context rather than strict support and resistance. A channel helps you see where price is riding the trend and where it is deviating. This can help you time entries by waiting for price to re enter the corridor, show rejection near a boundary, or confirm a shift by building structure outside the channel.
A common practical sequence is: price reaches a mapped OB or imbalance area, liquidity gets taken, price rejects, micro structure begins to flip, and then you execute with your own confirmation and risk rules. The tool helps you see each step clearly, but your plan determines what is sufficient confirmation.
6) Use alerts as monitoring, not as standalone signals
Set alerts only for events that are meaningful to your workflow, such as:
-fresh CHoCH or BoS in your preferred direction
-new or invalidated order blocks and breaker blocks
-price approaching the most recent priority zones
-liquidity sweeps and EQH/EQL interactions
-new SFP events
-entry into premium or discount and interaction with HTF projection levels
-imbalance creation, mitigation, or approach
Treat alerts as prompts to check the chart, not as automatic entries or exits. This script is designed as a mapping and decision support tool. Trade execution, confirmation, and risk management remain entirely dependent on your own strategy and discretion.
🔴 Price Action Practical Notes
💠 Market structure
Market structure is the framework used to describe how price organizes itself into swings. It is built from successive swing highs and swing lows, and it is used to decide whether the market is expanding upward, expanding downward, or transitioning. A practical structure model focuses on “meaningful” turning points rather than every minor fluctuation, because the goal is to capture intent and flow, not noise.
💠 Swing highs and swing lows
A swing high is a local peak where price stops advancing and begins to rotate lower, while a swing low is a local trough where selling pressure pauses and price rotates higher. Swings matter because many traders anchor risk, liquidity, and entries around them. The stronger the reaction away from a swing, the more likely it is to be referenced again as a decision point.
💠 Break of structure
A break of structure is the event where price decisively exceeds a prior swing in the direction of the prevailing move. In practice, it is used as confirmation that a directional leg is still active and that liquidity resting beyond the swing has been taken. This concept is less about predicting and more about validating continuation.
💠 Change of character
A change of character is a structural break that signals transition rather than continuation. Instead of breaking a swing in the same direction as the recent trend, price breaks a key swing in the opposite direction, suggesting that control may be shifting. It is often treated as an early warning that the market may be moving from continuation into reversal or deeper pullback conditions.
💠 Order blocks
An order block is commonly described as the last opposing candle or consolidation zone that precedes a strong directional expansion. The idea is that this area represents a footprint of aggressive execution and unfilled interest. When price revisits it later, it can act as a reaction zone because participants who missed the move may defend it, or because remaining orders may still exist there.
💠 Mitigation and invalidation of a zone
Mitigation describes the process of price returning to a zone and “consuming” the remaining interest there. A zone is typically considered invalidated when price trades through it in a way that implies the resting orders were absorbed and the area no longer has protective value. Some approaches treat a wick through the boundary as enough to invalidate, while others require a candle close beyond the boundary to confirm that the level has truly failed.
💠 Breaker blocks
A breaker block is an order block concept that changes role after being invalidated. When a previously respected zone fails, it can later become a reaction area in the opposite direction because trapped participants may use the retest to exit, or because the market may recognize it as a new supply or demand reference. Breakers are often treated as “failed zones that become liquidity magnets” and are closely watched on retests.
💠 Liquidity and liquidity pools
Liquidity is the availability of resting orders that allow large transactions to execute with minimal slippage. In chart terms, liquidity pools often form around obvious swing highs and lows, equal highs and lows, and clear ranges. These areas attract price because they contain clustered stops and entries that can be used to fuel continuation or trigger reversals through rapid order flow shifts.
💠 Liquidity sweeps
A liquidity sweep is a move where price briefly trades beyond a known liquidity pool and then returns back inside, often closing back within the prior range. The concept implies that stops were triggered and liquidity was captured, but that continuation beyond the swept level did not sustain. Sweeps are frequently used as context for reversals or for confirming that a “cleanout” occurred before a directional move.
💠 Equal highs and equal lows
Equal highs and equal lows describe repeated swing levels that form a flat or nearly flat top or bottom. They matter because they concentrate liquidity. Many traders place stops just beyond these repeated levels, and many breakout traders place entries around them. The result is a dense cluster of orders that can be targeted efficiently by price.
💠Imbalances and inefficiencies
Imbalances represent zones where price moved so quickly that it left behind inefficient trading, meaning fewer transactions occurred in that region compared to surrounding areas. The underlying idea is that markets often revisit these areas to rebalance, fill gaps, or complete unfinished business. Imbalances are treated as areas of interest for pullback entries, targets, or reaction zones.
💠 Fair value gap
A fair value gap is a specific form of imbalance commonly framed as a three candle displacement that leaves a gap between candles, indicating rapid repricing. Traders use it as a proxy for inefficiency: if price returns, it may partially or fully fill the gap before continuing. The midpoint of the gap is often treated as a particularly relevant reference, but whether price respects it depends on context.
💠 Inverted fair value gap
An inverted fair value gap is the idea that once an imbalance is “broken” in a meaningful way, the zone can flip its behavior. Instead of acting like a supportive zone, it may become resistive (or vice versa) on a later retest. Conceptually, this is similar to role reversal: what once behaved as a continuation aid can become a rejection zone after failure.
💠 Premium, discount, and equilibrium
Premium and discount describe where price sits relative to a defined recent range. Premium is the upper portion of that range and discount is the lower portion. Equilibrium is the midpoint. The concept is mainly used to align trade direction with location: buying is generally more attractive in discount and selling is generally more attractive in premium, assuming you are trading mean reversion within a range or seeking favorable risk placement within a broader trend.
💠 Swing failure pattern
A swing failure pattern is a reversal archetype where price breaks a known swing level, fails to hold beyond it, and returns back through the level. The logic is that the breakout attempt attracted orders and triggered stops, but the market rejected the extension. SFPs are often considered higher quality when the failure is followed by a decisive move away and when it aligns with a broader liquidity narrative.
💠 Higher timeframe context
Higher timeframe context means framing intraday or lower timeframe signals within the structure of a larger timeframe. This can include aligning trades with higher timeframe swings, using higher timeframe candles as reference for open/high/low behavior, and avoiding taking counter trend signals when the larger timeframe is strongly directional. The purpose is to improve signal quality by ensuring the smaller timeframe idea is not fighting a dominant larger flow.
💠 Trend channels
A trend channel is a structured way to visualize a market’s directional “lane” by framing price between two roughly parallel boundaries. The central idea is that trending price action often oscillates in a repeatable corridor: pullbacks tend to stall around one side of the lane, while impulses tend to extend toward the opposite side. Instead of treating trend as a single line, a channel treats trend as an area, which better reflects real market behavior where reactions occur in zones rather than at perfect prices.
A channel typically has three functional references: a guiding line that represents the prevailing slope, an upper boundary that approximates where bullish expansions tend to stretch before mean reversion, and a lower boundary that approximates where bearish pullbacks tend to terminate before continuation. The space between boundaries represents the market’s accepted path. When price stays inside this corridor, the trend is considered healthy. When price repeatedly fails to progress within it, the trend is weakening.
Channels are commonly used for timing and location. In an uptrend channel, pullbacks into the lower portion of the corridor are often treated as higher quality “location” for continuation attempts, while pushes into the upper portion are treated as extension territory where risk of a pause or retracement increases. In a downtrend channel, the logic is mirrored: rallies into the upper portion are often treated as sell side location, and moves into the lower portion are treated as extension territory. The channel does not predict direction by itself; it provides a disciplined map for where continuation is more likely versus where momentum is more likely to cool.
A key concept is acceptance versus deviation. If price briefly pierces a boundary and snaps back inside, that is often interpreted as a deviation, meaning the market tested outside the lane but did not accept it. If price holds outside the corridor and begins to build new swings there, that suggests acceptance and a potential regime change: either a new channel with a different slope, a shift into range, or a broader reversal context. This is why channels are most useful when you treat them as a framework for evaluating behavior, not as rigid support and resistance.

Orderblock Footprints [AlgoAlpha]🟠 OVERVIEW
This script highlights orderblocks and then drills into what actually trades inside them. Zones are created only after an abnormal directional impulse, measured with a z-score on consecutive candle bodies, so the orderblocks are tied to real expansion rather than simple pivots. Once a zone exists, the script overlays lower-timeframe volume footprints inside the candle when price trades back into that zone. The goal is to show not just where an orderblock sits, but whether price is being accepted or absorbed when it is revisited.
🟠 CONCEPTS
Orderblocks are detected after extreme bullish or bearish impulses. The script tracks consecutive body movement up or down, normalizes that distance with a rolling z-score, and only triggers when the move is statistically large. The last opposite candle before that impulse defines the orderblock range. These zones then extend forward until they are either mitigated by price closing through them or they expire by age.
Inside an active zone, the script switches to a lower timeframe and builds a footprint-style profile for each bar. Each candle is split into price rows, counting time-at-price and volume delta. Positive and negative delta are colored separately. Absorption is flagged when opposing delta prints appear in the wick that rejects the zone. In practice: the impulse defines context ; the footprint shows interaction .
🟠 FEATURES
Separate bullish and bearish zones with automatic extension
Volume split inside each zone candle (up vs down volume)
Lower-timeframe footprint with TPO-style rows and delta gradient
Absorption detection using opposing delta in rejection wicks
Alerts for zone creation and absorption events
🟠 USAGE
Setup : Add the script to your chart. It works on any market and timeframe. The lower timeframe for footprints is fixed at 5 minutes, so higher chart timeframes show clearer structure. Use the Z-Score Window to control how strict impulse detection is and Max Box Age to limit how long old zones stay on the chart.
Read the chart : Bullish orderblocks are created after strong upward impulses and are invalidated when price closes below them. Bearish orderblocks are created after strong downward impulses and are invalidated when price closes above them. When price trades inside a zone, footprint rows appear. Green-tinted rows show positive delta; red-tinted rows show negative delta. Absorption labels appear when opposing delta prints into a rejecting wick.
Settings that matter : Increasing the Z-Score Window makes orderblocks rarer but more significant. Disabling Prevent Overlap allows stacked zones if you want to study clustering. Adjusting Rows per bar changes footprint resolution—lower values are cleaner, higher values show more detail but use more objects.

SMC-Math by Thomas v1📌 SMC-Math by Thomas v1 — Description
SMC-Math by Thomas v1 is a complete Smart Money Concepts toolkit designed for traders who want a clean, mathematical, and structured view of market mechanics.
Rather than relying on abstract concepts or subjective drawings, this indicator focuses on rules-based detection of:
✔ Order Blocks (OB)
✔ Fair Value Gaps (FVG)
✔ Market Structure shifts (BoS / CHoCH)
✔ HTF trend confirmation
✔ Premium / Discount arrays
✔ Equal High & Equal Low Liquidity Zones (no hinting — expiry only)
This version is engineered for stability, clarity, and performance — with fully optimized array management, timestamp-based cleanup, and a clean visual presentation suitable for both discretionary and systematic trading.
📌 Key Features
🔹 1. Order Blocks (Bullish & Bearish)
Auto-detected using fractal swing highs/lows
Optional displacement + high volume filters
Midline display option
HTF trend alignment filter
Smart expiry + broken OB cleanup
Custom opacity, buffer, and extension controls
🔹 2. Fair Value Gaps (FVG)
Bullish and bearish gap detection
HTF confirmation-based dimming
No border for a clean ICT-style visuals
Auto remove when filled
Fully rule-based
🔹 3. Market Structure (BoS / CHoCH)
Based on fractal highs/lows
Automatic labeling (small, unobtrusive)
Direction validated by HTF option
Each structure level plotted with a projected line
Smooth, clean BOS/CHOCH flow
🔹 4. Premium / Discount Zones
Auto-calculated from most recent swing high & swing low
Box shading dynamically updates each bar
Helps identify optimal trade areas (OB → FVG → PD array)
🔹 5. Liquidity Zones (Equal Highs & Equal Lows)
This tool highlights where liquidity is likely resting:
Detects Equal Highs and Equal Lows using your tolerance or max difference
Auto-creates borderless shaded boxes
Adjustable box height and extension
NO hinting logic — the box remains for exactly cleanupDelay bars, then expires
Clean and predictable behavior, ideal for rule-based setups
This is especially useful for:
identifying buy-side and sell-side liquidity pools
anticipating runs on liquidity
targeting sweeps
🔹 6. HTF Status Panel
Shows higher-timeframe trend status on the live bar:
Bullish
Bearish
Or “HTF Not Required”
Useful for aligning entries with larger market flow.
📌 How to Use SMC-Math by Thomas v1
1️⃣ Identifying Direction
Start by reading:
HTF Trend Label
BOS & CHOCH reactions
Bullish: look for HL → HH structure + bullish OBs + bullish FVGs
Bearish: look for LH → LL structure + bearish OBs + bearish FVGs
This creates your directional bias.
2️⃣ Using Order Blocks
An OB is valid when:
It appears in line with structure
HTF alignment supports it (optional toggle)
Price returns after a displacement
OB is not “broken” (indicator handles this visually)
Use OBs as:
Rebalance targets
Entry areas
Stop placement logic
3️⃣ Fair Value Gaps
FVGs appear when price dislocates and leaves inefficiency.
Use them to:
Refine entries inside OBs
Project premium/discount zones
Identify continuation zones
The indicator auto-removes FVGs when filled.
4️⃣ Liquidity Zones
Liquidity zones identify resting orders at equal highs/lows.
This version uses simple expiry logic:
Box is created when EQH/EQL forms
It remains visible for 20 bars (default)
It disappears automatically after expiry
No hint/confirmation triggers deletion
Usage tips:
Expect price to run toward these zones
Use them as targets or continuation markers
Combine with OB/FVG for confluence
5️⃣ Premium / Discount Zones
Use PD arrays to gauge:
Premium = optimal shorting zones
Discount = optimal long zones
Not trade “in the middle” unless a clear BOS or CHoCH happens
📌 Recommended Workflow
HTF Bias → Check the HTF panel
Market Structure → Identify trend continuation or reversal
Liquidity → Mark where price is likely to target
FVG → Identify imbalance zones
OB → Confirm institutional origin points
PD Arrays → Determine optimal trade location
Execute with confluence
📌 Who Is This Indicator For?
✔ Traders using ICT / SMC logic
✔ Traders wanting rule-based, non-subjective markups
✔ Traders who want automated detection without repainting
✔ Anyone who uses OB, FVG, liquidity sweeps, and structure shifts

SMC N-Gram Probability Matrix [PhenLabs]📊 SMC N-Gram Probability Matrix
Version: PineScript™ v6
📌 Description
The SMC N-Gram Probability Matrix applies computational linguistics methodology to Smart Money Concepts trading. By treating SMC patterns as a discrete “alphabet” and analyzing their sequential relationships through N-gram modeling, this indicator calculates the statistical probability of which pattern will appear next based on historical transitions.
Traditional SMC analysis is reactive—traders identify patterns after they form and then anticipate the next move. This indicator inverts that approach by building a transition probability matrix from up to 5,000 bars of pattern history, enabling traders to see which SMC formations most frequently follow their current market sequence.
The indicator detects and classifies 11 distinct SMC patterns including Fair Value Gaps, Order Blocks, Liquidity Sweeps, Break of Structure, and Change of Character in both bullish and bearish variants, then tracks how these patterns transition from one to another over time.
🚀 Points of Innovation
First indicator to apply N-gram sequence modeling from computational linguistics to SMC pattern analysis
Dynamic transition matrix rebuilds every 50 bars for adaptive probability calculations
Supports bigram (2), trigram (3), and quadgram (4) sequence lengths for varying analysis depth
Priority-based pattern classification ensures higher-significance patterns (CHoCH, BOS) take precedence
Configurable minimum occurrence threshold filters out statistically insignificant predictions
Real-time probability visualization with graphical confidence bars
🔧 Core Components
Pattern Alphabet System: 11 discrete SMC patterns encoded as integers for efficient matrix indexing and transition tracking
Swing Point Detection: Uses ta.pivothigh/pivotlow with configurable sensitivity for non-repainting structure identification
Transition Count Matrix: Flattened array storing occurrence counts for all possible pattern sequence transitions
Context Encoder: Converts N-gram pattern sequences into unique integer IDs for matrix lookup
Probability Calculator: Transforms raw transition counts into percentage probabilities for each possible next pattern
🔥 Key Features
Multi-Pattern SMC Detection: Simultaneously identifies FVGs, Order Blocks, Liquidity Sweeps, BOS, and CHoCH formations
Adjustable N-Gram Length: Choose between 2-4 pattern sequences to balance specificity against sample size
Flexible Lookback Range: Analyze anywhere from 100 to 5,000 historical bars for matrix construction
Pattern Toggle Controls: Enable or disable individual SMC pattern types to customize analysis focus
Probability Threshold Filtering: Set minimum occurrence requirements to ensure prediction reliability
Alert Integration: Built-in alert conditions trigger when high-probability predictions emerge
🎨 Visualization
Probability Table: Displays current pattern, recent sequence, sample count, and top N predicted patterns with percentage probabilities
Graphical Probability Bars: Visual bar representation (█░) showing relative probability strength at a glance
Chart Pattern Markers: Color-coded labels placed directly on price bars identifying detected SMC formations
Pattern Short Codes: Compact notation (F+, F-, O+, O-, L↑, L↓, B+, B-, C+, C-) for quick pattern identification
Customizable Table Position: Place probability display in any corner of your chart
📖 Usage Guidelines
N-Gram Configuration
N-Gram Length: Default 2, Range 2-4. Lower values provide more samples but less specificity. Higher values capture complex sequences but require more historical data.
Matrix Lookback Bars: Default 500, Range 100-5000. More bars increase statistical significance but may include outdated market behavior.
Min Occurrences for Prediction: Default 2, Range 1-10. Higher values filter noise but may reduce prediction availability.
SMC Detection Settings
Swing Detection Length: Default 5, Range 2-20. Controls pivot sensitivity for structure analysis.
FVG Minimum Size: Default 0.1%, Range 0.01-2.0%. Filters insignificant gaps.
Order Block Lookback: Default 10, Range 3-30. Bars to search for OB formations.
Liquidity Sweep Threshold: Default 0.3%, Range 0.05-1.0%. Minimum wick extension beyond swing points.
Display Settings
Show Probability Table: Toggle the probability matrix display on/off.
Show Top N Probabilities: Default 5, Range 3-10. Number of predicted patterns to display.
Show SMC Markers: Toggle on-chart pattern labels.
✅ Best Use Cases
Anticipating continuation or reversal patterns after liquidity sweeps
Identifying high-probability BOS/CHoCH sequences for trend trading
Filtering FVG and Order Block signals based on historical follow-through rates
Building confluence by comparing predicted patterns with other technical analysis
Studying how SMC patterns typically sequence on specific instruments or timeframes
⚠️ Limitations
Predictions are based solely on historical pattern frequency and do not account for fundamental factors
Low sample counts produce unreliable probabilities—always check the Samples display
Market regime changes can invalidate historical transition patterns
The indicator requires sufficient historical data to build meaningful probability matrices
Pattern detection uses standardized parameters that may not capture all institutional activity
💡 What Makes This Unique
Linguistic Modeling Applied to Markets: Treats SMC patterns like words in a language, analyzing how they “flow” together
Quantified Pattern Relationships: Transforms subjective SMC analysis into objective probability percentages
Adaptive Learning: Matrix rebuilds periodically to incorporate recent pattern behavior
Comprehensive SMC Coverage: Tracks all major Smart Money Concepts in a unified probability framework
🔬 How It Works
1. Pattern Detection Phase
Each bar is analyzed for SMC formations using configurable detection parameters
A priority hierarchy assigns the most significant pattern when multiple detections occur
2. Sequence Encoding Phase
Detected patterns are stored in a rolling history buffer of recent classifications
The current N-gram context is encoded into a unique integer identifier
3. Matrix Construction Phase
Historical pattern sequences are iterated to count transition occurrences
Each context-to-next-pattern transition increments the appropriate matrix cell
4. Probability Calculation Phase
Current context ID retrieves corresponding transition counts from the matrix
Raw counts are converted to percentages based on total context occurrences
5. Visualization Phase
Probabilities are sorted and the top N predictions are displayed in the table
Chart markers identify the current detected pattern for visual reference
💡 Note:
This indicator performs best when used as a confluence tool alongside traditional SMC analysis. The probability predictions highlight statistically common pattern sequences but should not be used as standalone trading signals. Always verify predictions against price action context, higher timeframe structure, and your overall trading plan. Monitor the sample count to ensure predictions are based on adequate historical data.

SMC + OB + FVG + Reversal + UT Bot + Hull Suite – by Fatich.id🎯 7 INTEGRATED SYSTEMS:
✓ Mxwll Suite (SMC + Auto Fibs + CHoCH/BOS)
✓ UT Bot (Trend Signals + Label Management)
✓ Hull Suite (Momentum Analysis)
✓ LuxAlgo FVG (Fair Value Gaps)
✓ LuxAlgo Order Blocks (Volume Pivots) ⭐ NEW
✓ Three Bar Reversal (Pattern Recognition)
✓ Reversal Signals (Momentum Count Style)
⚡ KEY FEATURES:
• Smart Money Structure (CHoCH/BOS/I-CHoCH/I-BoS)
• Auto Fibonacci (10 customizable levels)
• Order Block Detection (Auto mitigation)
• Fair Value Gap Tracking
• Session Highlights (NY/London/Asia)
• Volume Activity Dashboard
• Multi-Timeframe Support
• Clean Label Management
🎨 PERFECT FOR:
• Smart Money Concept Traders
• Order Flow & Liquidity Analysis
• Support/Resistance Trading
• Trend Following & Reversals
• Multi-Timeframe Analysis
💡 RECOMMENDED SETTINGS:
Clean Charts: OB Count 3, UT Signals 3, FVG 5
Detailed Analysis: OB Count 5-10, All Signals
Scalping: Low sensitivity, Hull 20-30
Swing Trading: High sensitivity, Hull 55-100

Orderblocks MTF Pro (4 HTFs + Alerts) - (@JP7FX)Orderblocks MTF Pro (JP7FX)
Orderblocks MTF Pro identifies higher timeframe orderblocks and displays them on lower timeframe charts. It tracks when new orderblocks form, remain active or become mitigated.
Higher Timeframe Orderblocks
The indicator can display orderblocks from four higher timeframes at the same time.
Users can select which HTFs to show, such as Daily, 4H, 1H and 15m.
Bullish and Bearish Orderblocks
Bullish orderblocks mark areas where buying pressure formed during prior moves.
Bearish orderblocks mark areas where selling pressure formed.
Each block is colour coded and can be customised.
Mitigation Tracking
The tool monitors when price returns to a previously formed orderblock.
If price trades back into the block, the indicator can mark it as mitigated or keep it highlighted as active depending on user settings.
Alerts
Alert conditions are included for:
• New orderblock creation
• Orderblock mitigation
Users can enable or disable alerts for each timeframe.
Customisation
• Choose up to four higher timeframes to display
• Custom colours for bullish and bearish blocks
• Visibility filters for active and mitigated blocks
• Adjustable opacity and block display style
Use Cases
Suitable for traders who reference higher timeframe zones while executing on lower timeframes.
The indicator reduces manual chart work by identifying and updating HTF orderblocks automatically.

White Crow**White Crow — cluster reversal signals + market structure**
> Indicator that helps you read market structure (pivots, trend, last extremes) and spot potential reversals through CCI/RSI signal clusters. This is *not* a standalone trading system and does not guarantee any result — it is a tool for filtering and confirming your own market ideas.
---
## 1. Concept
White Crow combines three core blocks:
1. **Pivots & market structure**
Automatically detects **local tops/bottoms** and derives a *Bullish / Bearish / Sideways* bias from them.
In the top-right corner you see a compact panel with current trend and **Last Bottom / Last Top** prices.
2. **Momentum & overbought/oversold zones**
Inside, the indicator uses:
* **CCI** with fixed levels `+100 / -100`;
* an optional **RSI filter** with overbought/oversold levels (`80 / 20`).
These generate basic *Buy / Close* signals.
3. **Cluster signals Buy X / CloseV**
The script tracks **clusters of signals inside a 4-bar window** and highlights rarer, “amplified” events:
* **Buy X** — cluster buy signal (multiple buy conditions in a row);
* **CloseV** — cluster signal for exit/reversal.
**Buy X and CloseV are the strongest and most reliable signals in this indicator** because they are based on repeated conditions rather than a single bar. They work **best on higher timeframes (1H–4H)**, where they reflect meaningful shifts in order flow instead of noise.
> ⚠️ Important: Buy X and CloseV are *only signals*. They must be used as **one of several confirmation factors** for your own view of market structure (support/resistance, trend, price action, volume, etc.), not as standalone reasons to enter or exit trades.
---
## 2. How it works
### 2.1. Pivots and trend detection
* The indicator builds a **zigzag-like structure**:
after a local high, once price retraces down by a given percentage (`pivotSigma`), a **Top** is marked;
after a local low, once price retraces up by the same percentage, a **Bottom** is marked.
* Using the sequence of recent tops and bottoms, the script determines the trend:
* *Bullish* — the last low is higher than the previous one (HL);
* *Bearish* — the last high is lower than the previous one (LH);
* otherwise — *Sideways*.
* The info table shows:
* **Market Trend** — Bullish / Bearish / Sideways;
* **Last Bottom / Last Top** with adaptive decimal precision (works for crypto, FX, stocks, etc.).
### 2.2. Base Buy / Close signals
* **Long condition (Buy):**
* `CCI < -100` (oversold),
* if RSI filter is enabled — `RSI < 20`.
* **Short/Exit condition (Close):**
* `CCI > +100` (overbought),
* if RSI filter is enabled — `RSI > 80`.
These conditions generate the regular **Buy** and **Close** labels on the chart.
### 2.3. Clusters: Buy X and CloseV
To reduce noise, the indicator evaluates not only the current bar, but also the **last 4 bars**:
* `buy_count` — how many times the long condition was true within the last 4 bars;
* `sell_count` — how many times the short condition was true within the last 4 bars.
Then:
* **Buy X** appears when:
* `buy_count ≥ 2` (conditions for Buy were met on at least 2 of the last 4 bars),
* the time filter between two Buy X signals is satisfied (`Min Bars Between Signals`).
* **CloseV** appears when:
* `sell_count ≥ 2`,
* the required number of bars has passed since the previous CloseV.
> ✅ This is why **Buy X / CloseV are stronger and more trustworthy than single Buy/Close signals**, especially on **1H–4H** timeframes: the market confirms the same overbought/oversold condition several times in a row.
### 2.4. Order Blocks
* When `Show Order Blocks` is enabled, the indicator highlights **impulsive candles** whose body exceeds a threshold based on ATR.
* Colored rectangles mark **potential order blocks** (areas where strong buying or selling previously occurred).
## 3. Inputs and customization
Inputs are grouped in TradingView-friendly categories.
### 3.1. Pivot Settings
* `Show Pivots` — enable/disable **Top / Bottom** markers.
* `Sigma (% retracement)` — pivot sensitivity (minimum retracement in % required to confirm a pivot).
* Colors for Top/Bottom — for visual tuning.
**Tip:**
On H1–H4 you can keep near-default values.
On lower timeframes, reduce `Sigma` if you want more detailed local structure.
### 3.2. CCI / RSI Settings
* `CCI Period` — CCI length (short by default for faster reaction).
* `Enable RSI Filter` / `RSI Period` — toggle and length for RSI filter.
* RSI levels are fixed at **20 / 80** to mark strong oversold/overbought zones.
**Usage:**
* For more conservative entries — keep the RSI filter enabled.
* For more frequent signals (e.g. scalping) — you can disable the RSI filter.
### 3.3. Order Blocks
* `Show Order Blocks` — display order block zones.
* `Block Threshold (ATR multiplier)` — how large a candle must be (vs ATR) to be considered significant.
### 3.4. Signals & Filters
* `Show Buy / Show Buy X / Show Close / Show CloseV` — choose which labels you want to see.
* `Enable Time Filter` — enable minimum spacing between amplified signals.
* `Min Bars Between Signals` — how many bars must pass between two Buy X or two CloseV signals.
**Tip:**
If you see too many amplified signals, increase `Min Bars Between Signals`.
If you want more activity, decrease it.
### 3.5. Alerts
* `Buy Alerts / Buy X Alerts / Close Alerts / CloseV Alerts` — choose which signal types should trigger alerts.
* `One Alert Per Bar` — when enabled, alerts are triggered only once per bar (recommended for H1–H4).
Alerts are generated via `alert()`, with messages that include signal type, ticker, timeframe and current price.
---
## 4. How to trade with White Crow
### 4.1. Recommended timeframes
* 📌 **Main focus: 1H–4H.**
On these timeframes:
* pivots and trend are more stable;
* CCI/RSI reflect meaningful swings;
* **Buy X / CloseV clusters** filter out a lot of intrabar noise.
You can still experiment on M1–M15, but expect more signals and more sensitivity to noise.
### 4.2. Reading the signals step by step
1. **Start with context**
* Look at **Market Trend / Last Bottom / Last Top** in the info panel.
* See where price is relative to these points: near resistance, near support, inside a range, etc.
2. **Identify zones of interest**
* Use pivots and order blocks as potential support/resistance areas.
* Wait for price to approach these zones.
3. **Watch the signals**
* **Buy** — early sign of local oversold conditions.
* **Buy X** — amplified cluster signal; more weight than a single Buy.
* **Close** — early warning of potential exhaustion in the current move.
* **CloseV** — amplified cluster exit/reversal signal.
4. **Practical approach**
* In a *Bullish* trend:
* focus on **Buy / Buy X** near bottoms and demand blocks;
* use **Close / CloseV** for partial profit-taking or tightening stops.
* In a *Bearish* trend:
* focus on **Close / CloseV** near tops and supply blocks;
* use **Buy / Buy X** mainly for countertrend scalps with strict risk control.
---
## 5. Important notes and disclaimer
1. **Buy X / CloseV are stronger — but not “magic” signals.**
They are statistically more meaningful than single Buy/Close signals because:
* they require multiple confirmations within a cluster;
* they are time-filtered.
However, **false signals are still possible**, especially in news spikes and low-liquidity conditions.
2. **Best performance on higher timeframes (1H–4H).**
Here, Buy X and CloseV usually reflect genuine shifts in supply/demand rather than micro noise.
3. **This is a confirmation tool, not a complete system.**
Pro Trading White Crow:
* does not manage risk;
* does not define position size or stop-loss;
* does not replace your own analysis.
Always use its signals as **one of several confluence factors** together with structure, trend, price action, volume, and your trading plan.
4. **Educational purpose only.**
This script and description are for educational and analytical purposes only.
They **do not constitute investment advice or a guarantee of profit**.
You are fully responsible for all trading decisions and risk management.
---
---
## White Crow — кластерные сигналы разворота + структура рынка
> Индикатор помогает читать рыночную структуру (пивоты, тренд, последние экстремумы) и находить потенциальные развороты через кластеры сигналов CCI/RSI. Это *не* готовая торговая система и *не* гарантия результата — а инструмент для фильтрации и подтверждения ваших собственных идей по рынку.
---
## 1. Концепция
White Crow объединяет три ключевых блока:
1. **Пивоты и структура рынка**
Автоматически находит **локальные вершины и впадины** и на их основе формирует трендовое смещение: *Bullish / Bearish / Sideways*.
В правом верхнем углу — компактная панель с текущим трендом и ценами **Last Bottom / Last Top**.
2. **Моментум и зоны перегрева**
Внутри используются:
* **CCI** с фиксированными уровнями `+100 / -100`;
* опциональный **фильтр RSI** с уровнями перепроданности/перекупленности (`20 / 80`).
По ним строятся базовые сигналы *Buy / Close*.
3. **Кластерные сигналы Buy X / CloseV**
Скрипт отслеживает **кластеры сигналов внутри окна в 4 бара** и выделяет более редкие, «усиленные» события:
* **Buy X** — кластерный сигнал покупки (несколько buy-условий подряд);
* **CloseV** — кластерный сигнал выхода/разворота.
Именно **Buy X и CloseV являются наиболее сильными и достоверными сигналами индикатора**, так как возникают при повторяющемся выполнении условий, а не на одном баре. Лучше всего они работают **на старших таймфреймах (1–4 часа)**, где отражают реальное смещение баланса спроса/предложения, а не рыночный шум.
> ⚠️ Важно: Buy X и CloseV — *это всего лишь сигналы*. Они должны использоваться **как один из факторов подтверждения** вашего видения структуры рынка (уровни, тренд, price action, объём и т.д.), а не как единственная причина для входа или выхода.
---
## 2. Как это работает
### 2.1. Пивоты и определение тренда
* Индикатор строит **структуру в стиле зигзага**:
после локального максимума, когда цена откатывает вниз на заданный процент (`pivotSigma`), отмечается **Top**;
после локального минимума, когда цена откатывает вверх на тот же процент, отмечается **Bottom**.
* По последовательности последних вершин и впадин определяется тренд:
* *Bullish* — последний минимум выше предыдущего (HL);
* *Bearish* — последний максимум ниже предыдущего (LH);
* иначе — *Sideways*.
* В информационной таблице отображаются:
* **Market Trend** — Bullish / Bearish / Sideways;
* **Last Bottom / Last Top** с адаптивным количеством знаков (подходит под крипту, форекс, акции и т.д.).
### 2.2. Базовые сигналы Buy / Close
* **Условие для Buy (лонг):**
* `CCI < -100` (зона перепроданности),
* при включённом фильтре — `RSI < 20`.
* **Условие для Close (шорт/выход):**
* `CCI > +100` (зона перекупленности),
* при включённом фильтре — `RSI > 80`.
По этим условиям индикатор рисует обычные метки **Buy** и **Close**.
### 2.3. Кластеры: Buy X и CloseV
Чтобы отсеять лишний шум, индикатор оценивает не только текущий бар, но и **4 последних бара**:
* `buy_count` — сколько раз условие на покупку выполнялось за последние 4 бара;
* `sell_count` — сколько раз условие на продажу/выход выполнялось за последние 4 бара.
Далее:
* **Buy X** появляется, когда:
* `buy_count ≥ 2` (минимум на 2 из 4 баров были условия для покупки),
* соблюдён фильтр по времени между усиленными сигналами (`Min Bars Between Signals`).
* **CloseV** появляется, когда:
* `sell_count ≥ 2`,
* прошло достаточно баров с момента предыдущего CloseV.
> ✅ Поэтому **Buy X и CloseV заметно сильнее и надёжнее одиночных Buy/Close**, особенно на **таймфреймах 1–4 часа**: рынок несколько раз подряд подтверждает один и тот же перегрев/разрядку момента.
### 2.4. Order Blocks
* При включённом `Show Order Blocks` индикатор выделяет **импульсные свечи**, чьё тело больше заданного множителя ATR.
* По таким свечам строятся цветные прямоугольники — **потенциальные блоки ордеров** (области поддержек/сопротивлений, где ранее проходил крупный объём).
---
## 3. Настройки и кастомизация
Настройки сгруппированы в привычные разделы TradingView.
### 3.1. Pivot Settings
* `Show Pivots` — включить/выключить метки **Top / Bottom**.
* `Sigma (% retracement)` — чувствительность к пивотам (минимальная глубина отката в процентах).
* Цвета Top/Bottom — визуальная настройка.
**Совет:**
На H1–H4 можно оставить значения близкие к стандартным.
На младших ТФ уменьшайте `Sigma`, если нужна более детальная структура.
### 3.2. CCI / RSI Settings
* `CCI Period` — период CCI (по умолчанию короткий, для более быстрой реакции).
* `Enable RSI Filter` / `RSI Period` — включение и длина RSI-фильтра.
* Уровни RSI фиксированы: **20 / 80**, выделяя сильную перепроданность/перекупленность.
**Использование:**
* Для более консервативной торговли — держите фильтр RSI включённым.
* Для более частых сигналов (скальпинг и т.п.) — можно фильтр отключить.
### 3.3. Order Blocks
* `Show Order Blocks` — отображение блоков ордеров.
* `Block Threshold (ATR multiplier)` — насколько большой должна быть свеча относительно ATR, чтобы считаться значимой.
### 3.4. Signals & Filters
* `Show Buy / Show Buy X / Show Close / Show CloseV` — выбор типов отображаемых меток.
* `Enable Time Filter` — включение минимального интервала между усиленными сигналами.
* `Min Bars Between Signals` — сколько баров должно пройти между двумя Buy X или двумя CloseV.
**Совет:**
Если усиленных сигналов слишком много — увеличьте `Min Bars Between Signals`.
Если хотите больше активности — уменьшите это значение.
### 3.5. Alerts
* `Buy Alerts / Buy X Alerts / Close Alerts / CloseV Alerts` — выбор типов сигналов для алертов.
* `One Alert Per Bar` — при включении алерты отправляются один раз на бар (рекомендуется для H1–H4).
Алерты формируются через `alert()` с сообщением, включающим тип сигнала, тикер, таймфрейм и текущую цену.
---
## 4. Как использовать White Crow в торговле
### 4.1. Рекомендуемые таймфреймы
* 📌 **Основной фокус: 1–4 часа.**
На этих ТФ:
* структура по пивотам и тренд более стабильны;
* CCI/RSI отражают существенные ценовые колебания;
* кластеры **Buy X / CloseV** лучше отсеивают шум.
На M1–M15 индикатор тоже можно применять, но нужно быть готовым к большему количеству сигналов и чувствительности к микродвижениям.
### 4.2. Пошаговое чтение сигналов
1. **Начните с контекста**
* Посмотрите на **Market Trend / Last Bottom / Last Top** в панели.
* Определите, где находитесь относительно этих уровней: у сопротивления, у поддержки, внутри диапазона и т.п.
2. **Найдите зоны интереса**
* Используйте пивоты и order blocks как потенциальные области спроса/предложения.
* Ждите подхода цены к этим зонам.
3. **Отслеживайте сигналы**
* **Buy** — ранний признак локальной перепроданности.
* **Buy X** — усиленный кластерный сигнал, более значимый, чем одиночный Buy.
* **Close** — ранний сигнал возможного ослабления текущего движения.
* **CloseV** — усиленный кластерный сигнал выхода/разворота.
4. **Практическое применение**
* В *бычьем* тренде:
* фокус на **Buy / Buy X** возле впадин и зон спроса;
* **Close / CloseV** использовать для частичной фиксации и подтягивания стопа.
* В *медвежьем* тренде:
* фокус на **Close / CloseV** возле вершин и зон предложения;
* **Buy / Buy X** — для аккуратных контртрендовых входов с жестким риском.
---
## 5. Важные замечания и дисклеймер
1. **Buy X / CloseV сильнее, но не «волшебные» сигналы.**
Они статистически более значимы, чем одиночные Buy/Close, потому что:
* требуют нескольких подтверждений в кластере;
* фильтруются по времени.
Однако **ложные срабатывания всё равно возможны**, особенно на новостях и в условиях низкой ликвидности.
2. **Оптимальная область применения — старшие ТФ (1–4 часа).**
Здесь Buy X и CloseV обычно отражают реальное изменение баланса спроса/предложения, а не шум.
3. **Это инструмент подтверждения, а не полноценная система.**
Pro Trading White Crow:
* не управляет рисками;
* не считает размер позиции и уровень стоп-лосса;
* не заменяет ваше собственное видение рынка.
Всегда используйте его сигналы **как один из факторов согласованности** вместе со структурой, трендом, price action, объёмом и персональным торговым планом.
4. **Образовательный характер.**
Скрипт и описание предназначены для обучения и анализа графиков.
Они **не являются инвестиционной рекомендацией и не гарантируют прибыль**.
Вы самостоятельно принимаете все торговые решения и несёте полную ответственность за риск.
---

Flow Dynamics Pro [ChartNation]Flow Dynamics Pro - Institutional Order Flow Zones
Detect high-probability institutional rejection zones with advanced volume analysis and confluence scoring.
Flow Dynamics Pro identifies institutional order flow zones where smart money enters and defends positions. Unlike traditional order blocks or supply/demand indicators, this tool combines multiple confirmation factors into a single confluence score, helping you focus on the highest-quality setups.
🎯 KEY FEATURES
Institutional Zone Detection
Volume spike analysis (customizable threshold)
Rejection wick detection (upper/lower wick ratios)
Market structure validation (swing high/low alignment)
Multi-factor confluence scoring (0-100 scale)
Visual Volume Distribution
Bull/bear volume split displayed inside each zone
See the exact buying vs selling pressure at institutional levels
Percentage breakdowns for quick analysis
Toggle on/off based on preference
Smart Zone Management
Automatic zone invalidation when broken with volume
Zone test tracking (shows how many times zones held)
Visual strengthening (borders thicken after successful tests)
Overlap prevention (maintains minimum spacing between zones)
Maximum zone limit (keeps chart clean)
Confluence Scoring System
Zones are scored 0-100 based on:
Volume Strength (30 points) - How significant was the volume spike
Market Structure (25 points) - Alignment with swing points
Zone Quality (25 points) - Wick ratio and pressure imbalance
Size Quality (20 points) - Optimal zone size relative to ATR
Zones are categorized as:
⚡ PREMIUM (80+) - Highest quality setups
🔥 STRONG (60-79) - Solid institutional zones
✓ MODERATE (40-59) - Valid but lower confluence
Timeframe Adaptive
Automatically adjusts detection sensitivity based on timeframe:
On 1H and lower: Stricter requirements (reduces noise)
On 4H and higher: Standard sensitivity (catches major zones)
Works on all timeframes from 1-minute to Monthly
Multi-Timeframe Context
Display higher timeframe zones for broader market context
Customizable HTF timeframe selection
Dashed visualization to distinguish from current timeframe zones
Comprehensive Alerts
Premium zone created (score 80+)
Price entering zone
Price exiting zone
Zone tested successfully
Zone invalidated
⚙️ SETTINGS OVERVIEW
Detection Settings
Volume Spike Threshold (default: 1.2x)
Minimum Wick Ratio (default: 0.3)
Structure Validation toggle
Detection Lookback period
Invalidation Settings
Require volume for invalidation (toggle)
Invalidation volume threshold (default: 1.2x)
Customizable to match your trading style
Display Settings
Maximum zones to display (default: 8)
Show/hide labels
Show/hide volume data
Volume distribution toggle
Label size adjustment (Small/Normal/Large)
Minimum zone spacing % (prevents overlaps)
Minimum confluence score filter (default: 55)
Visual Customization
Bullish zone color and opacity
Bearish zone color and opacity
Border colors
Multi-timeframe zone colors
📊 HOW TO USE
For Swing Traders (4H, Daily)
Focus on PREMIUM zones (score 80+)
Look for zones with multiple successful tests
Enter on retests with confirmation
Use HTF zones for broader context
For Intraday Traders (1H, 15m)
Use higher confluence minimum (60-65)
Increase zone spacing to reduce clutter
Focus on zones with clear volume distribution
Combine with price action for entries
Zone Test Interpretation
Tested 0x: Fresh zone, untested
Tested 1-2x: Gaining strength
Tested 3+x: Highly defended level (thicker borders)
Volume Distribution Guide
80%+ on one side: Strong directional bias
60-70% dominance: Moderate bias
50-50 split: Contested area, use caution
🔧 BEST PRACTICES
Combine with trend: Trade zones in direction of higher timeframe trend
Wait for confirmation: Don't enter blindly at zone touch
Respect invalidation: When zones break with volume, they're done
Use confluence scores: Prioritize scores 70+ for highest win rate
Manage spacing: Adjust spacing % if chart feels cluttered
Check timeframe: Lower timeframes may need stricter settings
🎓 UNDERSTANDING THE INDICATOR
What are Institutional Zones?
Areas where large players (institutions, market makers, smart money) have entered positions and actively defend them. These show up as:
High volume rejection wicks
Multiple tests that hold
Clear buying/selling pressure imbalance
Why Confluence Scoring?
Not all zones are equal. The 0-100 scoring system helps you quickly identify which zones have the most confirmation factors aligned, saving time and improving trade selection.
Why Zone Spacing Matters
Too many overlapping zones create analysis paralysis. The spacing filter ensures you see only distinct, meaningful levels.
📈 TECHNICAL DETAILS
Indicator Type: Overlay
Max Boxes: 500
Max Labels: 500
Pine Script Version: 6
Real-time Updates: Yes
Alerts: 5 types available
Repainting: Zones finalize on bar close
🚀 GET STARTED
Add indicator to chart
Adjust confluence minimum (55-65 recommended)
Set volume threshold for your instrument (1.2-1.5)
Customize colors to match your theme
Enable alerts for your preferred signals
Trade with proper risk management
💡 TIPS
Start with default settings and adjust based on results
Higher timeframes = more reliable zones
Premium zones (80+) have best risk/reward
Tested zones (3+) show strong institutional defense
Use zone invalidation as stop-loss reference
Flow Dynamics Pro is part of the ChartNation indicator suite - delivering institutional-grade tools for serious traders.

BETradez HTF Order Blocks BETradez HTF Order Blocks identifies and displays order blocks from higher timeframes on your chart. It detects Break of Structure (BOS) events, when price breaks above the highest high or below the lowest low—then scans back up to 200 bars to find the last opposing candle, which becomes the order block zone. The indicator displays up to 5 active order blocks per side (bullish in green, bearish in red), automatically extends them forward in time, and can hide invalidated blocks when price violates them. You can customize the timeframe (use chart or a custom higher timeframe), adjust forward extension, show optional wick lines and center lines, and control label text size. Order blocks often act as support/resistance zones where institutional activity occurred, making them useful for identifying potential entry areas, support/resistance levels, and risk management points in multi-timeframe analysis.

ZynIQ Order Block Master Pro v2 - (Pro Plus Pack)Overview
ZynIQ Order Block Master Pro v2 identifies areas where price showed strong displacement and left behind significant zones of interest. It highlights potential reaction areas, continuation blocks and mitigation zones based on structural behaviour and directional flow.
Key Features
• Automatic detection of bullish and bearish order block zones
• Optional refinement filters for higher-quality zones
• Displacement-aware logic to reduce weak signals
• Optional mitigation markers when price revisits a zone
• Configurable sensitivity for different markets and timeframes
• Clean labels and minimal chart clutter
• Complements structure, liquidity and FVG tools
Use Cases
• Highlighting key reaction areas based on previous strong moves
• Tracking potential continuation or reversal zones
• Combining order blocks with BOS/CHOCH and liquidity mapping
• Building confluence with breakout or volume tools
Notes
This tool provides contextual price zones based on displacement and structural movement. It is not a standalone trading system. Use with your own confirmation and risk management.

Reversal SMC Suite Pro by TradeswithBThe Reversal SMC Suite is an intraday Smart Money Concepts toolkit designed to help traders visually analyze structure, imbalances, and displacement during trending or volatile sessions. This script combines multiple SMC elements—reversals, order blocks, FVGs, HTF bias, and pivot-based support/resistance—into one organized framework to support decision-making.
This indicator does not generate buy or sell signals and does not guarantee results. It is strictly a charting and visualization tool intended to help traders study market behavior.
🔍 Key Features
1. Reversal Detection
Swing Failure Pattern (SFP)
Bullish/Bearish Engulfing
Momentum candle detection (ATR-based)
Optional unified “reversal” signal
Visual arrows and reversal blocks
These are designed to highlight potential turning points based on price behavior—not to predict or guarantee outcomes.
2. HTF Trend Filter
Optional higher timeframe EMA/SMA filter
Customizable HTF resolution
Bias modes: Long only / Short only / Both
This helps you align lower-timeframe reversals with broader market context.
3. Dynamic Order Blocks
Automated OB detection (Body, Wick, or Hybrid)
Smart mitigation logic (body-based or wick-based)
Configurable lookback and OB count
Optional ATR body-size filter for OB quality
Real-time mitigation removal
These tools help visualize areas of interest where price previously showed displacement.
4. Fair Value Gaps (FVG)
Automatic gap detection
Optional FVG extension until filled
Per-side max FVG limit
Useful for identifying imbalance zones and measuring how price revisits inefficiencies.
5. Support / Resistance
Pivot-based S/R with left/right bar settings
Auto-drawing with customizable line counts
Optional S/R visibility toggle
🎛 Presets Included
Several visual configurations are included for convenience:
Custom / Manual (default)
Intraday ORB 5–15m (optimized for fast futures charts)
Clean SMC (Trend + OB)
FVG + OB Combo
Presets adjust inputs automatically to give new users cleaner starting points.
🧠 How To Use
This script is meant to be paired with any strategy or workflow that benefits from:
visual structure analysis,
HTF/LTF alignment,
OB + FVG context, or
intraday trend identification.
It does not replace risk management, strategy rules, or trade planning.
⚠️ Important Notes / Disclaimer
This indicator does not generate trading signals.
No part of this script guarantees profitable outcomes.
It is for educational and informational purposes only.
Always perform your own analysis and use proper risk management.
Past market behavior does not guarantee future results.

Smart Money Toolkit - PD Engine Bias Map [KedArc Quant]Description
Smart Money is an advanced multi-layer Smart Money Concepts framework that automatically detects structure shifts, premium-discount zones, and institutional order flow.
It is built around the PD Engine, which calculates the midpoint of the most recent market swing and dynamically determines BUY or SELL bias based on where current price trades relative to that equilibrium. This toolkit visualizes structure, order blocks, and bias context in one clean map, giving traders an institutional-grade view without unnecessary signal clutter.
Why It Is Unique
- All CHoCH, BOS, Order Block, FVG, and PD logic are coded from scratch.
- Uses true equilibrium (50 percent PD midpoint) for dynamic bias.
- Optimized for stability and non-repainting behavior.
- Designed for clarity with minimal, performance-safe visuals.
Entry and Exit Logic (Discretionary Framework)
- This toolkit is not a signal generator. It provides market context that guides discretionary trading.
BUY Bias (Discount Zone)
- Price trades below PD Mid: the market is in discount.
- Wait for a bullish CHoCH or reaction from a demand OB or FVG before buying.
- Target 1 = PD Mid. Target 2 = next opposite OB or FVG.
SELL Bias (Premium Zone)
- Price trades above PD Mid: the market is in premium.
- Wait for a bearish CHoCH or reaction from a supply OB or FVG before shorting.
- Target 1 = PD Mid. Target 2 = next opposite OB or FVG.
Institutional concept sequence: Bias → Structure Shift → Confirmation → Execution.
Input Configuration
Swing Sensitivity - Determines how far back to identify HH and LL pivots.
OB / FVG Detection - Toggles visual Order Block or Fair Value Gap zones.
PD Engine - Shows PD midpoint line, zone shading, and bias table.
Multi-TF Bias Sync - Optionally reads a higher timeframe bias for confirmation.
Color Themes - Switch between light, dark, or institutional palettes.
Formula / Logic Summary
Concept Formula
PD Mid (Equilibrium) (Recent Swing High + Recent Swing Low) / 2
BUY Bias close < PD Mid
SELL Bias close > PD Mid
CHoCH / BOS Pivot-based structure reversal: HH→LL or LL→HH
Order Block Last bullish or bearish candle before displacement.
FVG Gap between prior candle high/low and next candle range.
These formulas follow the structure used in institutional Smart Money Concepts.
How It Helps Traders
- Shows institutional premium and discount zones visually.
- Defines clear directional bias before entry.
- Combines structure, order blocks, FVG, and equilibrium in one layout.
- Works on any timeframe or asset.
- Prevents emotional trades by giving objective bias context.
Glossary
PD Mid Midpoint between recent swing high and low (market fair value).
Premium Zone Price above PD Mid; sellers control.
Discount Zone Price below PD Mid; buyers control.
CHoCH Change of Character, first reversal signal.
BOS Break of Structure, trend continuation confirmation.
OB Order Block, last institutional candle before move.
FVG Fair Value Gap, price imbalance often revisited.
FAQ
Q: Is this a signal indicator?
A: No. It is a contextual framework that supports manual decision-making.
Q: Does it repaint?
A: No. All structure logic is confirmed on bar close.
Q: Does it work on all markets?
A: Yes. It is purely price-based and timeframe independent.
Q: When does bias change?
A: Only after a new confirmed swing high or low.
Q: Can it be backtested?
A: You can build strategies on top of this context using your own entry and exit rules.
Disclaimer
This script is provided for educational purposes only.
It is not financial advice.
Trading carries risk. Past performance does not guarantee future results.
Use proper risk management and test on demo accounts before applying to live markets.

RUSSFEST SMC Strategy V1.4RUSSFEST SMC Strategy V1.4 is a multi-timeframe Smart Money Concepts framework that builds a clean, rule-based view of market structure and then trades directly off that structure. It’s designed for traders who want to systematize SMC logic, keep their charts readable, and automate their trading.
Instead of relying on lagging oscillators, the strategy continuously tracks the active price leg, labels strong/weak highs and lows, and reacts to structural shifts in real time. The current timeframe leg is always drawn on your chart with a clear high, low, and midpoint, so you can instantly see whether price is trading in a discount or premium relative to the leg. Trade entries are driven by confirmed events aligned with directional bias, not by single-candle patterns.
A higher-timeframe (HTF) structure engine runs in the background and can be overlaid on your execution timeframe (e.g., 4H structure on a 15m chart). This HTF leg provides the primary bias and defines HTF discount/premium zones so that longs can be constrained to discounted areas of a bullish leg and shorts to premium areas of a bearish leg. An optional additional HTF bias can be turned on for traders who want an extra top-down filter before any position is allowed.
Risk management is fully structure-based. Stops are always placed beyond the current structure high/low with an optional buffer, so every trade is anchored to a meaningful swing point instead of arbitrary points. Take-profit logic is configurable:
Fixed RR – simple R-multiple targeting off the structure-based stop.
HTF Weak High/Low – targets the opposing side of the active HTF leg.
Opposite CHoCH – dynamically exits when structure flips against the position, effectively using the next structural shift as an exit rule.
Key Features:
Full SMC-style price leg tracking with strong/weak highs & lows and midpoint.
Multi-timeframe structure: overlay HTF leg on your LTF execution chart.
Primary and optional secondary HTF bias filters.
Discount/premium gating relative to the HTF leg (no “chasing” in the wrong zone).
Structure-anchored stop loss with three exit modes (Fixed RR, HTF target, Opposite CHoCH).
Day-of-week filters for filtering out any days that don't prove to be profitable.
This script is a structured SMC framework, not financial advice. Markets are risky; always forward-test, adjust parameters for your instrument and timeframe, and use position sizing that fits your own risk tolerance.

ICT Smart Money Trading Suite PRO [SwissAlgo]ICT SMC Trading Suite Pro
Structure Detection. Imbalance Tracking. Trade Planning. Contextual Alerts.
Why This Integrated System Was Built
The ICT/SMC methodology requires tracking multiple analytical components simultaneously - a process prone to manual errors, time inefficiency, and visual clutter . This indicator consolidates these elements into a single, unified system , providing rules-based validation for experienced ICT traders who may struggle with execution speed, consistency, and manual calculations.
-----------------------------------------------------------------
What This Indicator Does
ICT/SMC methodology involves tracking multiple analytical components simultaneously. This indicator consolidates them into a single system.
Common challenges when applying ICT manually:
1️⃣ Structure Identification
Determining which pivots qualify as external (macro) structure versus internal (micro) structure requires consistent rules. Inconsistent structure identification affects the detection of the relevant trading range for entries , Change of Character (ChoCH) , and Break of Structure (BoS) . Accurate structure identification is paramount ; a faulty reading invalidates the entire ICT thesis for the current swing. While no automated system can replace human judgment, the indicator provides you with a rules-based starting point for structural analysis. The key goal is to help you find and map the relevant structural leg to focus on.
2️⃣ Chart Organization
Drawing Fibonacci retracements, Fair Value Gaps, Order Blocks, and other imbalances manually creates visual complexity that can obscure the analysis. The indicator addresses this by striving to show all imbalances in a consistent, unified, and understandable visual way , using color coding and z-order layering to maintain clarity even when multiple components are active.
3️⃣ Imbalance Tracking
ICT methodology requires monitoring a vast array of institutional footprints : Fair Value Gaps (FVG), Order Blocks (OB), Breaker Blocks (BB), Liquidity Pools (LP), Volume Imbalances, Wick Imbalances, and Kill Zone ranges. Tracking all these simultaneously and manually monitoring their mitigation status is highly time-intensive and prone to oversight . The indicator constantly scans and tracks all key imbalance types for you, automatically updating their status and creating a dynamic, real-time visual heatmap of unmitigated institutional inefficiency.
4️⃣ Trade Calculation
Determining structure-based Stop Loss (SL) placement, calculating multiple Take Profit (TP) levels with accurate position-sizing splits, and computing the final blended Risk-to-Reward (R:R) ratio involves multiple time-sensitive, manual calculations per setup . The indicator automates this entire trade calculation process for you, instantly providing the necessary pricing (entry, SL, TP), sizing, and performance projections, and mitigating the risk of execution error .
5️⃣ Condition Monitoring
ICT setups often require specific technical conditions to align: price reaching discount Fibonacci levels (0.618-0.882 for shorts, 0.118-0.382 for longs), EMA crossovers confirming momentum, or structural shifts (ChoCH/BoS). Identifying these moments requires continuous chart observation across multiple assets and timeframes.
This indicator includes an alert system that monitors these technical conditions and sends notifications when they occur (real-time). The alert system is designed to minimize spam. This allows traders to review potential setups on demand rather than through continuous observation - particularly relevant for those monitoring multiple instruments or trading sessions outside their local timezone.
-----------------------------------------------------------------
Intended Use
This indicator is designed for traders who:
♦ Apply ICT/SMC methodology - Familiarity with concepts such as Fair Value Gaps, Order Blocks, Liquidity Pools, market structure, and discount/premium zones is assumed. The indicator does not teach these concepts but provides tools to apply them.
♦ Trade on intraday to swing timeframes - The structure detection and Fibonacci zone mapping work across multiple timeframes. Recommended primary timeframe: 1H (adjustable based on trading approach).
♦ Prefer systematic entry planning - The trade calculation feature computes stop loss, take profit levels, and risk-to-reward ratios based on structure and Fibonacci positioning. Suitable for traders who use defined entry criteria.
♦ Monitor multiple instruments or sessions - The alert functionality notifies when specific technical conditions occur (discount zone entries, EMA crossovers, structure changes), reducing the need for continuous manual monitoring.
♦ Use trade execution platforms - The trade summary table displays pre-formatted values (entry, SL, TP levels with quantity splits) that can be manually input into trading platforms or bot services like 3Commas.
-----------------------------------------------------------------
How To Use
Step 1: Structure Analysis
The indicator automatically detects external and internal market structure using pivot analysis. Structure lines are color-coded: red for bearish structure, green for bullish. External pivots are marked with larger triangles, internal pivots with smaller markers. The pivot length parameters (default: 20/20) can be adjusted in settings to align with your structural analysis approach and the asset you are analyzing.
Step 2: Define Your Trading Zone
Use the "Start Swing" and "End Swing" date inputs to mark the beginning and end of the (external) structural leg you wish to analyze. The indicator calculates Fibonacci retracement levels based on these points and color-codes the zones:
* Green zones: Discount area (0.618-0.882 for bearish / 0.118-0.382 for bullish)
* Yellow zones: Premium area (0.786-1.0 for bearish / 0.0-0.214 for bullish)
* Red zones: Extension area beyond structure (potential fake-out zones)
Step 3: Review Imbalances
The indicator identifies and displays multiple imbalance types:
🔥 Volume imbalances (from displacement candles based on PVSRA methodology)
🔥 Fair Value Gaps (FVG)
🔥 Order Blocks (OB) and Breaker Blocks (BB)
🔥 Liquidity Pools (LP) at equal highs/lows
🔥 Wick imbalances (exceptional wick formations)
🔥 Kill Zone liquidity from specific trading sessions (Asian, London, NY AM)
Volume Imbalances
Fair Value Gaps
Order Blocks
Liquidity Pools
Wick Imbalances
Kill Zone Imbalances
According to ICT methodology, imbalances act as price magnets - areas where price tends to return for mitigation. When multiple imbalances overlap at the same price level, this creates a confluence zone with a higher probability of price reaction .
Imbalances are displayed as gray boxes , creating a visual heatmap of institutional inefficiencies. When imbalances overlap, the zones appear darker due to layering, and labels combine to show confluence (e.g., "FVG + OB" or "Vol + LP").
Heatmap of Imbalances
User can view each type alone, or all together (heatmap)
Each imbalance type is tracked until mitigated by price according to ICT principles and can be toggled on/off independently in settings.
Step 4: Reference Levels & Sessions
The indicator displays additional reference data:
🔥 Daily Pivot Points (PP, R1-R3, S1-S3) calculated from previous day
🔥Average Daily Range (ADR) projected from the current day's extremes
🔥 Daily OHLC levels: Today's Open (DO), Previous Day High (PDH), Previous Day Low (PDL)
🔥Session backgrounds (optional): Color-coded boxes for Asian, London, NY AM, and NY PM sessions
Sessions
While these are not ICT-specific imbalances, they represent widely-watched price levels that often attract institutional activity and can act as additional reference points for support, resistance, and liquidity targeting.
All reference levels can be toggled independently in settings.
Step 5: Momentum Reference
EMA 14 and EMA 21 lines are displayed for momentum analysis. When EMA 14 enters discount zones and crosses EMA 21, a triangle marker appears on the chart. This indicates a potential alignment of structure and momentum conditions.
Step 6: Trade Planning
Input your intended entry price in the "Entry Price" field along with your margin and leverage parameters. The indicator automatically calculates all trade parameters:
* Stop loss level (based on Fibonacci structure - typically at 1.118 extension)
* Three take profit levels (TP1, TP2, TP3) with position quantity splits
* Risk-to-reward ratio (blended across all three targets)
* Projected profit/loss values in both dollars and percentage
All calculated values are displayed both visually on the chart (as horizontal lines with labels) and in a formatted Trade Summary table. The table organizes the information for quick reference: entry details, take profit levels with quantities, stop loss parameters, and performance projections.
This pre-calculated data can be manually copied into trading platforms or bot services (such as 3Commas Smart Trades) without requiring additional calculations.
Step 7: Alert Configuration
Create alerts using TradingView's alert system (select "Any alert() function call"). The indicator sends notifications when:
* Price reaches specific discount Fibonacci levels (0.618, 0.786, 0.882 for shorts / 0.382, 0.214, 0.118 for longs)
* EMA 14/21 crossovers occur within discount zones
* Change of Character (ChoCH) is detected
* Break of Structure (BoS) is detected
Note: Alerts require active TradingView alert functionality. Update alerts when changing your trading zone parameters.
-----------------------------------------------------------------
Key Features
Structure & Zone Analysis
* Automated structure detection with external/internal pivots and zig-zag visualization
* Fibonacci retracement mapping with color-coded discount/premium zones
* Visual zone classification: Green (optimal discount), Yellow (premium), Red (fake-out risk)
ICT Imbalances Heatmap
* Volume imbalances (PVSRA displacement candles)
* Fair Value Gaps (FVG)
* Order Blocks (OB) and Breaker Blocks (BB)
* Liquidity Pools (LP) at equal highs/lows
* Wick imbalances (exceptional wick formations)
* Kill Zone liquidity (Asian, London, NY AM sessions)
* Confluence detection with combined labels and visual layering
Reference Levels
* Daily Pivot Points (PP, R1-R3, S1-S3)
* Average Daily Range (ADR) projections
* Daily OHLC levels (DO, PDH, PDL)
* Session backgrounds for kill zones
Trade Planning Tools
* Automated stop loss calculation based on Fibonacci structure
* Three-tier take profit system with position quantity splits
* Risk-to-reward ratio calculation (blended across all targets)
* P&L projections in dollars and percentages
* Trade Summary table formatted for manual platform entry
Momentum & Signals
* EMA 14/21 overlay for momentum analysis
* Visual crossover markers (triangles) in discount zones
* Change of Character (ChoCH) detection and labels
* Break of Structure (BoS) detection and labels
Chart Enhancements
* Higher timeframe candle overlay (5m to Monthly)
* PVSRA candle coloring (volume-based)
* Symbol legend for quick reference
* Customizable visual elements (toggle all components independently)
Alert System
* Discount zone entry notifications (Fibonacci level monitoring)
* EMA crossover signals within discount zones
* Structure change alerts (ChoCH and BoS)
* Configurable via TradingView alert functionality
Alert Functionality
The indicator includes an alert system that monitors technical conditions continuously.
When configured, alerts notify users when specific events occur:
❗ Discount Zone Monitoring
When EMA 14 crosses into key Fibonacci levels (0.618, 0.786, 0.882 for bearish structure / 0.382, 0.214, 0.118 for bullish structure), an alert is triggered. Example: Trading BTC and ETH simultaneously - instead of monitoring both charts for zone entries, alerts notify when either asset reaches the specified level.
❗ Momentum Alignment
When EMA 14 crosses EMA 21 within discount zones, an alert is sent. Example: Monitoring setups across multiple timeframes (1H, 4H, Daily) - alerts indicate when momentum conditions align on any timeframe being tracked.
❗ Structure Changes
Change of Character (ChoCH) and Break of Structure (BoS) events trigger alerts. Example: Trading during the Asian session while located in a different timezone - alerts notify of structure changes occurring outside active monitoring hours.
Configuration
Alerts are set up through TradingView's native alert system. Select "Any alert() function call" when creating the alert.
⚠️ Note: Alert parameters are captured at creation time, so alerts must be updated when changing trading zone settings (Start/End Swing dates) or any other parameter.
How to Create Alerts
Step 1: Open Alert Creation
Click the "Alert" button (clock icon) in the top toolbar of TradingView, or right-click on the chart and select "Add Alert."
Step 2: Configure Alert Condition
* In the alert dialog, set the Condition dropdown to select this indicator
* Set the alert type to ⚠️ " Any alert() function call "
* This configuration allows the indicator to trigger alerts based on its internal logic
Step 3: Set Alert Timing
* Timeframe: Same as chart
* Expiration: Choose "Open-ended (when triggered)" to keep the alert active until conditions occur
* Message tab: choose a name for the alert
Step 4: Notification Settings
Configure how you want to receive notifications:
* Popup within TradingView
* Email notification
* Mobile app push notification (requires TradingView mobile app)
Step 5: Create
Important Notes:
* Alert parameters are captured at creation time . If you change your trading zone (Start/End Swing dates) or entry price, delete the old alert and create a new one .
* One alert per chart: Create separate alerts for each instrument and timeframe you're monitoring.
* TradingView alert limits apply based on your TradingView subscription tier.
What Triggers Alerts: This indicator sends alerts for four key event types:
1. Discount Zone Entry - EMA 14 crossing key Fibonacci levels
2. Momentum Crossover - EMA 14/21 crossovers within discount zones
3. Change of Character (ChoCH) - Structure reversal detected
4. Break of Structure (BoS) - Trend continuation confirmed
All four conditions are monitored by a single alert configuration .
-----------------------------------------------------------------
Recommended Settings
* Timeframe : 1H works well for most assets
* Theme : Dark mode recommended
* Structural Pivots : Default 20/20 captures reasonable structure; adjust to match your analysis
-----------------------------------------------------------------
Chart Elements Guide
♦ Structure Visualization
Zig-zag lines
Automated structure detection - green lines indicate bullish structure, red lines indicate bearish structure. Thick lines represent external structure , thin faded lines show internal structure .
Triangle markers
Large triangles mark external pivots (swing highs/lows), small triangles mark internal pivots.
Fibonacci Zones
* Green zones: Discount area - potential entry zones (0.618-0.882 for shorts / 0.118-0.382 for longs)
* Yellow zones: Premium area - higher extension zones (0.786-1.0 for shorts / 0.0-0.214 for longs)
* Red zones: Fake-out risk area - price beyond structural extremes (above 1.0 for shorts / below 0.0 for longs)
* White dashed lines: Individual Fibonacci levels (1.0, 0.882, 0.786, 0.618, 0.5, 0.382, 0.214, 0.118, 0.0)
♦ Imbalance Heatmap
Gray boxes with dotted midlines
Unmitigated imbalances create a visual heatmap. Overlapping imbalances appear darker due to layering.
Combined labels
When multiple imbalances overlap, labels show confluence (e.g., "FVG + OB", "Vol + LP + Wick")
Types displayed : Vol (Volume), FVG (Fair Value Gap), OB (Order Block), BB (Breaker Block), LP (Liquidity Pool), Wick, KZ (Kill Zone)
♦ Momentum Indicators
* Red line: EMA 14
* Yellow line: EMA 21
* Small triangles on price: Crossover signals - red triangle (bearish crossover), green triangle (bullish crossover) when occurring within discount zones
♦ Structure Change Markers
* Labels with checkmarks/crosses: ChoCH (Change of Character) and BoS (Break of Structure) events (Green label with ✓: Bullish ChoCH or BoS, Red label with ✗: Bearish ChoCH or BoS)
♦ Trade Planning Lines (when entry price is set)
* Blue horizontal line: Entry price
* Green dashed lines: TP1 and TP2
* Green solid line: TP3 (final target)
* Red horizontal line: Stop Loss level
TP levels and SL are calculated based on the structure range, entry price, and mapped trading zone, and aim to achieve a minimum risk: reward ratio of 1:1.5 (R:R)
♦ Colored background zones:
Green shading between entry and TP3 (profit zone), red shading between entry and SL (loss zone)
♦ Reference Levels
* Orange dotted lines with labels: Daily Pivot Points (PP, R1-R3, S1-S3)
* Purple dotted lines with labels: ADR High and ADR Low projections
* Cyan dotted lines with labels: DO (Daily Open), PDH (Previous Day High), PDL (Previous Day Low)
♦ Session Backgrounds (optional)
* Yellow shaded box: Asian session (19:00-00:00 NY time)
* Blue shaded box: London session (02:00-05:00 NY time)
* Green shaded box: NY AM session (09:30-11:00 NY time)
* Orange shaded box: NY PM session (13:30-16:00 NY time)
♦ Trade Summary Table (top-right corner)
Displays a complete trade plan with sections:
* Sanity Check: Plan validation status
* Setup: Trade type, leverage, entry price, position size
* Take Profit: TP1, TP2, TP3 with prices, percentages, and quantity splits
* Stop Loss: SL price and type
* Performance: Potential profit/loss, ROI, and risk-to-reward ratio
♦ HTF Candle Overlay (optional, displayed to the right of the current price)
* Larger candlesticks representing higher timeframe price action
* Green bodies: Bullish HTF candles
* Red bodies: Bearish HTF candles
* Label shows selected timeframe (e.g., "HTF→ D" for daily)
♦ Legend Table (bottom-right corner)
Quick reference guide explaining all symbol abbreviations and color codes used on the chart.
-----------------------------------------------------------------
Methodology & Calculation Details
This indicator consolidates multiple ICT/SMC analytical components into a single integrated system. While individual elements could be created separately, this integration provides automated coordination between components , consistency, and reduces chart complexity.
Structure Detection External and internal pivots
Are identified using fractal pivot analysis with configurable lookback periods (default: 20 bars for both). A pivot high is confirmed when the high at the pivot bar exceeds all highs within the lookback range on both sides. Pivot lows use inverse logic. Structure lines connect validated pivots, with color coding based on price direction (higher highs/higher lows = bullish, lower highs/lower lows = bearish).
Fibonacci Retracement Calculation
Users define two swing points via date/time inputs. The indicator calculates the price range between these points and applies standard Fibonacci ratios (0.0, 0.118, 0.214, 0.382, 0.5, 0.618, 0.786, 0.882, 1.0, plus extensions at 1.118, 1.272, -0.118, -0.272). Zone classification is based on ICT discount/premium principles: 0.618-1.0 range for bearish setups, 0.0-0.382 for bullish setups.
Imbalance Identification
Volume Imbalances : Detected using PVSRA (Price, Volume, Support, Resistance Analysis) methodology. Candles are classified based on the percentile ranking of volume and price range over a 1344-bar lookback period. Type 1 imbalances require ≥95th percentile in both volume and range; Type 2 requires ≥85th percentile. Additional filters include body-to-range ratio (≥50% for Type 1, ≥30% for Type 2) and ATR validation.
Fair Value Gaps (FVG) : Identified when a three-candle sequence shows a price gap: low > high for bullish FVG, high < low for bearish FVG. The middle candle must close beyond the gap edge. Mitigation occurs when the price retraces into the gap.
Order Blocks (OB) : Detected by identifying the last opposing candle before a significant price move. When price breaks a swing high/low, the algorithm scans backwards to find the candle with the highest high (bearish OB) or lowest low (bullish OB) before the breakout. When an OB is breached, it converts to a Breaker Block (BB).
Liquidity Pools (LP) : Identified by detecting equal highs or equal lows using a tolerance threshold based on ATR. Pivot highs/lows within this tolerance range are grouped. Equal highs create Buy-Side Liquidity (BSL) zones above the level; equal lows create Sell-Side Liquidity (SSL) zones below the level.
Wick Imbalances: Flagged when a candle's wick exceeds 1.0x ATR and comprises >50% of the total candle range. These represent rapid rejections or absorption events.
Kill Zone Liquidity: Tracks the high/low range during specific ICT-defined sessions (Asian: 19:00-00:00 NY, London: 02:00-05:00 NY, NY AM: 09:30-11:00 NY). At session close, BSL and SSL zones are created above/below the session range.
Change of Character (ChoCH) & Break of Structure (BoS)
ChoCH is detected when price breaks counter to the established structure (bearish structure broken upward = bullish ChoCH; bullish structure broken downward = bearish ChoCH). BoS occurs when price breaks in the direction of the established trend (bearish structure breaking lower = bearish BoS; bullish structure breaking higher = bullish BoS).
Trade Calculations
Stop Loss and Take Profit levels are calculated based on the entry position within the Fibonacci zone structure:
* Premium entries (0.786-1.0 for shorts / 0.0-0.214 for longs): SL at 1.118/-0.118 extension, TP structure weighted toward zone extremes
* Golden entries (0.618-0.786 for shorts / 0.214-0.382 for longs): SL at 1.0/0.0 boundary, TP structure balanced across range
Risk-to-reward ratios are calculated as blended values across all three take profit levels, weighted by position quantity splits.
Reference Level Calculations
* Pivot Points: Standard formula using previous day's high, low, and close: PP = (H + L + C) / 3
* Support/Resistance: R1 = 2×PP - L, S1 = 2×PP - H, with R2/S2 and R3/S3 calculated using range extensions
* ADR: 14-period simple moving average of daily high-low range, projected from current day's extremes
Momentum Analysis
EMA 14 and EMA 21 use standard exponential moving average calculations. Crossovers are detected when EMA 14 crosses EMA 21 within user-defined discount zones, with directional confirmation (cross under in bearish discount = short signal; cross over in bullish discount = long signal).
Why This Integration Matters
While components like EMA crossovers, pivot detection, or Fibonacci retracements exist as separate indicators, this system provides:
1. Coordinated Analysis : All components reference the same structural framework (user-defined trading zone)
2. Automated Mitigation Tracking : Imbalances are monitored continuously and removed when mitigated according to ICT principles
3. Contextual Alerts : Notifications are triggered only when conditions align within the defined structural context
4. Trade Parameter Automation : Stop loss and take profit calculations adjust dynamically based on entry positioning within the structure
5. Consistent Visual Display : All elements use a unified color scheme, labeling system, and z-order layering. This eliminates visual conflicts that occur when stacking multiple independent indicators (overlapping lines, label collisions, inconsistent transparency levels, conflicting color schemes).
This consolidation reduces the need to manually coordinate 8-10 separate indicators, eliminates redundant calculations across disconnected tools, and maintains visual clarity even when all components are displayed simultaneously.
-----------------------------------------------------------------
Disclaimer
1. Indicator Functionality and Purpose
This indicator is solely a technical analysis tool built upon established methodologies (Smart Money Concepts/ICT) and statistical calculations (Pivots, Fibonacci, EMAs). It is designed to assist experienced traders in visualizing complex data, streamlining the analytical workflow, and automating conditional alerting.
The indicator is NOT:
♦ Financial Advice: It does not provide personalized investment recommendations, solicited advice, or instruction on buying, selling, or holding any financial instrument.
♦ A Guarantee of Profit: The presence of a signal, alert, or trade plan output by this tool does not guarantee that any trade will be profitable.
♦ A Predictor of Future Prices: The tool calculates probabilities and potential scenarios based on historical data and current structure; it does not predict future market movements.
2. General Trading Risks and Capital Loss
♦ All trading involves substantial risk of loss. You may lose some or all of your initial capital. Leveraged products, such as futures, CFDs, and margin trading, carry a high degree of risk and are not suitable for all investors.
♦ Risk Acknowledgment: By using this indicator, you acknowledge and accept that you are solely responsible for all trading decisions, and you bear the full risk of any resulting profit or loss.
♦ Risk Management is Crucial: This indicator is an analytical tool only. You must employ independent risk management techniques (position sizing, stop-loss orders) tailored to your personal financial situation and risk tolerance.
3. Calculation Limitations and Non-Real-Time Data
The calculations performed by this indicator are based on the data provided by your charting platform (e.g., TradingView).
♦ Data Accuracy: The accuracy of the outputs (e.g., Price Delivery Arrays, Pivots, P&L projections) is dependent on the accuracy and real-time nature of the underlying market data feed.
♦ Latencies: Trade alerts and signals may be subject to minor delays due to server processing, internet connectivity, or charting platform performance. Do not rely solely on alerts for execution.
♦ Backtesting and Performance: Any depiction of past performance, including data visible on the chart, is not indicative of future results. Trading results will vary based on market conditions, liquidity, and execution speed.
4. Software and Platform Disclaimer
"As Is" Basis: The indicator is provided on an "as is" basis without warranties of any kind, whether express or implied. The author does not guarantee the script will be error-free or operate without interruption.
Third-Party Integration: This indicator is not affiliated with, endorsed by, or connected to TradingView, 3Commas, or any other broker or execution platform. All third-party names are trademarks of their respective owners. The formatting of the Trade Summary Table for 3Commas is for user convenience only.
5. Required Competency (User Responsibility)
This indicator is built on the assumption that the user is an experienced trader with a working understanding of the complex concepts being visualized (ICT/SMC, FVG, Order Blocks, Liquidity, etc.). The indicator does not teach these concepts.
You Must Always Do Your Own Research (DYOR) before making any trading decision based on signals or visualization provided by this tool.
By installing and using this indicator, you explicitly agree to these terms and assume full responsibility for all trading activity.
