QT RSI [ W.ARITAS ]The QT RSI is an innovative technical analysis indicator designed to enhance precision in market trend identification and decision-making. Developed using advanced concepts in quantum mechanics, machine learning (LSTM), and signal processing, this indicator provides actionable insights for traders across multiple asset classes, including stocks, crypto, and forex.
Key Features:
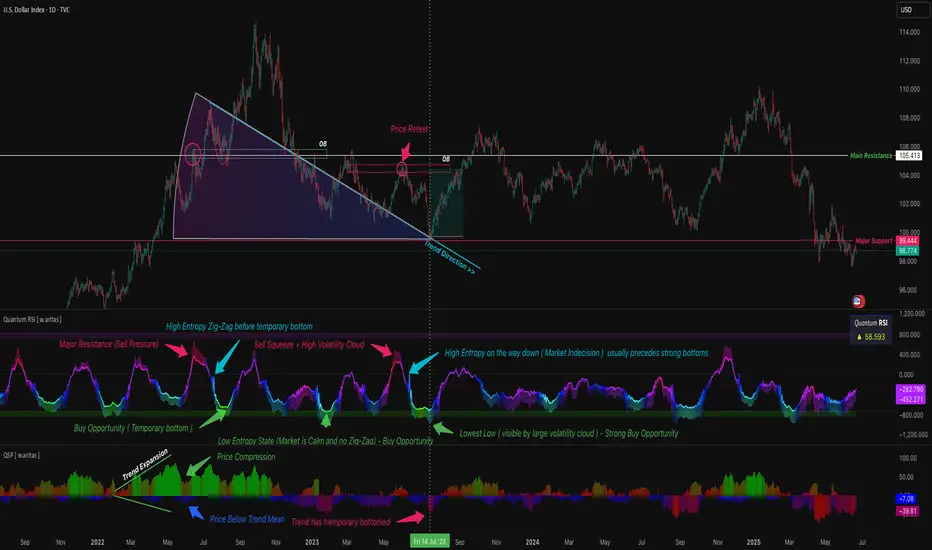
Dynamic Color Gradient: Visualizes market conditions for intuitive interpretation:
Green: Strong buy signal indicating bullish momentum.
Blue: Neutral or observation zone, suggesting caution or lack of a clear trend.
Red: Strong sell signal indicating bearish momentum.
Quantum-Enhanced RSI: Integrates adaptive energy levels, dynamic smoothing, and quantum oscillators for precise trend detection.
Hybrid Machine Learning Model: Combines LSTM neural networks and wavelet transforms for accurate prediction and signal refinement.
Customizable Settings: Includes advanced parameters for dynamic thresholds, sensitivity adjustment, and noise reduction using Kalman and Jurik filters.
How to Use:
Interpret the Color Gradient:
Green Zone: Indicates bullish conditions and potential buy opportunities. Look for upward momentum in the RSI plot.
Blue Zone: Represents a neutral or consolidation phase. Monitor the market for trend confirmation.
Red Zone: Indicates bearish conditions and potential sell opportunities. Look for downward momentum in the RSI plot.
Follow Overbought/Oversold Boundaries:
Use the upper and lower RSI boundaries to identify overbought and oversold conditions.
Leverage Advanced Filtering:
The smoothed signals and quantum oscillator provide a robust framework for filtering false signals, making it suitable for volatile markets.
Application: Ideal for traders and analysts seeking high-precision tools for:
Identifying entry and exit points.
Detecting market reversals and momentum shifts.
Enhancing algorithmic trading strategies with cutting-edge analytics.