MAG8 Breadth RSI This indicator is for my personal monitoring breadth of MAG 8 , including AVGO for use to trade spy/es and qqq/nq.
A green bar over 6 translates to 6 out of the 8 stocks have RSI's<30. Conversely a red indicator at 6 would indicate 6 out of 8 are overbought, RSI >70.
Extreme 6-8 of 8 either overbought (red) or oversold (green)
Moderate 4-5 of 8 either overbought (red) or oversold (green)
No Signal 0-3 of 8 either overbought (red) or oversold (green)
Not trading advice but thought I would share.
متذبذبات


Smart RSI Money Flow - Core Bands V1.01SMART RSI – Money Flow Bands (Technical Overview)
1. Background: RSI and Its Behavior on Lower Timeframes
The Relative Strength Index (RSI) originally is a momentum oscillator calculated from average gains and losses over a selected period. In its standard form, RSI is derived solely from price changes; it does not incorporate volume data or order-flow information in its formula.
Because RSI is price-based, its interpretation depends strongly on the timeframe:
• On higher timeframes, each bar aggregates more trading activity, and RSI tends to behave more smoothly.
• On lower timeframes (1-hour down to intraday scalping intervals), price fluctuations are quicker, and RSI becomes more sensitive to short-term noise.
This does not imply that RSI becomes invalid, but that its signals on fast charts can be more reactive and may benefit from additional context such as volume behavior or structural information.
2. Purpose of This Indicator
This indicator extends the classical RSI by adding information that RSI does not include:
• Mapping RSI values into price-based bands instead of the 0–100 oscillator space.
• Retrieving lower timeframe volume data and separating it into buy and sell components.
• Comparing the slope (angle) of price movement with the slope of buy and sell volume.
The goal is to provide a structural interpretation of where price sits relative to RSI conditions and how volume is behaving on a lower timeframe.
3. Technical Differences Compared to Classical RSI
A) Classical RSI
• Input: price only (usually close).
• Output: normalized oscillator between 0 and 100.
• Does not incorporate intra-bar volume distribution.
• Does not separate buy/sell volume.
B) SMART RSI – Money Flow Bands
1) RSI-to-Price Mapping
Converts RSI values into upper/lower price bands using recent price extremes.
2) Lower Timeframe Volume Decomposition
Retrieves LTF data and splits each bar’s volume into buy (close>open) and sell (close

TASC 2025.12 The One Euro Filter█ OVERVIEW
This script implements the One Euro filter, developed by Georges Casiez, Nicolas Roussel, and Daniel Vogel, and adapted by John F. Ehlers in his article "Low-Latency Smoothing" from the December 2025 edition of the TASC Traders' Tips . The original creators gave the filter its name to suggest that it is cheap and efficient, like something one might purchase for a single Euro.
█ CONCEPTS
The One Euro filter is an EMA-based low-pass filter that adapts its smoothing factor (alpha) based on the absolute values of smoothed rates of change in the source series. It was designed to filter noisy, high-frequency signals in real time with low latency. Ehlers simplifies the filter for market analysis by calculating alpha in terms of bar periods rather than time and frequency, because periods are naturally intuitive for a discrete financial time series.
In his article, Ehlers demonstrates how traders can apply the adaptive One Euro filter to a price series for simple low-latency smoothing. Additionally, he explains that traders can use the filter as a smoothed oscillator by applying it to a high-pass filter. In essence, similar to other low-pass filters, traders can apply the One Euro filter to any custom source to derive a smoother signal with reduced noise and low lag.
This script applies the One Euro filter to a specified source series, and it applies the filter to a two-pole high-pass filter or other oscillator, depending on the selected "Osc type" option. By default, it displays the filtered source series on the main chart pane, and it shows the oscillator and its filtered series in a separate pane.
█ INPUTS
Source: The source series for the first filter and the selected oscillator.
Min period: The minimum cutoff period for the smoothing calculation.
Beta: Controls the responsiveness of the filter. The filter adds the product of this value and the smoothed source change to the minimum period to determine the filter's smoothing factor. Larger values cause more significant changes in the maximum cutoff period, resulting in a smoother response.
Osc type: The type of oscillator to calculate for the pane display. By default, the indicator calculates a high-pass filter. If the selected type is "None", the indicator displays the "Source" series and its filtered result in a separate pane rather than showing the filter on the main chart. With this setting, users can pass plotted values from another indicator and view the filtered result in the pane.
Period: The length for the selected oscillator's calculation.

Trade The Matric / MACD-RSI Hybrid Candles**"MACD-RSI Hybrid Candles"** is a **custom TradingView Pine Script (v6)** indicator that **replaces your chart’s default candles** with **dynamically colored, intensity-adjusted candles** based on **combined MACD and RSI signals**.
It’s a **visual fusion** of:
- **MACD Histogram** → Momentum & Trend Strength
- **RSI** → Overbought/Oversold & Trend Confirmation
- **Dynamic Transparency** → Visualizes **signal strength**
The result? **At-a-glance confirmation of bullish/bearish phases** — no need to check subcharts.
---
## OVERVIEW: What This Indicator Does
| Feature | Purpose |
|-------|--------|
| **Replaces price candles** | Entire chart becomes a **live MACD-RSI signal map** |
| **Colors based on dual confirmation** | Only strong when **both** MACD and RSI agree |
| **Transparency = momentum intensity** | Brighter = stronger signal |
| **Labels & Alerts** | Highlights **phase changes** (bullish/bearish shifts) |
---
## USER INPUTS (Customizable)
| Input | Default | Description |
|------|--------|-----------|
| `fastLen` | 12 | MACD Fast EMA |
| `slowLen` | 26 | MACD Slow EMA |
| `signalLen` | 9 | MACD Signal Line |
| `rsiLen` | 14 | RSI Period |
| `showLabels` | true | Show "Bullish Phase" / "Bearish Phase" labels |
> Standard settings — tweak for sensitivity.
---
## CORE CALCULATIONS
### 1. **MACD**
```pinescript
macdLine = ta.ema(close, fastLen) - ta.ema(close, slowLen)
signalLine = ta.ema(macdLine, signalLen)
hist = macdLine - signalLine
```
- `hist > 0` → **Bullish momentum**
- `hist < 0` → **Bearish momentum**
### 2. **RSI**
```pinescript
rsi = ta.rsi(close, rsiLen)
```
- `rsi > 50` → **Bullish bias**
- `rsi < 50` → **Bearish bias**
---
## DUAL CONFIRMATION LOGIC
| Condition | Meaning |
|--------|--------|
| `bullCond = macdBull and rsiBull` | **MACD hist > 0** AND **RSI > 50** → **Confirmed Bullish** |
| `bearCond = macdBear and rsiBear` | **MACD hist < 0** AND **RSI < 50** → **Confirmed Bearish** |
| Otherwise | **Neutral / Conflicted** |
> Only **strong, aligned signals** get bright colors.
---
## DYNAMIC INTENSITY & TRANSPARENCY (Key Feature)
```pinescript
maxHist = ta.highest(math.abs(hist), 100)
intensity = math.abs(hist) / maxHist
transp = 90 - (intensity * 80)
```
### How It Works:
1. Finds **strongest MACD histogram value** in last 100 bars
2. Compares **current histogram** to that peak → `intensity` (0 to 1)
3. **Transparency scales from 90 (faint) → 10 (bright)**
| Intensity | Transparency | Visual Effect |
|---------|--------------|-------------|
| 0% (weak) | 90 | Almost transparent |
| 50% | 50 | Medium |
| 100% | 10 | **Vivid, bold candle** |
> **Brighter candle = stronger momentum relative to recent history**
---
## CANDLE COLOR LOGIC
| Condition | Candle & Wick Color | Transparency |
|--------|---------------------|------------|
| **Confirmed Bullish** (`bullCond`) | **Lime Green** | Dynamic (10–90) |
| **Confirmed Bearish** (`bearCond`) | **Red** | Dynamic (10–90) |
| **Neutral / Conflicted** | **Gray** | Fixed 80 (faint) |
> **Wicks and borders match body** → full candle takeover
---
## VISUAL OUTPUT
### 1. **Custom Candles**
```pinescript
plotcandle(open, high, low, close, color=barColor, wickcolor=barColor, bordercolor=barColor)
```
- **Replaces default chart candles**
- **No original candles visible**
### 2. **Labels (Optional)**
- **"Bullish Phase"** → Green label **below low** when:
- MACD histogram **crosses above zero**
- AND RSI **> 50**
- **"Bearish Phase"** → Red label **above high** when:
- MACD histogram **crosses below zero**
- AND RSI **< 50**
> Up to **500 labels** (`max_labels_count=500`)
---
## ALERTS (Built-In)
| Alert | Trigger |
|------|--------|
| **Bullish MACD-RSI Signal** | `ta.crossover(hist, 0) and rsi > 50` |
| **Bearish MACD-RSI Signal** | `ta.crossunder(hist, 0) and rsi < 50` |
> Message: *"MACD crossed above zero with RSI > 50 — Bullish phase."*
---
## HOW TO READ THE CHART
| Visual | Market State | Interpretation |
|-------|-------------|----------------|
| **Bright Lime Candles** | **Strong Bullish Momentum** | High conviction — trend accelerating |
| **Faint Lime Candles** | **Weak Bullish** | Momentum present but not strong |
| **Bright Red Candles** | **Strong Bearish Momentum** | Downtrend with power |
| **Faint Red Candles** | **Weak Bearish** | Selling pressure, but fading |
| **Gray Candles** | **Conflicted / Choppy** | MACD and RSI disagree — avoid |
| **"Bullish Phase" Label** | **New Uptrend Starting** | Entry signal |
| **"Bearish Phase" Label** | **New Downtrend Starting** | Short signal |
---
## TRADING STRATEGY (Example)
### **Long Entry**
1. Wait for **"Bullish Phase" label**
2. Confirm **bright lime candles** (intensity > 50%)
3. Enter on **pullback to support** or **breakout**
4. **Stop Loss**: Below recent swing low
5. **Take Profit**: Trail with EMA or at resistance
### **Short Entry**
1. Wait for **"Bearish Phase" label**
2. Confirm **bright red candles**
3. Enter on **rally to resistance**
> **Best in trending markets** — avoid choppy ranges.
---
## UNIQUE FEATURES
| Feature | Benefit |
|-------|--------|
| **Dual Confirmation** | Avoids false MACD signals in overbought/oversold zones |
| **Dynamic Transparency** | Shows **relative strength** — not just direction |
| **Full Candle Replacement** | Clean, uncluttered chart |
| **Phase Labels** | Marks **exact trend change points** |
| **Built-in Alerts** | No extra setup needed |
---
## LIMITATIONS
| Issue | Note |
|------|------|
| **Lagging by design** | MACD & RSI are reactive |
| **Repainting?** | **No** — all on close |
| **No volume filter** | Add separately for better accuracy |
| **Labels can clutter** | Toggle off in choppy markets |
| **Intensity uses 100-bar lookback** | May lag in very long trends |
---
## BEST USE CASES
| Market | Timeframe | Style |
|-------|----------|------|
| Stocks, Forex, Crypto | 15m, 1H, 4H | Swing / Trend Following |
| **Avoid**: Sideways markets | Yes | High noise = many gray candles |
---
## COMPARISON TO STANDARD MACD/RSI
| Feature | This Indicator | Standard MACD + RSI |
|-------|----------------|---------------------|
| Visual | **Candles = signal** | Subchart lines |
| Confirmation | Built-in dual logic | Manual |
| Strength | Dynamic brightness | Histogram height |
| Alerts | Phase changes | Need custom |
| Chart Clutter | Low | High (two panels) |
> **This is a "one-panel" momentum dashboard**
---
## SUMMARY: What This Indicator Does
> **"MACD-RSI Hybrid Candles"** turns your **entire price chart into a live momentum heatmap** where:
>
> 1. **Candle color** = **MACD + RSI agreement** (Bullish / Bearish / Neutral)
> 2. **Brightness** = **Momentum strength** vs. recent 100 bars
> 3. **Labels & Alerts** = **Trend phase changes** (zero-line crosses with RSI filter)
>
> It **eliminates subcharts** and gives **instant visual confirmation** of:
> - **Trend direction**
> - **Momentum power**
> - **High-probability entries**
---
**Ideal for traders who want:**
- **No indicator panels**
- **Clear, color-coded signals**
- **Strength at a glance**
- **Automated alerts on trend shifts**
---
**Pro Tip**: Use with **volume** or **support/resistance** for **higher win rate**.

WTC Step Buy Step Edition CbyCarlo📊 WT Cross Modified – Step Buy Step Edition (v4)
WTC_StepBuyStep_Edition is an enhanced, practical, and optimized version of the classic WaveTrend (WT) Cross Indicator.
Developed for the Step Buy Step project, this tool helps traders identify market momentum shifts, structural price zones, and potential reversal areas with high clarity and precision.
🔍 Concept & Purpose
This indicator builds upon the established WaveTrend / LazyBear logic and extends it with additional structural intelligence.
The goal is to make overbought/oversold phases and trend reversals easier to spot — while also highlighting historically validated price zones where the market has previously reacted strongly.
⚙️ Key Features
1️⃣ WT Cross Signals
WT1 (yellow) and WT2 (purple) visualize market momentum.
A WT1 cross above WT2 while below the Oversold zone (−53) can indicate potential Long opportunities.
A WT1 cross below WT2 while above the Overbought zone (+53) can indicate potential Short opportunities.
Signals only confirm after candle close to prevent repainting.
2️⃣ Dynamic “WT SignalZone” Panel
Displayed in the top-right corner, this panel shows the last three valid price levels derived from WT signals:
🟢 LonLev – Buy support levels from previous WT Long signals
🔴 ShoLev – Sell resistance levels from previous WT Short signals
These zones act as objective support/resistance structures, based on historical momentum turning points — not subjective lines.
3️⃣ Flexible Calculation Modes
Choose how levels are derived from each WT signal:
Pullback 50% → Midpoint of the signal candle (high+low)/2
Close → Close price of the signal candle
Next Open → Open of the following bar (ideal for system testing)
📈 How to Interpret the Indicator
Market Condition WT Event Meaning
WT1 < −53 & CrossUp Long Signal Potential reversal / buy zone
WT1 > +53 & CrossDown Short Signal Potential exhaustion / sell zone
Price revisits LonLev Support Re-entry or bounce zone
Price revisits ShoLev Resistance Profit-taking or short setup zone
This makes the tool highly effective for:
Swing traders
Zone-based trading strategies
Systematic re-entries
Identifying structural turning points
🧠 Advantages
No repainting (signals confirmed only after bar close)
Works on all timeframes (from intraday to weekly)
Clean overview without clutter or excessive chart markers
Excellent as a filter to confirm market context
💬 Best Use Case
Use WTC_StepBuyStep_Edition as a contextual confirmation tool.
It does not replace a full trading system — but it gives you objective, repeatable, and statistically relevant zones where the market has reacted before.
Combine it with price action, volume analysis, or trend tools for even stronger setups.
© Step Buy Step • Step-Buy-Step.com
Educational trading tool intended for market analysis.
Not financial advice.

Baseline Deviation Oscillator [Alpha Extract]A sophisticated normalized oscillator system that measures price deviation from a customizable moving average baseline using ATR-based scaling and dynamic threshold adaptation. Utilizing advanced HL median filtering and multi-timeframe threshold calculations, this indicator delivers institutional-grade overbought/oversold detection with automatic zone adjustment based on recent oscillator extremes. The system's flexible baseline architecture supports six different moving average types while maintaining consistent ATR normalization for reliable signal generation across varying market volatility conditions.
🔶 Advanced Baseline Construction Framework
Implements flexible moving average architecture supporting EMA, RMA, SMA, WMA, HMA, and TEMA calculations with configurable source selection for optimal baseline customization. The system applies HL median filtering to the raw baseline for exceptional smoothing and outlier resistance, creating ultra-stable trend reference levels suitable for precise deviation measurement.
// Flexible Baseline MA System
ma(src, length, type) =>
if type == "EMA"
ta.ema(src, length)
else if type == "TEMA"
ema1 = ta.ema(src, length)
ema2 = ta.ema(ema1, length)
ema3 = ta.ema(ema2, length)
3 * ema1 - 3 * ema2 + ema3
// Baseline with HL Median Smoothing
Baseline_Raw = ma(src, MA_Length, MA_Type)
Baseline = hlMedian(Baseline_Raw, HL_Filter_Length)
🔶 ATR Normalization Engine
Features sophisticated ATR-based scaling methodology that normalizes price deviations relative to current volatility conditions, ensuring consistent oscillator readings across different market regimes. The system calculates ATR bands around the baseline and uses half the band width as the normalization factor for volatility-adjusted deviation measurement.
🔶 Dynamic Threshold Adaptation System
Implements intelligent threshold calculation using rolling window analysis of oscillator extremes with configurable smoothing and expansion parameters. The system identifies peak and trough levels over dynamic windows, applies EMA smoothing, and adds expansion factors to create adaptive overbought/oversold zones that adjust to changing market conditions.
1D
3D
1W
🔶 Multi-Source Configuration Architecture
Provides comprehensive source selection including Close, Open, HL2, HLC3, and OHLC4 options for baseline calculation, enabling traders to optimize oscillator behavior for specific trading styles. The flexible source system allows adaptation to different market characteristics while maintaining consistent ATR normalization methodology.
🔶 Signal Generation Framework
Generates bounce signals when oscillator crosses back through dynamic thresholds and zero-line crossover signals for trend confirmation. The system identifies both standard threshold bounces and extreme zone bounces with distinct alert conditions for comprehensive reversal and continuation pattern detection.
Bull_Bounce = ta.crossover(OSC, -Active_Lower) or
ta.crossover(OSC, -Active_Lower_Extreme)
Bear_Bounce = ta.crossunder(OSC, Active_Upper) or
ta.crossunder(OSC, Active_Upper_Extreme)
// Zero Line Signals
Zero_Cross_Up = ta.crossover(OSC, 0)
Zero_Cross_Down = ta.crossunder(OSC, 0)
🔶 Enhanced Visual Architecture
Provides color-coded oscillator line with bullish/bearish dynamic coloring, signal line overlay for trend confirmation, and optional cloud fills between oscillator and signal. The system includes gradient zone fills for overbought/oversold regions with configurable transparency and threshold level visualization with automatic label generation.
snapshot
🔶 HL Median Filter Integration
Features advanced high-low median filtering identical to DEMA Flow for exceptional baseline smoothing without lag introduction. The system constructs rolling windows of baseline values, performs median extraction for both odd and even window lengths, and eliminates outliers for ultra-clean deviation measurement baseline.
🔶 Comprehensive Alert System
Implements multi-tier alert framework covering bullish bounces from oversold zones, bearish bounces from overbought zones, and zero-line crossovers in both directions. The system provides real-time notifications for critical oscillator events with customizable message templates for automated trading integration.
🔶 Performance Optimization Framework
Utilizes efficient calculation methods with optimized array management for median filtering and minimal computational overhead for real-time oscillator updates. The system includes intelligent null value handling and automatic scale factor protection to prevent division errors during extreme market conditions.
🔶 Why Choose Baseline Deviation Oscillator ?
This indicator delivers sophisticated normalized oscillator analysis through flexible baseline architecture and dynamic threshold adaptation. Unlike traditional oscillators with fixed levels, the BDO automatically adjusts overbought/oversold zones based on recent oscillator behavior while maintaining consistent ATR normalization for reliable cross-market and cross-timeframe comparison. The system's combination of multiple MA type support, HL median filtering, and intelligent zone expansion makes it essential for traders seeking adaptive momentum analysis with reduced false signals and comprehensive reversal detection across cryptocurrency, forex, and equity markets.

Frequency Momentum Oscillator [QuantAlgo]🟢 Overview
The Frequency Momentum Oscillator applies Fourier-based spectral analysis principles to price action to identify regime shifts and directional momentum. It calculates Fourier coefficients for selected harmonic frequencies on detrended price data, then measures the distribution of power across low, mid, and high frequency bands to distinguish between persistent directional trends and transient market noise. This approach provides traders with a quantitative framework for assessing whether current price action represents meaningful momentum or merely random fluctuations, enabling more informed entry and exit decisions across various asset classes and timeframes.
🟢 How It Works
The calculation process removes the dominant trend from price data by subtracting a simple moving average, isolating cyclical components for frequency analysis:
detrendedPrice = close - ta.sma(close , frequencyPeriod)
The detrended price series undergoes frequency decomposition through Fourier coefficient calculation across the first 8 harmonics. For each harmonic frequency, the algorithm computes sine and cosine components across the lookback window, then derives power as the sum of squared coefficients:
for k = 1 to 8
cosSum = 0.0
sinSum = 0.0
for n = 0 to frequencyPeriod - 1
angle = 2 * math.pi * k * n / frequencyPeriod
cosSum := cosSum + detrendedPrice * math.cos(angle)
sinSum := sinSum + detrendedPrice * math.sin(angle)
power = (cosSum * cosSum + sinSum * sinSum) / frequencyPeriod
Power measurements are aggregated into three frequency bands: low frequencies (harmonics 1-2) capturing persistent cycles, mid frequencies (harmonics 3-4), and high frequencies (harmonics 5-8) representing noise. Each band's power normalizes against total spectral power to create percentage distributions:
lowFreqNorm = totalPower > 0 ? (lowFreqPower / totalPower) * 100 : 33.33
highFreqNorm = totalPower > 0 ? (highFreqPower / totalPower) * 100 : 33.33
The normalized frequency components undergo exponential smoothing before calculating spectral balance as the difference between low and high frequency power:
smoothLow = ta.ema(lowFreqNorm, smoothingPeriod)
smoothHigh = ta.ema(highFreqNorm, smoothingPeriod)
spectralBalance = smoothLow - smoothHigh
Spectral balance combines with price momentum through directional multiplication, producing a composite signal that integrates frequency characteristics with price direction:
momentum = ta.change(close , frequencyPeriod/2)
compositeSignal = spectralBalance * math.sign(momentum)
finalSignal = ta.ema(compositeSignal, smoothingPeriod)
The final signal oscillates around zero, with positive values indicating low-frequency dominance coupled with upward momentum (trending up), and negative values indicating either high-frequency dominance (choppy market) or downward momentum (trending down).
🟢 How to Use This Indicator
→ Long/Short Signals: the indicator generates long signals when the smoothed composite signal crosses above zero (indicating low-frequency directional strength dominates) and short signals when it crosses below zero (indicating bearish momentum persistence).
→ Upper and Lower Reference Lines: the +25 and -25 reference lines serve as threshold markers for momentum strength. Readings beyond these levels indicate strong directional conviction, while oscillations between them suggest consolidation or weakening momentum. These references help traders distinguish between strong trending regimes and choppy transitional periods.
→ Preconfigured Presets: three optimized configurations are available with Default (32, 3) offering balanced responsiveness, Fast Response (24, 2) designed for scalping and intraday trading, and Smooth Trend (40, 5) calibrated for swing trading and position trading with enhanced noise filtration.
→ Built-in Alerts: the indicator includes three alert conditions for automated monitoring - Long Signal (momentum shifts bullish), Short Signal (momentum shifts bearish), and Signal Change (any directional transition). These alerts enable traders to receive real-time notifications without continuous chart monitoring.
→ Color Customization: four visual themes (Classic green/red, Aqua blue/orange, Cosmic aqua/purple, Custom) allow chart customization for different display environments and personal preferences.

GTI - Overbought and Oversold indicatorFor this indicator I've merged 6 indicators (RSI, Stochastic, CCI, MFI, UO and William %R) that are decent to spot overbought and oversold conditions into one indicator.
The idea is the more indicators that agree on overbought and oversold conditions, the better chance that the condition is correct.
Possible input settings
Set your own values for the overbought and oversold bands.
Noise suppression (On/Off)
Length for noise suppression calculations
Overbought noise suppression
Oversold noise suppression
Plot divergences (On/Off)
Left/Right lookback settings for finding pivot highs/lows
Min/Max lookback range to compare pivots for divergences
Style settings
Enabled/Disable the line for reversal value
Set the color for the line (default is 100% transparent value)
Enable/Disable fill color between reversal value and the 0 line
Set the fill color
Precision for reversal value, default is 2
Explanations
The scale goes from 100 to -100, where outliners above 85 or below -85 is expected to be extremely rare. The overbought and oversold bands are calculated from the typical values from each indicator used in the calculation.
The noise suppression is a percentile calculation from the last X bars back, where X is the length you set in the settings. 100 is the default value. This is very good to use in strong trends as an asset in a strong bullish trend tend to not touch/breach the oversold band and vise versa. The percentile calculation might still be able to catch the overbought/oversold condition in a strong opposite trending asset. 85 is a default value, but keep in mind that every asset moves differently due to their liquidity pool. The default is only a guide line.
The divergence settings only plots normal divergences. Hidden divergences are not calculated.
If you want the possibility to plot/see hidden divergences too, let me know in the comments. If enough people wants it I'll consider adding them.
when it comes to the style, you might be a bit confused at first. The reversal value is enabled, but not showing. That's because it's enabled with 100% transparency as I like using the fill more than just a line.
If you want to use a line instead of the fill, Disable the fill -> edit reversal value color -> set your chosen color and make sure to remove the transparency to make it visible.
Exmaple, ticker NOVO_B
In the example ticker I've enabled "Noise suppression", using the default 100 length and set noise suppression for both OB and OS to 90.
The green and red circles are plotted when the "reversal value" falls below the percentile set, indicating that a possible top was just formed.
Keep in mind that strong bullish or bearish trends tend to stay overbought/oversold for a longer time and are likely to print several false signals before the eventual reversal. If a divergences is printed, normally that is either the bottom or close to the bottom before a stronger reversal.
Suggestion
As all other indicators, don't use this indicator alone to spot reversals. Use it together with 1-3 other indicators like MACD, ADX and OBV. I like to use MACD as a confirmation tool after this tool starts indicating overbought/oversold conditions.
For an overbought condition, wait for MACD to cross below the signal line.
For an oversold condition, wait for the MACD to cross above the signal line.
This way you don't act on false signal.
Another way would be to use a DCA strategy, where you buy on each signal. In such a situation I suggest starting small enough to be able to double the total for each time, example below.
First signal: $100, then another $100 on second signal, $200 on third signal, $400 on fourth signal and so on. The amounts are an example, find what works for you.

RSI Maniac
RSI Maniac
A powerful, fully-customizable RSI indicator designed for traders who want deeper insight into momentum across multiple timeframes. This indicator enhances the traditional RSI by adding multi-timeframe analysis, multi-timeframe moving averages, and optional Bollinger Bands applied directly on the RSI curve.
----- Key Features -----
1️⃣ Multi-Timeframe RSI (HTF RSI) : Analyse higher-timeframe momentum while staying on your current chart.
Enable/Disable HTF RSI
Select any timeframe (1m → 1M)
Dedicated RSI length & source for HTF
Great for spotting:
Trend confirmation or divergence between LTF & HTF momentum
2️⃣ Multi-Timeframe Moving Averages : A powerful addition for traders using higher timeframe confirmation.
Enable/Disable HTF MAs
Independent Fast & Slow MA settings
Separate HTF timeframe
Separate MA type for HTF (EMA or HMA)
Great for spotting:
HTF RSI trend direction
HTF momentum overlays on LTF RSI
Cross-timeframe momentum alignment
🎛️ Clean & Organized User Interface : The indicator organizes settings into intuitive groups.
Current Timeframe RSI
Current Timeframe MA
Higher Timeframe RSI
Higher Timeframe MA
Bollinger Bands Settings
Traders can toggle any component independently.
How to trade ?
Based on my approach, I don’t use RSI to catch reversals. Instead, I use it to trade continuations—when the lower timeframe (LTF) RSI aligns with the higher timeframe (HTF) trend. I simply wait for the LTF RSI to move in the same direction as the HTF RSI and then take the continuation trade. Please check the snapshots for a clearer understanding of how these trades work.
Trade less, trade better!


AURORA LEGACY INDICATOR
The AURORA LEGACY is an advanced indicator developed in Pine Script v6 for the TradingView platform, designed to integrate multiple approaches of technical analysis into a single modular and customizable system. Its architecture combines classic elements, such as exponential moving averages (EMA Ribbon), RSI, and ATR, with modern tools inspired by Smart Money Concepts (SMC), including Supply & Demand zones, Break of Structure (BOS), and Points of Interest (POI).
The indicator is structured to provide traders with flexibility, offering pre-configured trading profiles (Scalper, Day Trade, Swing Trade, Sniper) or full manual customization of moving averages. The dynamic Ribbon serves as the core of trend analysis, supported by additional confluences through secondary moving averages (VWMA, LWMA, SMMA) and volatility filters based on ATR.
Key features include:
Trend & Signal System: detection of reversals and trend confirmations through Ribbon color alignment, with automated buy/sell alerts.
Automated Risk Management: dynamic calculation of entry levels, Stop Loss (SL), and multiple Take Profits (TPs), displayed on chart with labels and risk-reward ratio (R:R).
Multi-Timeframe (MTF) Trend Table: consolidated overview of trend, RSI, and volatility (ATR) across different timeframes (5M, 15M, 1H, 4H, Daily).
Smart Money Concepts Integration: automatic detection and marking of Supply & Demand zones, BOS, market structure zigzag, and points of interest.
Complementary Tools: customizable RSI signals by profile, daily support and resistance levels, CPR levels, and visual session markers (London, New York) including overlap zones.
This system was designed to provide a holistic trading approach, combining price action, volatility, indicator confluence, and institutional concepts to support traders of different profiles in making clearer and more precise decisions.

Known Reversals (CreativeAdvance)1 min left to edit script
13 minutes ago
Known Reversals (CreativeAdvance)
Manage access
Add to favorites
Use on chart
0
0
Known Reversals
Non-repainting 1-bar reversal detector
What it does:
Pinpoints the earliest confirmed reversals by detecting a subtle divergence within prevailing momentum. Delivers signals with zero lag and no repaint.
Core logic:
- Monitors directional momentum via highs in uptrends and lows in downtrends
- Activates only when the **close breaks alignment** with that momentum in a single candle
- Proprietary volatility-adjusted oscillator ensures signals fire exclusively in high-probability reversal contexts
Key advantage:
Reveals lower-timeframe reversals the moment they confirm on the current chart — true X-ray vision for precision entries.
Pro tip:
Use with distinct candlestick outline colors to instantly distinguish bullish vs. bearish signals, especially on inside bar reversals (painted uniformly for clarity).
No inputs. No curve-fitting. Just pure, actionable reversal confirmation.

CandelaCharts - Trend Oscillator 📝 Overview
Trend Oscillator is a simple yet effective trend identification tool that uses the relationship between two exponential moving averages (EMAs) to determine market direction. It calculates the spread between a fast and slow EMA, applies a bias multiplier, and smooths the result to produce a clean oscillator that oscillates above and below a zero line. When the oscillator is above zero, the trend is considered bullish (upward); when below zero, it's bearish (downward). The indicator provides clear visual feedback through color-coded plots and optional price bar coloring, making it easy to identify trend direction at a glance.
📦 Features
This section highlights the core capabilities you'll rely on most.
Dual EMA system — Uses a fast EMA (default 9) and slow EMA (default 21) to capture trend momentum and direction.
Bias multiplier — Applies a small multiplier (default 1.001) to the EMA spread, providing a slight bias that helps filter noise and confirm trend strength.
Smoothed output — Applies an additional EMA smoothing (default 5 periods) to the raw spread, creating a cleaner, less choppy oscillator line.
Zero-line reference — Plots a horizontal zero line that serves as the critical threshold between bullish and bearish conditions.
Color-coded visualization — Automatically colors the oscillator line green/lime when bullish (above zero) and red when bearish (below zero).
Price bar coloring — Optional feature to color price bars based on the current trend direction, providing immediate visual context on the main chart.
Customizable parameters — Adjust EMA lengths, bias multiplier, smoothing period, and colors to match your trading style and timeframe.
⚙️ Settings
Use these controls to fine-tune the oscillator's sensitivity, appearance, and behavior.
Fast EMA Length — Period for the fast exponential moving average (default: 9). Lower values make the indicator more responsive to price changes.
Slow EMA Length — Period for the slow exponential moving average (default: 21). Higher values create a smoother baseline for trend identification.
Bias Multiplier — Multiplier applied to the EMA spread (default: 1.001). Small adjustments can help filter minor whipsaws and confirm trend strength.
Smoothing Length — Period for smoothing the raw spread calculation (default: 5). Higher values create a smoother oscillator line but may lag price action.
Colors — Set the bullish (default: lime) and bearish (default: red) colors for the oscillator line.
Color Price Bars — Toggle to enable/disable coloring of price bars based on the current trend direction.
⚡️ Showcase
Oscillator Line
Bar Coloring
Divergences
📒 Usage
Follow these steps to effectively use Trend Oscillator for trend identification and trading decisions.
1) Select your timeframe — The indicator works across all timeframes, but higher timeframes (daily, weekly, monthly) typically provide more reliable trend signals with less noise. Lower timeframes (1m, 5m, 15m) may produce more frequent but potentially less reliable signals. Consider your trading style: swing traders benefit from daily/weekly charts, while day traders can use 15m/1h timeframes. Always align the indicator's sensitivity with your timeframe choice.
2) Adjust EMA lengths — The default 9/21 combination works well for most cases. For faster signals, try 5/13; for slower, more conservative signals, try 12/26 or 20/50. Match the lengths to your trading style and timeframe.
3) Interpret the zero line — When the oscillator is above zero (green/lime), the trend is bullish. When below zero (red), the trend is bearish. The further from zero, the stronger the trend.
4) Watch for crossovers — Trend changes occur when the oscillator crosses the zero line. A cross from below to above indicates a shift to bullish; from above to below indicates a shift to bearish.
5) Identify divergences — Divergences can signal potential trend reversals. Bullish divergence : price makes lower lows while the oscillator makes higher lows (suggests weakening bearish momentum). Bearish divergence : price makes higher highs while the oscillator makes lower highs (suggests weakening bullish momentum). Divergences are most reliable when they occur near extreme levels and should be confirmed with price action before taking trades.
6) Use smoothing wisely — The smoothing parameter helps reduce noise but adds lag. Lower smoothing (3-5) is more responsive; higher smoothing (7-10) is more stable but slower to react.
7) Combine with price action — Use the oscillator to confirm trend direction, then look for entry opportunities when price pulls back in the direction of the trend. The optional price bar coloring helps visualize trend alignment on the main chart.
8) Filter with bias multiplier — The bias multiplier can help reduce false signals. Experiment with values between 1.000 and 1.005 to find the sweet spot for your instrument and timeframe.
🚨 Alerts
There are no built-in alerts in this version.
⚠️ Disclaimer
Trading involves significant risk, and many participants may incur losses. The content on this site is not intended as financial advice and should not be interpreted as such. Decisions to buy, sell, hold, or trade securities, commodities, or other financial instruments carry inherent risks and are best made with guidance from qualified financial professionals. Past performance is not indicative of future results.

Average True Range with MAKey features
ATR calculation: true range (ta.tr(true)) is smoothed using a selectable method to produce the ATR.
ATR smoothing options: RMA, SMA, EMA, or WMA for the ATR calculation.
MA-on-ATR: a separate moving average computed on the ATR values with its own length and smoothing method.
Display controls: toggles to show/hide the ATR and the ATR MA independently.
Appearance controls: separate color inputs for the ATR and the ATR MA, and a thicker line for the MA (linewidth=2).
Inputs
ATR Length (default 14): length used to smooth true range into the ATR.
ATR Smoothing (default RMA): smoothing method applied to the true range to form ATR.
MA Length (on ATR) (default 14): length for the moving average applied to the ATR series.
MA Smoothing (default SMA): smoothing method used for the MA applied to ATR.
Show ATR / Show ATR MA: booleans to toggle visibility.
ATR Color / ATR MA Color: choose plot colors.
How to interpret
ATR line: shows current volatility (average true range). Rising ATR indicates increasing volatility; falling ATR indicates decreasing volatility.
ATR MA line: smooths the ATR to reveal trend direction and reduce noise.
Use crossovers: ATR crossing above its MA may signal volatility is picking up; ATR crossing below its MA suggests volatility is subsiding.
Combine with price action or other indicators (e.g., breakout systems, position sizing rules) to make decisions based on volatility regime.
Custom Reversal Scalper – Adib NooraniCustom Reversal Scalper – Adib Noorani (Modified Edition)
An improved, non-repainting visual reversal indicator inspired by Adib Noorani's "Reversal Scalper" and updated to address key shortcomings with compliance to Adib's rules and recommendations.
Reversal Logic & Entry Filtering: Combines Adib's reversal oscillator and trend ribbon logic with added 30-minute exclusion, optimizing signals for volatile Indian indices like $NSE:NIFTY.
Shortcomings Addressed:
Eliminates repainting—entries and exits only display after the required market action.
Implements strict intraday time filtering per Adib's guidance.
Uses automatic, dynamic trailing stop (red line) post-take-profit for advanced risk management.
Maintains risk:reward visualization and minimizes chart clutter.
Directly Based on: Adib Noorani's YouTube training: www.youtube.com
How to Use:
Trade only outside first 30 minutes, per Adib's rules.
Go Long on black candle after confirmation and price crosses blue line.
Go Short on white candle after confirmation and price crosses blue line.
Stop into trailing is handled automatically after take profit.
Follow all further execution and visual risk management recommendations as per Adib's video.
This script incorporates the key corrections and execution principles demonstrated by Adib Noorani for safe scalping on Indian indices and F&O instruments.
Credits: Original logic and teaching by Adib Noorani . Modifications, anti-repainting logic, and full RR/visual improvements by script author.
For educational purposes. Please backtest and follow personal risk management.

Enhanced Multi-Indicator StrategyEnhanced Multi-Indicator Strategy v7 is a trend-following confirmation tool that combines several classic indicators into one clear “voting system.”
Instead of relying on a single signal, this script counts how many indicators agree on a bullish or bearish bias and only fires when the majority lines up and the trend is strong.
It’s designed to help you:
Filter out low-quality signals
Avoid trading against the dominant trend
Get clean, one-time BUY/SELL markers instead of noisy spam signals
How it Works
The indicator evaluates up to 10 components on each bar:
Trend & Structure
Moving Average (MA 50)
EMA Fast (20) vs EMA Slow (50)
Momentum
RSI (14)
MACD (12/26/9)
KDJ
Volatility & Price Location
Bollinger Bands (20, 2)
VWAP
Volume
Volume vs Volume MA (20)
Trend Strength & Direction
ADX + DMI (trend strength and up/down direction)
Optional
Ichimoku Cloud (price vs Senkou A/B)
Each indicator votes bullish or bearish.
The script then:
Counts how many are bullish → bullish_count
Counts how many are bearish → bearish_count
Requires at least Min Indicators for Entry (user-defined) to agree in one direction
Requires ADX above a threshold (default 20) to confirm trend strength
(Optionally) forces entries to follow the DMI trend:
Longs only in uptrends
Shorts only in downtrends
Only when these conditions are met does the script consider a valid long zone or short zone.
Signals: 1x Fire + Cooldown
To keep the chart clean and prevent over-trading:
A BUY arrow is plotted only on the first bar when price enters a new bullish zone.
A SELL arrow is plotted only on the first bar when price enters a new bearish zone.
A cooldown (in bars) can be configured separately for BUY and SELL so the script will not fire again in the same direction too frequently.
Background colors (optional):
Green background = bullish zone (majority indicators bullish + strong trend)
Red background = bearish zone (majority indicators bearish + strong trend)
This makes it easy to see when the “environment” is favorable for longs or shorts, while the arrows highlight the first opportunity in each zone.
Inputs & Tuning
Key inputs:
Min Indicators for Entry – how many indicators must agree (e.g. 5–7 for stricter filtering)
Strict Trend Filter – if enabled, entries must follow DMI trend (recommended for trend-following)
Cooldown BUY / SELL – minimum number of bars before a new signal in the same direction
Toggles to enable/disable each component (MA, EMA, RSI, MACD, KDJ, BB, Volume, VWAP, ADX, Ichimoku)
General ideas:
Increase Min Indicators for Entry and/or cooldown to reduce the number of signals and focus on stronger trends.
Lower values will make the indicator more active, suitable for shorter-term trading or scalping.
Important Note
This is an indicator, not a full trading system:
It does not manage entries/exits, position sizing, or risk by itself.
Always combine it with your own risk management, stop-loss / take-profit rules, and higher-timeframe context.
Use it as a confirmation / regime tool:
Trade only in the direction of the active zone,
Take BUY signals during bullish regimes,
Take SELL signals during bearish regimes.

hell 1good for finding tops and bottoms in a trend .set to log scale and strech it like it looks in the chart
Stoch Cross OB/OS Signals CleanStoch Cross OB/OS Signals
Displays fast (%K) and slow (%D) Stochastic lines with visual signals for overbought and oversold conditions. Alerts when the fast line crosses the slow line in OB/OS zones using customizable symbols. Ideal for spotting short-term reversals and timing entries/exits. Features adjustable periods, OB/OS levels, and symbol sizes for clear chart visualization.
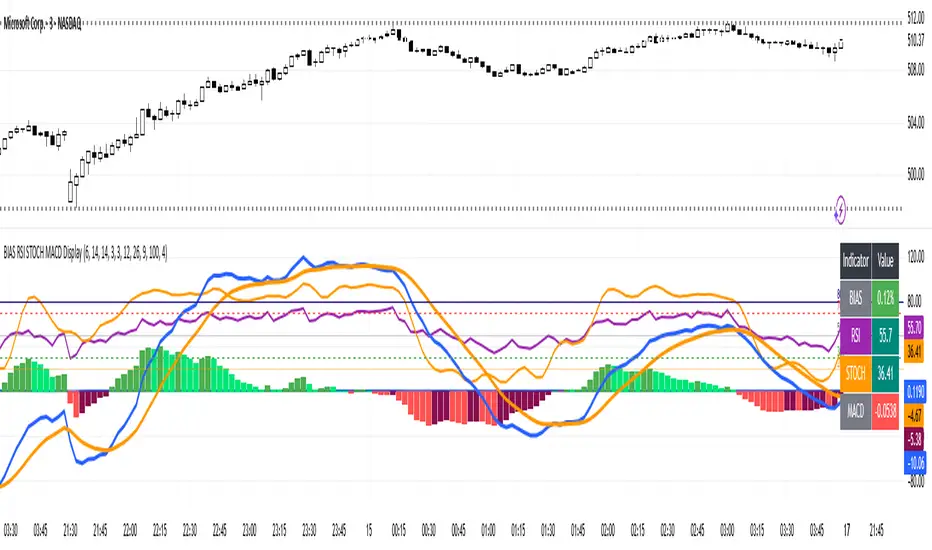
BIAS RSI STOCH MACD Displaysimple but effective to prevent chart clutter.
Hi Traders! Today I’m showing you a **custom indicator** that combines **BIAS, RSI, Stochastic, and MACD** in one easy-to-read panel. Let’s break it down:
1️⃣ **BIAS** – Shows how far the price is from its moving average.
* Positive BIAS → price is above the average.
* Negative BIAS → price is below the average.
2️⃣ **RSI (Relative Strength Index)** – Measures momentum.
* Above 70 → overbought
* Below 30 → oversold
* **50 line added** → midpoint for trend direction
3️⃣ **Stochastic (STOCH)** – Confirms momentum like RSI.
* Above 80 → overbought
* Below 20 → oversold
4️⃣ **MACD (Moving Average Convergence Divergence)** – Shows trend and momentum.
* Histogram colors indicate strength
* Lines show trend direction
5️⃣ **Visual Table** – On the top right, you can see all current indicator values at a glance, with color coding for easy interpretation.
6️⃣ **Plots & Levels** –
* BIAS, RSI, Stoch are plotted clearly
* RSI has **midline at 50** for trend reference
* Standard overbought/oversold levels highlighted
✅ **How to Use:**
* Look for RSI or Stoch crossing midline or extreme levels for potential entries.
* Check MACD histogram and lines for confirmation of trend strength.
* Use BIAS to see if price is stretched from the moving average.
This indicator is perfect for **momentum, trend, and mean-reversion traders**, giving multiple signals in one pane without clutter.
---