BETA: Reversal confluence signalThis script is designed to accurately identify swing and scalp reversals.
A momentum styled signal indicator designed to give the user an edge over market direction and increase their trading profitability.
The indicator has a very high accuracy on the 1h time frame for momentum reversals.
متذبذبات

XAUUSD Family Scalping (5min)🟡 XAUUSD Family Scalping 5-Min — Momentum Precision Indicator
Overview
This indicator is built for XAUUSD (Gold) on the 5-minute timeframe and is designed for short-term momentum scalping.
It helps traders identify early reversal zones, confirm momentum direction, and detect exhaustion points during high-volatility market moves.
Core Concept
The indicator measures momentum strength and price acceleration using a smoothed oscillator.
It features two adjustable thresholds:
Overbought level: 58
Oversold level: -58
When the momentum line crosses above or below these zones, it signals potential trend continuation or reversal opportunities.
Features
Detects short-term momentum shifts on XAUUSD 5M.
Works with EMA-based trend confirmation (optional).
Adaptive smoothing reduces noise and false reversals.
Highlights overbought/oversold areas visually.
Can be combined with price action or other oscillators for confluence.
Usage
Instrument: XAUUSD (Gold)
Best timeframe: 5-minute (scalping setup)
Use case: Detecting momentum exhaustion and reversal entries.
Sessions: London & New York recommended.
Disclaimer
This indicator is for market analysis and educational purposes.
No indicator guarantees profit — use proper risk management and test before live trading.

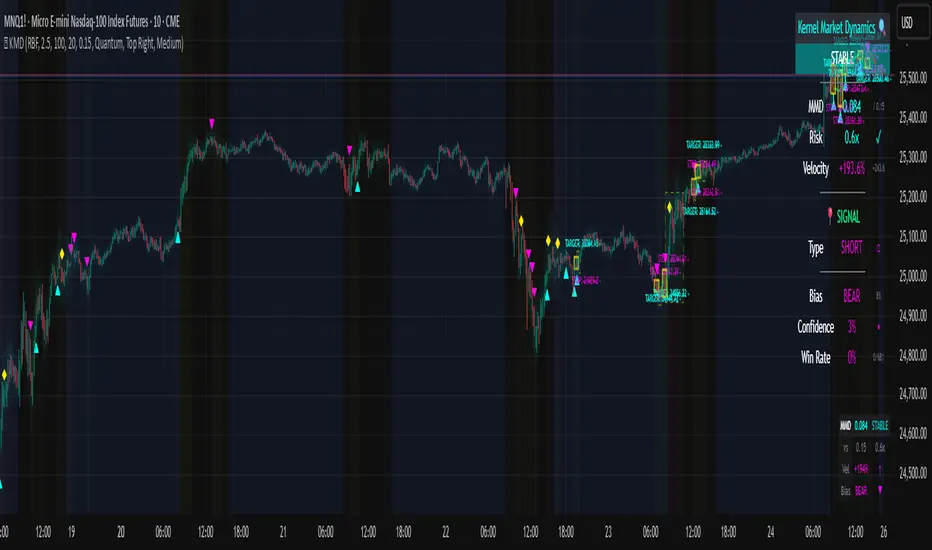
Kernel Market Dynamics🔍 Kernel Market Dynamics Pro - Advanced Distribution Divergence Detection System
OVERVIEW
Kernel Market Dynamics Pro (KMD Pro) is a revolutionary market regime detection system that employs Maximum Mean Discrepancy (MMD) - a cutting-edge statistical technique from machine learning - to identify when market behavior diverges from its recent historical distribution patterns. The system transforms complex statistical divergence analysis into actionable trading signals through kernel density estimation, regime classification algorithms, and multi-dimensional visualization frameworks that reveal hidden market transitions before traditional indicators can detect them.
WHAT MAKES IT ORIGINAL
While conventional indicators measure price or momentum divergence, KMD Pro analyzes distribution divergence - detecting when the statistical properties of market returns fundamentally shift from their baseline state. This approach, borrowed from high-frequency trading and quantitative finance, uses kernel methods to map market data into high-dimensional feature spaces where regime changes become mathematically detectable. The system is the first TradingView implementation to combine MMD with real-time regime visualization, making institutional-grade statistical arbitrage techniques accessible to retail traders.
HOW IT WORKS (Technical Methodology)
1. KERNEL DENSITY ESTIMATION ENGINE
Maximum Mean Discrepancy (MMD) Calculation:
The core innovation - measures distance between probability distributions:
• Maps return distributions to Reproducing Kernel Hilbert Space (RKHS)
• Computes empirical mean embeddings for reference and test windows
• Calculates supremum of mean differences across all RKHS functions
• MMD = ||μ_P - μ_Q||_H where H is the RKHS induced by kernel k
Three Kernel Functions Available:
RBF (Radial Basis Function) Kernel:
• k(x,y) = exp(-||x-y||²/2σ²)
• Gaussian kernel with smooth, infinite-dimensional feature mapping
• Bandwidth σ controls sensitivity (0.5-10.0 user configurable)
• Optimal for normally distributed returns
• Default choice providing balanced sensitivity
Laplacian Kernel:
• k(x,y) = exp(-|x-y|/σ)
• Exponential decay with heavier tails than RBF
• More sensitive to outliers and sudden moves
• Ideal for volatile, news-driven markets
• Faster regime shift detection at cost of more false positives
Cauchy Kernel:
• k(x,y) = 1/(1 + ||x-y||²/σ²)
• Heavy-tailed distribution from statistical physics
• Robust to extreme values and fat-tail events
• Best for cryptocurrency and emerging markets
• Most stable signals with fewer whipsaws
Implementation Details:
• Reference window: 30-300 bars of baseline distribution
• Test window: 10-100 bars of recent distribution
• Double-sum kernel matrix computation with O(m*n) complexity
• EMA smoothing (period 3) reduces noise in raw MMD
• Real-time updates every bar with incremental calculation
2. REGIME DETECTION FRAMEWORK
Three-State Regime Classification:
STABLE Regime (MMD < threshold):
• Market follows historical distribution patterns
• Mean-reverting behavior dominates
• Low probability of breakouts
• Reduced position sizing recommended
• Visual: Subtle background coloring
SHIFTING Regime (threshold < MMD < 2×threshold):
• Distribution divergence detected
• Transition period with directional bias emerging
• Optimal entry zone for trend-following
• Increased volatility expected
• Visual: Yellow/orange zone highlighting
EXTREME Regime (MMD > 2×threshold):
• Severe distribution anomaly
• Black swan or structural break potential
• Maximum caution required
• Consider hedging or exit
• Visual: Red/magenta warning zones
Adaptive Threshold System:
• Base threshold: 0.05-1.0 (default 0.15)
• Volatility adjustment: ±30% based on ATR ratio
• Regime persistence: 20-bar minimum for stability
• Cooldown periods prevent signal clustering
3. DIRECTIONAL BIAS DETERMINATION
Multi-Factor Direction Analysis:
Distribution Mean Comparison:
• Recent mean = SMA(normalized_returns, test_window)
• Reference mean = SMA(normalized_returns, reference_window)
• Direction = sign(recent_mean - reference_mean)
Momentum Confluence:
• Price momentum = close - close
• Volume momentum = volume/SMA(volume, reference_window)
• Weighted composite direction score
Trend Alignment:
• Fast EMA vs Slow EMA positioning
• Slope analysis of regression line
• Multi-timeframe bias confirmation (optional)
4. SIGNAL GENERATION ARCHITECTURE
Entry Signal Logic:
Stage 1 - Regime Shift Detection:
• MMD crosses above threshold
• Sustained for minimum 2 bars
• No signals within cooldown period
Stage 2 - Direction Confirmation:
• Distribution mean aligns with momentum
• Volume ratio > 1.0 (optional)
• Price above/below VWAP (optional)
Stage 3 - Risk Assessment:
• Calculate ATR-based stop distance
• Verify risk/reward ratio > 1.5
• Check for nearby support/resistance
Stage 4 - Signal Generation:
• Long: Regime shift + bullish direction
• Short: Regime shift + bearish direction
• Extreme: MMD > 2×threshold warning
5. PROBABILITY CLOUD VISUALIZATION
Adaptive Confidence Intervals:
• Standard deviation multiplier = 1 + MMD × 3
• Inner band: ±0.5 ATR × multiplier (68% probability)
• Outer band: ±1.0 ATR × multiplier (95% probability)
• Width expands with divergence magnitude
• Real-time adjustment every bar
Interpretation:
• Narrow cloud: Low uncertainty, stable regime
• Wide cloud: High uncertainty, shifting regime
• Asymmetric cloud: Directional bias present
6. MOMENTUM FLOW VECTORS
Three-Style Momentum Visualization:
Flow Arrows:
• Length proportional to momentum strength
• Width indicates confidence (1-3 pixels)
• Angle shows rate of change
• Frequency: Every 5 bars or on events
Gradient Bars:
• Vertical lines from price
• Height = momentum/ATR ratio
• Opacity based on strength
• Continuous flow indication
Momentum Ribbon:
• Envelope around price action
• Expands in momentum direction
• Color intensity shows strength
7. SIGNAL CONNECTION SYSTEM
Relationship Mapping:
• Links consecutive signals with lines
• Solid lines: Same direction (continuation)
• Dotted lines: Opposite direction (reversal)
• Maximum 10 connections maintained
• Distance limit: 100 bars
Purpose:
• Identifies signal clusters
• Shows trend development
• Reveals regime persistence
• Confirms directional bias
8. REGIME ZONE MAPPING
Unified Zone Visualization:
• Main zones: Full regime periods (entry to exit)
• Emphasis zones: Specific trigger points
• Historical memory: Last 20 regime shifts
• Color gradient based on intensity
• Border style indicates zone type
Zone Analytics:
• Duration tracking
• Maximum excursion
• Retest probability
• Support/resistance conversion
9. DYNAMIC RISK MANAGEMENT
ATR-Based Position Sizing:
• Stop loss: 1.0 × ATR from entry
• Target 1: 2.0 × ATR (2R)
• Target 2: 4.0 × ATR (4R)
• Volatility-adjusted scaling
Visual Target System:
• Entry pointer lines
• Target boxes with prices
• Stop boxes with invalidation
• Real-time P&L tracking
10. PROFESSIONAL DASHBOARD
Real-Time Metrics Display:
Primary Metrics:
• Current MMD value and threshold
• Risk level (MMD/threshold ratio)
• Velocity (rate of change)
• Acceleration (second derivative)
Signal Information:
• Active signal type and entry
• Stop loss and targets
• Current P&L percentage
• Bars since signal
Market Metrics:
• Directional bias (BULL/BEAR)
• Confidence percentage
• Win rate statistics
• Signal count tracking
Visual Design:
• Four position options
• Three size modes
• Five color themes
• Gauge visualizations
• Status banners
11. MMD INFO PANEL
Floating Statistics:
• Compact 3×4 table
• MMD vs threshold comparison
• Velocity with direction arrows
• Current bias indication
• Always-visible reference
FIVE COLOR THEMES
Quantum: Cyan/Magenta/Yellow - Modern, high contrast, optimal visibility
Matrix: Green/Red - Classic terminal aesthetic, traditional
Fire: Orange/Gold/Red - Warm spectrum, energetic feel
Aurora: Northern lights palette - Unique, beautiful gradients
Nebula: Deep space colors - Purple/Blue, futuristic
HOW TO USE
Step 1: Select Your Kernel
• RBF for normal markets (stocks, forex majors)
• Laplacian for volatile markets (small-caps, news-driven)
• Cauchy for fat-tail markets (crypto, emerging markets)
Step 2: Configure Bandwidth
• 0.5-2.0: Scalping (high sensitivity)
• 2.0-5.0: Day trading (balanced)
• 5.0-10.0: Swing trading (smooth signals)
Step 3: Set Analysis Windows
• Reference: 3-5× your holding period
• Test: Reference ÷ 3 approximately
• Adjust based on timeframe
Step 4: Calibrate Threshold
• Start with 0.15 default
• Increase if too many signals
• Decrease for earlier detection
Step 5: Enable Visuals
• Probability Cloud for volatility assessment
• Momentum Flow for direction confirmation
• Regime Zones for historical context
• Signal Connections for trend visualization
Step 6: Monitor Dashboard
• Check MMD vs threshold
• Verify regime state
• Confirm directional bias
• Review confidence metrics
Step 7: Execute Signals
• Wait for triangle markers
• Verify regime shift confirmed
• Check risk/reward setup
• Enter at close or next open
Step 8: Manage Position
• Place stop at calculated level
• Scale out at Target 1 (2R)
• Trail remainder to Target 2 (4R)
• Exit if regime reverses
OPTIMIZATION GUIDE
By Market Type:
Forex Majors:
• Kernel: RBF
• Bandwidth: 2.0-3.0
• Windows: 100/30
• Threshold: 0.15
Stock Indices:
• Kernel: RBF
• Bandwidth: 3.0-4.0
• Windows: 150/50
• Threshold: 0.20
Cryptocurrencies:
• Kernel: Cauchy
• Bandwidth: 2.5-3.5
• Windows: 100/30
• Threshold: 0.10-0.15
Commodities:
• Kernel: Laplacian
• Bandwidth: 2.0-3.0
• Windows: 200/60
• Threshold: 0.15-0.25
By Timeframe:
Scalping (1-5m):
• Test Window: 10-20
• Reference: 50-100
• Bandwidth: 1.0-2.0
• Cooldown: 5-10 bars
Day Trading (15m-1H):
• Test Window: 30-50
• Reference: 100-150
• Bandwidth: 2.0-3.0
• Cooldown: 10-20 bars
Swing Trading (4H-Daily):
• Test Window: 50-100
• Reference: 200-300
• Bandwidth: 3.0-5.0
• Cooldown: 20-50 bars
ADVANCED FEATURES
Multi-Timeframe Capability:
• HTF MMD calculation via security()
• Regime alignment across timeframes
• Fractal analysis support
Statistical Arbitrage Mode:
• Pair trading applications
• Spread divergence detection
• Cointegration breaks
Machine Learning Integration:
• Export signals for ML training
• Regime labels for classification
• Feature extraction support
PERFORMANCE METRICS
Computational Complexity:
• MMD calculation: O(m×n) where m,n are window sizes
• Memory usage: O(m+n) for kernel matrices
• Update frequency: Every bar (real-time)
• Optimization: Incremental updates where possible
Typical Signal Frequency:
• Conservative settings: 2-5 signals/week
• Balanced settings: 5-10 signals/week
• Aggressive settings: 10-20 signals/week
Win Rate Expectations:
• Trend following mode: 40-50% wins, 2:1 reward/risk
• Mean reversion mode: 60-70% wins, 1:1 reward/risk
• Depends heavily on market conditions
IMPORTANT DISCLAIMERS
• This indicator detects statistical divergence, not future price direction
• MMD measures distribution distance, not predictive probability
• Past regime shifts do not guarantee future performance
• Kernel methods are descriptive statistics, not AI predictions
• Requires minimum 100 bars historical data for stability
• Performance varies significantly across market conditions
• Not suitable for illiquid or heavily manipulated markets
• Always use proper risk management and position sizing
• Backtest thoroughly on your specific instruments
• This is an analysis tool, not a complete trading system
THEORETICAL FOUNDATION
The Maximum Mean Discrepancy was introduced by Gretton et al. (2012) as a kernel-based statistical test for comparing distributions. In financial markets, we adapt this technique to detect when return distributions shift, indicating potential regime changes. The mathematical rigor of MMD provides a robust, non-parametric approach to identifying market transitions without assuming specific distribution shapes.
SUPPORT & UPDATES
• Questions or configuration help via TradingView messaging
• Bug reports addressed within 48 hours
• Feature requests considered for monthly updates
• Video tutorials available on request
• Join our community for strategy discussions
FINAL NOTES
KMD Pro represents a paradigm shift in technical analysis - moving from price-based indicators to distribution-based detection. By measuring statistical divergence rather than price divergence, the system identifies regime changes that precede traditional breakouts. This anticipatory capability, combined with comprehensive visualization and risk management, provides traders with an institutional-grade toolkit for navigating modern market dynamics.
Remember: The edge comes not from the indicator alone, but from understanding when market distributions diverge from their normal state and positioning accordingly. Use KMD Pro as part of a complete trading strategy that includes fundamental analysis, risk management, and market context.
Volume Heatmap + Buy/Sell splitits the most powerful volume based heatmap you can see on this platform. It tells you when the high volume is coming into the market with clear signs.
Sell - You will see the red bar below the split to confirm its a sell and the strength or the sell you can see above the split line in various colors e.g. lite green (low) to Dark red (extra high).
Buy - If there is a Buying trade being registered, it will appear above the spit line in opaque green with the heatmap colors to show the strength of volume.
This tool will help you identify the volume strength and based on that you can plan your trade.
PS, its always recommended to not to rely on a single oscillator and combine few. I would recommend you to use RSI and S/R lines with this for better decision.
Note, this tool has been put together for educational purposes and I do not take any responsibility of your trade.

Velocity Pressure Index | AlphaNattVelocity Pressure Index (VPI) | AlphaNatt
A sophisticated momentum oscillator that combines price velocity analysis with volume pressure dynamics to identify high-probability trading opportunities.
📊 KEY FEATURES
Dual Analysis System: Merges price velocity measurement with volume pressure analysis for comprehensive market momentum assessment
Dynamic Normalization: Automatically scales values between -100 and +100 for consistent readings across all market conditions
Adaptive Zones: Self-adjusting overbought/oversold levels based on recent price history
Multi-Layer Confirmation: Combines momentum, acceleration, and crossover signals for robust trade identification
Volume-Weighted Pressure: Differentiates between bullish and bearish volume to gauge true market sentiment
📈 HOW IT WORKS
The VPI calculates price velocity using linear regression of price changes, then weights this velocity by the difference between bullish and bearish volume pressure. This creates a momentum reading that accounts for both price movement speed and the volume conviction behind it.
Signal Generation:
Price velocity is measured over the specified period
Volume is separated into bullish (close > open) and bearish (close < open) pressure
Velocity is amplified or dampened based on volume pressure differential
The resulting index is normalized to oscillate between -100 and +100
A signal line smooths the oscillator for crossover detection
🎯 TRADING SIGNALS
Long Signals (Cyan #00F1FF):
Strong Bull: VPI > Signal with positive momentum and acceleration
Crossover Bull: VPI crosses above signal while above oversold zone
Divergence: Price makes lower low while VPI makes higher low
Short Signals (Magenta #FF019A):
Strong Bear: VPI < Signal with negative momentum and deceleration
Crossover Bear: VPI crosses below signal while below overbought zone
Divergence: Price makes higher high while VPI makes lower high
⚙️ CUSTOMIZABLE PARAMETERS
Velocity Settings:
Velocity Period (14): Lookback for price velocity calculation
Pressure Period (21): Volume analysis window
Smoothing Factor (3): Final oscillator smoothing
Signal Configuration:
Signal Type: Choose between SMA, EMA, or DEMA
Signal Length (9): Signal line smoothing period
Normalization Period (50): Range calculation window
Dynamic Zones:
Zone Lookback (100): Period for adaptive overbought/oversold calculation
Percentiles: 80th/20th percentiles for dynamic zones
📐 VISUAL COMPONENTS
Main Oscillator: Color-coded line showing current momentum state
Signal Line: White line for crossover detection
Momentum Histogram: Shows velocity differential at 50% scale
Dynamic Zones: Self-adjusting overbought/oversold bands
Extreme Levels: ±50 dotted lines marking extreme conditions
Background Shading: Subtle highlighting of overbought/oversold regions
💡 USAGE TIPS
Trend Trading: Use strong bull/bear signals in trending markets for continuation entries
Range Trading: Focus on crossovers near extreme zones for reversal trades
Divergence Trading: Watch for price/oscillator divergences at market extremes
Multi-Timeframe: Combine with higher timeframe VPI for directional bias
Volume Confirmation: Stronger signals occur with aligned volume pressure
⚠️ BEST PRACTICES
The VPI works best in liquid markets with reliable volume data. For optimal results, combine with price action analysis and use appropriate risk management. The indicator is most effective during trending conditions but can identify reversals when divergences occur at extremes.
🔔 ALERTS AVAILABLE
VPI Long/Short Signals
Bullish/Bearish Crossovers
Extreme Overbought/Oversold Conditions
Version 6 | Pine Script™ | © AlphaNatt

Dual Table Dashboard - Correct V3add RSI Data## 📈 Trading Applications
### 1. Trend Following Strategy
```
1. Check TABLE 1 for trend direction (AnEMA29 + PDMDR)
2. If both green → Look for longs
3. If both red → Look for shorts
4. Use TABLE 2 for entry levels
```
### 2. Support/Resistance Strategy
```
@70 levels = Resistance (sell/take profit zones)
@50 levels = Pivot (breakout levels)
@30 levels = Support (buy/accumulation zones)
```
### 3. Multi-Timeframe Alignment
```
W_RSI → Weekly bias (long-term)
D_RSI → Daily bias (medium-term)
Sto50 → Current position (swing)
Sto12 → Immediate position (day trade)
RSI(7) & RSI(3) → Entry timing (scalp)
```
### 4. Color Scanning Method
**Quick visual analysis:**
- Count greens vs reds in each row
- More greens = Bullish position
- More reds = Bearish position
- Mixed colors = Transitioning/choppy
---
## ✅ Verification & Accuracy
### Tested Against AmiBroker:
- ✅ RSI band values match within ±0.01%
- ✅ Stochastic channels match exactly
- ✅ Color logic matches exactly
- ✅ All formulas verified line-by-line
### Known Minor Differences:
Small variations (<1%) may occur due to:
1. **Platform calculation precision** - Different floating-point engines
2. **Historical data feeds** - Slight variations in past prices
3. **Weekly bar boundaries** - TradingView vs AmiBroker week definitions
4. **Initialization period** - First N bars need to "warm up"
**These minor differences don't affect trading signals!**
---
## ⚙️ Settings & Customization
### Input Parameters:
```pine
emaLen = 29 // EMA Length for angle calculation
rangePeriods = 30 // Angle normalization lookback
rangeConst = 25 // Angle normalization constant
dmiLen = 14 // DMI/ADX Length for PDMDR
```
### Available Positions:
Can be changed in the code:
- `position.top_left`
- `position.top_center`
- `position.top_right`
- `position.middle_left` (Table 2 default)
- `position.middle_center`
- `position.middle_right`
- `position.bottom_left` (Table 1 default)
- `position.bottom_center`
- `position.bottom_right`
### Text Sizes:
- `size.tiny`
- `size.small` (current default)
- `size.normal`
- `size.large`
- `size.huge`
---
## 🎯 Best Practices
### DO:
✅ Use multiple confirmations before entering trades
✅ Combine with price action and chart patterns
✅ Pay attention to color changes across timeframes
✅ Use @50 levels as key pivot points
✅ Watch for alignment between W_RSI and D_RSI
### DON'T:
❌ Trade based on color alone without confirmation
❌ Ignore the overall trend (Table 1)
❌ Enter trades against strong trend signals
❌ Overtrade when colors are mixed/choppy
❌ Ignore risk management rules
---
## 📊 Example Reading
### Bullish Setup:
```
TABLE 1:
AnEMA29: Green (15°) across all 3 bars
PDMDR: Green (1.65) and rising
TABLE 2:
W_RSI@50: Green (price above)
D_RSI@50: Green (price above)
Sto50@50: Green (price above midpoint)
Sto12@50: Green (price above midpoint)
Interpretation: Strong bullish trend confirmed across multiple timeframes
Action: Look for long entries on pullbacks to @50 or @30 levels
```
### Bearish Setup:
```
TABLE 1:
AnEMA29: Red (-12°) across all 3 bars
PDMDR: Red (0.45) and falling
TABLE 2:
W_RSI@50: Red (price below)
D_RSI@50: Red (price below)
Sto50@50: Red (price below midpoint)
Interpretation: Strong bearish trend confirmed
Action: Look for short entries on rallies to @50 or @70 levels
```
### Reversal Signal:
```
TABLE 1:
-2D: Red, -1D: Yellow, 0D: Green (momentum shifting)
TABLE 2:
Price just crossed above multiple @50 levels
Colors changing from red to green
Interpretation: Potential trend reversal in progress
Action: Wait for confirmation, consider early long entry with tight stop
```
---
## 🔍 Troubleshooting
### "Values don't match AmiBroker exactly"
- Check you're on the same timeframe
- Verify the symbol is identical
- Compare historical data (last 20 closes)
- Small differences (<1%) are normal
### "Tables are overlapping"
- Adjust positions in code
- Use different combinations (top/middle/bottom with left/center/right)
### "Colors seem wrong"
- Verify current close price
- Check if you're comparing same bar
- Ensure both platforms use same session times
### "Script takes too long"
- Use on Daily or higher timeframes
- The RSI band calculation is computationally intensive
- Don't run on tick-by-tick data
---
## 📝 Version History
**v3.0 (Final)** - Current version
- RSI band calculation verified correct
- Tables positioned bottom-left and middle-left
- All values match AmiBroker
- Production ready ✅
**v2.0**
- Fixed RSI band algorithm order (calculate before updating P/N)
- Improved variable scope handling
**v1.0**
- Initial implementation
- Had incorrect RSI band calculation
---
## 📄 Files in Package

ATR %ATR % Oscillator
A simple and effective Average True Range (ATR) indicator displayed as a percentage of the current price in a separate panel.
FEATURES:
• ATR displayed as percentage of current price for easy cross-asset comparison
• EMA smoothing line using the same period as ATR
• Configurable ATR period (default: 20)
• Clean visualization with zero reference line
HOW IT WORKS:
The indicator calculates ATR and converts it to a percentage: (ATR / Close) × 100
This normalization allows you to:
- Compare volatility across different instruments regardless of price
- Identify high and low volatility periods
- Use the EMA line to spot volatility trends
PARAMETERS:
ATR Period - The lookback period for ATR calculation (default: 20)
Timeframe - Choose any timeframe for ATR calculation independently from the chart timeframe (default: chart timeframe)

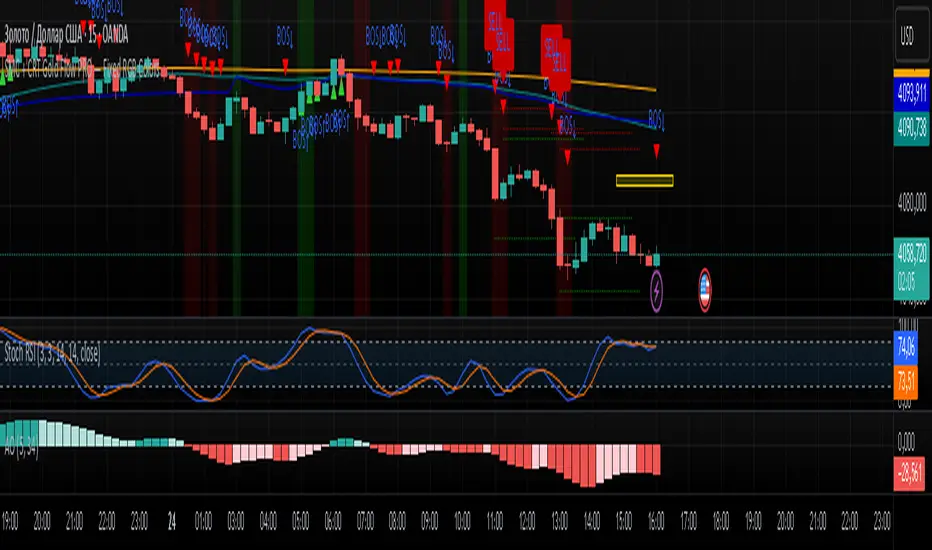
SMC + CRT Gold Flow PRO — Fixed RGB ColorsSCRIPT FOR GOLD. I used SMC + CRT strategies. I analyze in H4 timeframe and enter in m15 time frame.
MULTI Straddle-SU₹ESH SMulti straddle price for comparision and trade
VWAP add straddle and vwap price difference added
CE,PE,CE VWAP AND PE VWAP ADDED
GREEN AND RED BACK GROUND ADDED FOR EASY REFERENCE

MULTI Straddle-$U₹ESH $Multistraddle for indian markets
straddle value ,vwap values and straddle vwap added
based on background you can take the trade and put stoploss at vwap

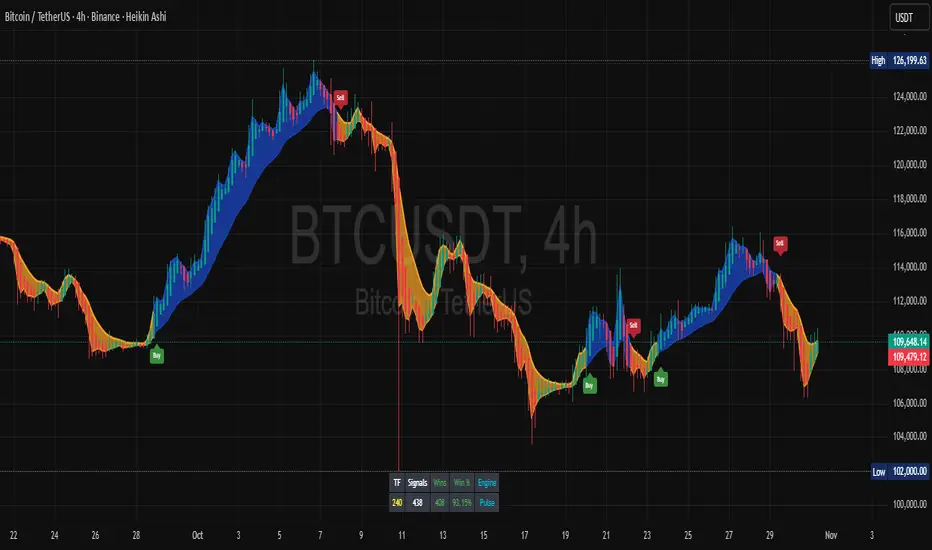
Trendly Signals📈 Trendly Signals - Multi- Mode Signal Engine for Smarter Entries
This is my first attempt at creating an indicator to support newer traders - especially those who don’t have much screen time or charting experience - by offering clearer, easier-to-follow buy/sell signals. Trendly Signals is built on the solid foundation of Trend Indicator A- V2 by DZIV , which provided reliable trend visualization.
Trendly stands for Trend-Friendly - a name chosen to reflect its goal: making trend-based trading more approachable, intuitive, and practical. Built on the solid foundation of Trend Indicator A-V2 by DZIV (credited), Trendly Signals takes the original concept much further, transforming it into a full-featured signal engine designed for real- world trading decisions. It introduces actionable entry/exit signals, dynamic filtering, and user-friendly customization - features that aim to make trading more intuitive and practical for those who want clarity and confidence without spending hours on chart analysis.
🔍 Signal Modes Explained
You can choose between two main signal engines depending on your trading style:
🧠 Pulse Mode
• Uses raw trend flips to generate frequent signals
• Best suited for active traders who want more entries and faster feedback
🧘 Zen Mode
• Applies multiple filters (RSI, MACD slope, candle structure, and higher timeframe trend alignment)
• Designed for those who prefer fewer, higher-conviction trades
✨ One of the most powerful upgrades in Trendly Signals is the ability to view both Pulse and Zen modes together on the same chart.
This lets you compare aggressive vs conservative signals in real time - a feature not available in the original script and rarely found in other free-to-use indicators. It’s especially helpful for learning how different strategies behave under various market conditions.
🧭 Trade Mode (Experimental)
This optional feature spaces out signals based on your preferred trading style:
• Scalping: tighter spacing, more signals
• Swing: moderate spacing
• HODL: wider spacing, fewer signals
It also adjusts cooldown periods and minimum price movement thresholds to help reduce noise and avoid overtrading.
⚠️ Note: Trade Mode currently works only with Zen signals. Pulse signals are focused on raw trend flips and are not filtered through Trade Mode logic.
📊 Built- In Backtest Table
Want to see how it performs? The backtest table displays:
• Total trade count
• Win rate
• Signal engine used (Pulse or Zen)
This helps you quickly evaluate performance across different timeframes and modes - no external tools needed.
🎨 Customization Tips
Make the signals work for you:
1. Choose your mode: Pulse for frequent signals, Zen for filtered entries
2. Set your trading style: Trade Mode adapts signal spacing for scalping, swing, or long- term holding
3. Adjust filters: Use cooldown bars, minimum price movement, and signal repetition settings to fine- tune your entries
4. Pick your visuals: Choose between triangle or label styles, and customize signal colours for better clarity
________________________________________
⚠️ Important Notes
• Chart Type: Standard candles are recommended for the most realistic signal behaviour, but the signals also work fine with other chart types like Heiken Ashi or Renko
• Clean Chart: For best results, apply Trendly Signals on a chart without overlapping indicators
• Credit: Original concept by DZIV (Trend Indicator A- V2) . This version builds on it with new logic, multi- mode signal engines, and adaptive filtering
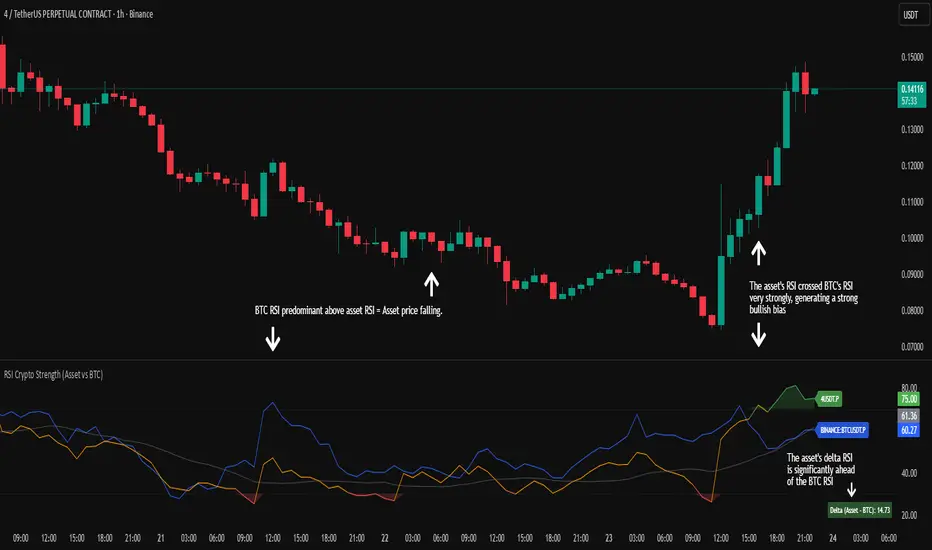
RSI Crypto Strength (Asset vs BTC)The "RSI Crypto Strength" is an advanced analysis tool built on a fundamental pillar of the cryptocurrency market: for an altcoin to achieve exponential bullish performance, it must invariably be and remain stronger than Bitcoin itself.
The primary objective of this indicator is to quantify and reinforce this thesis. It provides a clear and immediate view of the relative strength of any cryptocurrency in direct comparison with the market leader, Bitcoin. This relative strength can be identified on any timeframe. This also reinforces a scenario where a cryptocurrency that is weaker than Bitcoin is prone to sideways movements and downturns.
Key Features
This indicator combines multiple tools into a single solution:
> Dual RSI Plot: Simultaneously visualizes the RSI of the asset on the chart (dynamic) and the RSI of Bitcoin (blue line).
> Strength Delta (Asset vs. BTC): The heart of the indicator. A panel displays the exact difference (Asset RSI - Bitcoin RSI).
- Green: The asset has more RSI strength than Bitcoin.
- Red: The asset has less RSI strength than Bitcoin.
> Dynamic Coloring and Area Fill: The asset's RSI line and the background area automatically change color to highlight critical zones:
- Green (Overbought): RSI above 70.
- Red (Oversold): RSI below 30.
- Orange (Neutral): RSI between 30 and 70.
> Integrated Moving Average: A Moving Average line (gray) is plotted directly on the asset's RSI, serving as a signal line or to smooth momentum. The type (SMA, EMA, WMA, etc.) and period are fully customizable.
> Multi-Timeframe (MTF) Support: You can configure the indicator to display data from a higher timeframe (e.g., "1H") while analyzing a lower timeframe chart (e.g., "5m").
> Customizable Panel and Labels:
- A Delta Panel that can be enabled/disabled and moved to any of the four corners of the indicator.
- Labels at the end of the lines (Asset, BTC, MA) for easy identification, which can also be enabled/disabled.
> Alert-Ready: The indicator exposes the 4 main data sources for creating alerts.
How to Use
> Thesis Validation (Higher Timeframes): This is the primary use. Before looking for entries, use the indicator on timeframes like the H4, Daily, or Weekly. Confirm that the Asset (orange/green line) is consistently above Bitcoin (blue line) and that the Delta is positive. This is your structural strength validation, confirming the asset has potential for an exponential rally.
> Delta Analysis: The "Delta (Asset - BTC)" panel is your immediate strength metric. A positive and rising value indicates the asset is outperforming Bitcoin. A negative and falling value indicates relative weakness.
> Line Crossovers (Timing): On lower timeframes, watch for crossovers between the Asset line and the Bitcoin line. A cross of the Asset line above the Bitcoin line is a clear sign that the asset's momentum is gaining strength.
> Signal Confluence: Look for high-probability scenarios. For example: The Asset's RSI crosses above the Bitcoin RSI while the Delta also crosses above 0.
> Market Extremes: Use the area fill to quickly identify when the asset reaches extreme overbought (>70) or oversold (<30) levels, regardless of what Bitcoin is doing.
Alerts
This indicator is fully prepared for alert creation. When setting up an alert in TradingView, you can select the following data sources from this indicator:
> RSI Asset: Alerts on the RSI value of the asset on the chart.
> RSI Bitcoin: Alerts on the RSI value of Bitcoin.
> Moving Average: Alerts on the value of the Moving Average.
> RSI Delta: Allows creating alerts based on the difference between the two. (e.g., "Alert if RSI Delta crosses above Value 0").
Settings (Inputs)
The indicator offers full customization:
> RSI Length: The calculation period for both RSIs (default 14).
> Indicator Timeframe: Enables Multi-Timeframe functionality.
> Bitcoin Ticker: Allows changing the Bitcoin reference ticker.
> MA Settings: Choose the MA Type (SMA, EMA, WMA, VWMA, etc.) and its period.
> Panels and Labels: Toggles to enable/disable the Delta Panel and Line Labels, plus a selector for the panel's location.
> Colors: All line and highlight colors are fully customizable in the settings.
DISCLAIMER: This script is an analysis tool and does not provide financial advice. All trades carry risk. Use this tool as part of a broader trading strategy and always practice good risk management.
Dynamic Length RSI (DRSI)Dynamic Length RSI (DRSI)
This indicator is an advanced tool that seeks to improve the sensitivity and adaptability of the traditional Relative Strength Index (RSI).
Its main feature is that it uses a variable length calculation instead of a fixed length (like the standard 14), automatically adjusting to market volatility conditions. The length used to calculate the RSI dynamically adjusts between a predefined minimum and maximum, based on volatility (ATR).
The change in length is indicated by the candlestick background. Gray candles represent ascending Dyn (weakness/consolidation/declining volatility), blue or white candles represent descending Dyn (strength, trend, rising volatility).

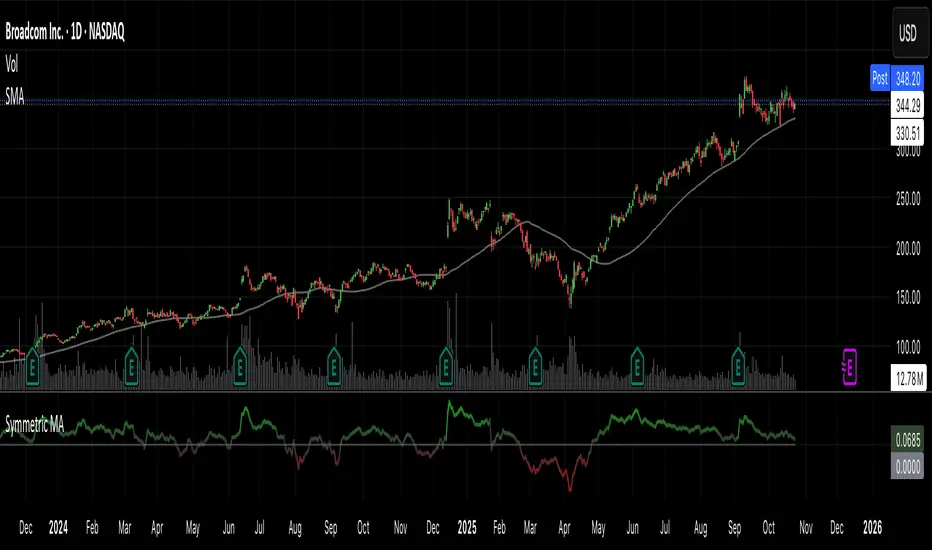
Symmetric MA DeviationThis script used the 50 simple moving average and calculates how far the price is from it.
It can be used for looking at extremes in price and bullish / bearish divergence.
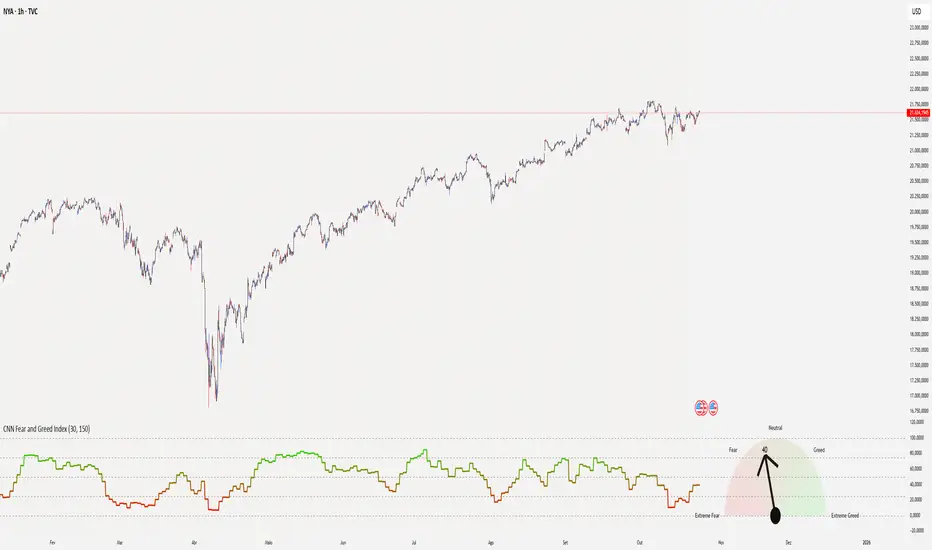
CNN Fear and Greed Index📊 CNN Fear & Greed Index — by @victhoreb
Tap into the emotional heartbeat of the U.S. stock market with this powerful CNN-inspired Fear & Greed Index! 🧠📉📈 Designed to mirror the sentiment framework popularized by CNN Business, this indicator blends 7 key market signals into a single score from 0 (😱 Extreme Fear) to 100 (🚀 Extreme Greed), helping you navigate volatility with confidence.
🧩 What’s Inside?
Each component captures a unique behavioral or macroeconomic force:
- ⚡ Market Momentum: Tracks how far the S&P 500 is from its 125-day average — a pulse check on trend strength.
- 🏛️ Stock Price Strength: Measures the NYSE Highs vs. Lows — are more stocks breaking out or breaking down?
- 🌊 Stock Price Breadth: Uses the McClellan Volume Summation Index to assess market-wide participation.
- ☎️ Put/Call Ratio: A 5-day average of the equity options market — are traders hedging or chasing?
- 🌪️ Volatility (VIX): Compares the VIX to its 50-day average — rising fear or calming nerves?
- 🛡️ Safe Haven Demand: Contrasts stock returns with bond returns — are investors seeking shelter or risk?
- 💣 Junk Bond Demand: Inverted high-yield spread — tighter spreads = more risk-on appetite.
🎯 Why Use It?
This index gives you a quantified view of Wall Street’s mood, helping you:
- Spot emotional extremes that often precede reversals
- Confirm or challenge your directional bias
- Stay grounded when the market gets irrational
🧭 Visual Sentiment Meter
A custom offset sentiment meter shows current positioning with intuitive labels:
- 😱 Extreme Fear
- 😨 Fear
- 😐 Neutral
- 😄 Greed
- 🚀 Extreme Greed
Color gradients and dynamic labels make it easy to interpret at a glance.
Ready to trade with the crowd—or against it? Add this indicator to your chart and let sentiment guide your strategy! 📈🧠
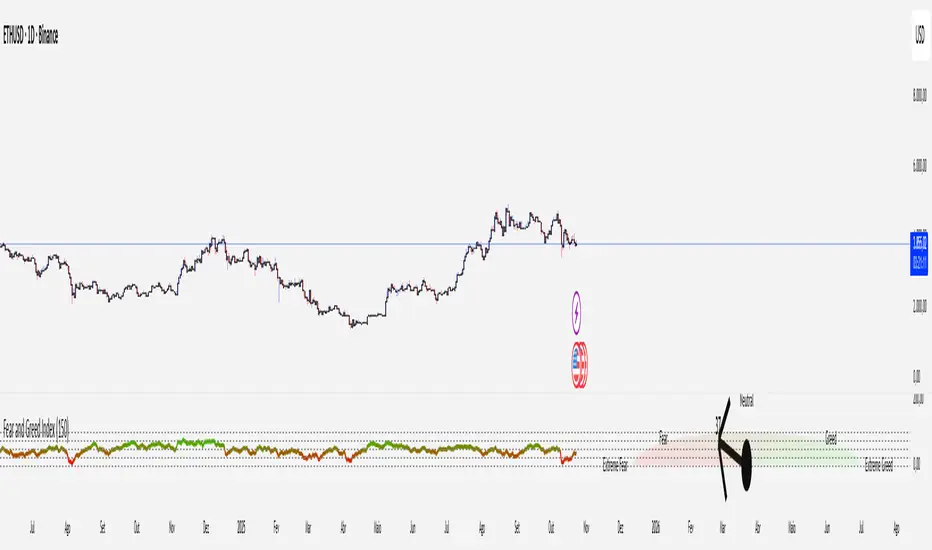
Crypto Fear and Greed Index📊 Crypto Fear & Greed Index — by @victhoreb
Decode the emotional pulse of the crypto market with this all-in-one Fear & Greed Index! 🧠💰 This custom-built indicator blends 7 powerful market signals into a single sentiment score ranging from 0 (😱 Extreme Fear) to 100 (🚀 Extreme Greed), helping you spot potential tops, bottoms, and trend shifts with clarity.
🔍 What’s under the hood?
Each component reflects a unique psychological or macroeconomic force:
- ⚡ Market Momentum: Measures how far BTC is from its 125-day average — are we overextended or undervalued?
- 📈 Crypto Price Strength: Tracks the dominance of altcoins (OTHERS.D) — rising dominance = growing risk appetite.
- 💵 Digital Dollar Dominance (USDT.D): A proxy for stablecoin demand — more USDT dominance = risk-off behavior.
- 🐦 Twitter Sentiment (LunarCrush): Captures real-time posts on TWITTER about Bitcoin — are the crowds euphoric or panicking?
- 🌪️ Volatility (VIX): Inverted VIX deviation — higher fear in traditional markets often spills into crypto.
- 🛡️ Safe Haven Demand: Compares BTC returns vs. US10Y bonds — are investors fleeing to safety or embracing risk?
- 🧨 Junk Bond Demand (BAMLH0A0HYM2): Inverted high-yield spread — tighter spreads = more greed in credit markets.
🎯 Why use it?
This index gives you a quantified view of market sentiment, helping you:
- Anticipate reversals during emotional extremes
- Confirm trend strength or weakness
- Stay objective when the market gets irrational
🧭 Visual Dashboard
A custom offset sentiment meter shows current positioning with intuitive labels:
- 😱 Extreme Fear
- 😨 Fear
- 😐 Neutral
- 😄 Greed
- 🚀 Extreme Greed
Color gradients and dynamic labels make it easy to interpret at a glance.
Ready to trade with the crowd—or against it? Add this indicator to your chart and let sentiment guide your strategy! 📈🧠
Vip Pro Realtime VipPro Realtime — Technical Overview
VipPro Realtime is a multi-layer analytical indicator designed for real-time liquidity and momentum tracking across all markets on TradingView.
It integrates price structure, volatility, and volume dynamics into a unified dashboard that allows traders to visually interpret market phases in seconds.
🔹 Core Components
Directional Framework (Trend Logic)
VipPro Realtime uses a dual-EMA structure to determine short- and mid-term momentum alignment.
When both layers confirm, the background color changes to visualize the prevailing trend:
🟢 Green → bullish momentum
🔴 Red → bearish momentum
⚪ Gray → corrective or neutral phase
Liquidity & Volume Mapping
The script evaluates volume pressure relative to its moving average and applies a dynamic volume-to-volatility ratio.
This helps detect where actual market participation occurs instead of relying only on price movement.
RSI & Volatility Filters
RSI and ATR values are normalized to reduce noise.
The indicator highlights overbought/oversold conditions and provides contextual volatility levels to help avoid false signals in low-liquidity environments.
VWAP Integration
A VWAP baseline defines fair-value zones and helps identify extension points for potential mean reversion setups.
Open Interest Layer (OI Monitor)
When available, the indicator requests aggregated open interest data from related perpetual markets and calculates short-term deltas to visualize:
📈 Increasing OI with rising price → potential long buildup
📉 Increasing OI with falling price → potential short buildup
⚠️ Decreasing OI → profit-taking or liquidation reduction
Wave & Fibonacci Targeting
The tool automatically identifies impulsive and corrective phases and projects short-term expansion levels (1.27 and 1.61) based on recent swings.
Dashboard Interface
The top-center table summarizes all key parameters:
Trend direction
Liquidity state
Momentum strength
Volatility context
RSI condition
Signal status
OI condition
🔹 Use Case
VipPro Realtime is built for traders who need quantitative confirmation of price behavior rather than subjective pattern recognition.
It helps interpret when a movement is supported by real liquidity inflow/outflow, allowing better timing for entries and exits across intraday or swing strategies.
🔹 Compatibility
✅ Works on all TradingView timeframes
✅ Applicable to crypto, forex, stocks, and commodities
✅ Requires no external data feeds or third-party services
🔹 Important Note
This script does not provide financial advice or guaranteed results.
Its purpose is to enhance situational awareness by merging multiple layers of market data (trend, volume, momentum, and OI) into one simplified view.
Traders should always confirm signals with their own risk management and market understanding.
Feel free to ask any questions at amr@mobeline.de .

Ali's TTM+MFRSIthis indicators gives multiple buy and sell signal based on multiframe RSI and TTM squeeze and some other conditions

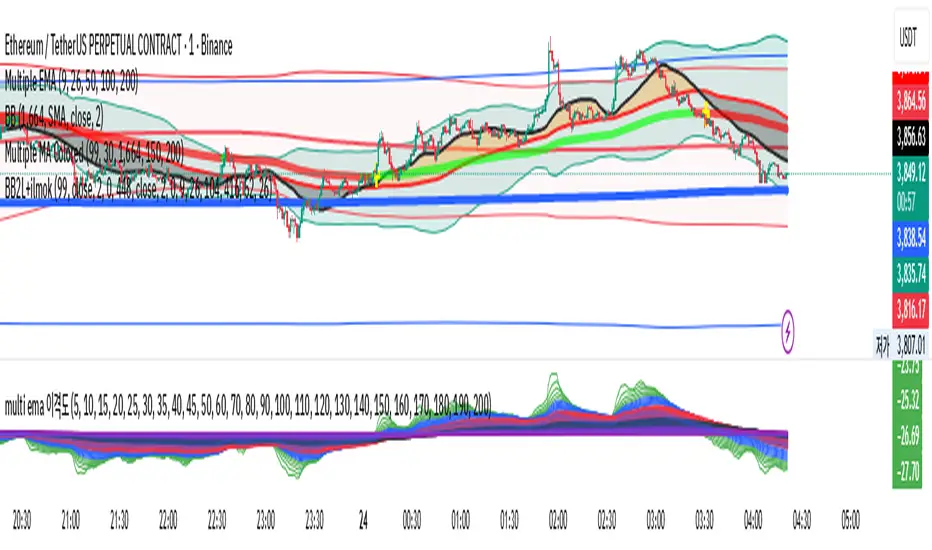
multi ema 이격This script identifies trends by checking the alignment of the current EMA chart using 25 intervals from EMA200.
If the EMA is trending upward from 0, take a long position. If it's trending downward, maintain a short position.
Divergence between the top and bottom is also valid.
If you get a good overall understanding, you will find that it is a very powerful tool.
Blue Dot Red DotInspired by Dr Wish
This script is a confluence indicator designed to identify potential trend reversals or "mean reversion" trade setups. It plots buy (blue) and sell (red) dots directly on your price chart.
The core strategy is to find moments where price is overextended (using Bollinger Bands) and momentum is simultaneously reversing (using the Stochastic Oscillator). A signal is only generated when both of these conditions are met.
Core Components
The script combines two classic technical indicators:
Bollinger Bands (BB):
These create a "channel" around the price based on a simple moving average (the basis) and a standard deviation (dev).
Upper Band: Basis + (2.0 * StdDev)
Lower Band: Basis - (2.0 * StdDev)
In this script, the bands are used to identify when the price has moved significantly far from its recent average, suggesting it's "overbought" (at the upper band) or "oversold" (at the lower band) and may be due for a pullback.
Stochastic Oscillator:
This is a momentum oscillator that compares a closing price to its price range over a certain period.
It consists of two lines: %K (the main, faster line) and %D (a moving average of %K, the slower signal line).
It's used to identify overbought and oversold momentum conditions and, more importantly, momentum shifts, which are signaled by the %K and %D lines crossing.
Signal Logic: How the Dots Are Generated
This script's "secret sauce" is that it demands three specific conditions to be true at the same time before plotting a dot.
🔵 Blue Dot (Buy Signal)
A blue dot will appear below a price bar if all three of these conditions are met:
Stochastic Crossover: The faster %K line crosses above the slower %D line (ta.crossover(k, d)). This signals that short-term momentum is starting to turn bullish.
Was Oversold: On the previous bar, the %K line was below the "Oversold Threshold" (was_oversold = k < oversold). This ensures the bullish crossover is happening from an oversold (or at least bearish) momentum state.
Note: The default oversold threshold is set to 50. This is a key detail. It means the script is looking for a bullish crossover that originates from anywhere in the bottom half of the Stochastic range, not just the traditional "extreme" oversold area (like 20).
Price Extension: Within the last 3 bars (the current bar or the two before it), the price's low must have touched or gone below the lower Bollinger Band (bb_touch_lower). This confirms that the price itself is in an "oversold" or overextended area.
In plain English: A blue dot appears when the price has recently dipped to an extreme low (touching the lower BB) and its underlying momentum has just started to turn back up (Stoch cross from the lower half).
🔴 Red Dot (Sell Signal)
A red dot will appear above a price bar if all three of these conditions are met:
Stochastic Crossunder: The faster %K line crosses below the slower %D line (ta.crossunder(k, d)). This signals that short-term momentum is starting to turn bearish.
Was Overbought: On the previous bar, the %K line was above the "Overbought Threshold" (was_overbought = k > overbought). The default for this is 80, which is a traditional overbought level.
Price Extension: Within the last 3 bars (the current bar or the two before it), the price's high must have touched or gone above the upper Bollinger Band (bb_touch_upper). This confirms that the price itself is in an "overbought" or overextended area.
A red dot appears when the price has recently spiked to an extreme high (touching the upper BB) and its underlying momentum has just started to roll over and turn back down (Stoch cross from the overbought zone).

Hidden Impulse═══════════════════════════════════════════════════════════════════
HIDDEN IMPULSE - Multi-Timeframe Momentum Detection System
═══════════════════════════════════════════════════════════════════
OVERVIEW
Hidden Impulse is an advanced momentum oscillator that combines the Schaff Trend Cycle (STC) and Force Index into a comprehensive multi-timeframe trading system. Unlike standard implementations of these indicators, this script introduces three distinct trading setups with specific entry conditions, multi-timeframe confirmation, and trend filtering.
═══════════════════════════════════════════════════════════════════
ORIGINALITY & KEY FEATURES
This indicator is original in the following ways:
1. DUAL-TIMEFRAME STC ANALYSIS
Standard STC implementations work on a single timeframe. This script
simultaneously analyzes STC on both your trading timeframe and a higher
timeframe, providing trend context and filtering out low-probability signals.
2. FORCE INDEX INTEGRATION
The script combines STC with Force Index (volume-weighted price momentum)
to confirm the strength behind price moves. This combination helps identify
when momentum shifts are backed by genuine buying/selling pressure.
3. THREE DISTINCT TRADING SETUPS
Rather than generic overbought/oversold signals, the indicator provides
three specific, rule-based setups:
- Setup A: Classic trend-following entries with multi-timeframe confirmation
- Setup B: Divergence-based reversal entries (highest probability)
- Setup C: Mean-reversion bounce trades at extreme levels
4. INTELLIGENT FILTERING
All signals are filtered through:
- 50 EMA trend direction (prevents counter-trend trades)
- Higher timeframe STC alignment (ensures macro trend agreement)
- Force Index confirmation (validates volume support)
═══════════════════════════════════════════════════════════════════
HOW IT WORKS - TECHNICAL EXPLANATION
SCHAFF TREND CYCLE (STC) CALCULATION:
The STC is a cyclical oscillator that combines MACD concepts with stochastic
smoothing to create earlier and smoother trend signals.
Step 1: Calculate MACD
- Fast MA = EMA(close, Length1) — default 23
- Slow MA = EMA(close, Length2) — default 50
- MACD Line = Fast MA - Slow MA
Step 2: First Stochastic Smoothing
- Apply stochastic calculation to MACD
- Stoch1 = 100 × (MACD - Lowest(MACD, Smoothing)) / (Highest(MACD, Smoothing) - Lowest(MACD, Smoothing))
- Smooth result with EMA(Stoch1, Smoothing) — default 10
Step 3: Second Stochastic Smoothing
- Apply stochastic calculation again to the smoothed stochastic
- This creates the final STC value between 0-100
The dual stochastic smoothing makes STC more responsive than MACD while
being smoother than traditional stochastics.
FORCE INDEX CALCULATION:
Force Index measures the power behind price movements by incorporating volume:
Force Raw = (Close - Close ) × Volume
Force Index = EMA(Force Raw, Period) — default 13
Interpretation:
- Positive Force Index = Buying pressure (bulls in control)
- Negative Force Index = Selling pressure (bears in control)
- Force Index crossing zero = Momentum shift
- Divergences with price = Weakening momentum (reversal signal)
TREND FILTER:
A 50-period EMA serves as the trend filter:
- Price above EMA50 = Uptrend → Only LONG signals allowed
- Price below EMA50 = Downtrend → Only SHORT signals allowed
This prevents counter-trend trading which accounts for most losing trades.
═══════════════════════════════════════════════════════════════════
THE THREE TRADING SETUPS - DETAILED
SETUP A: CLASSIC MOMENTUM ENTRY
Concept: Enter when STC exits oversold/overbought zones with trend confirmation
LONG CONDITIONS:
1. Higher timeframe STC > 25 (macro trend is up)
2. Primary timeframe STC crosses above 25 (momentum turning up)
3. Force Index crosses above 0 OR already positive (volume confirms)
4. Price above 50 EMA (local trend is up)
SHORT CONDITIONS:
1. Higher timeframe STC < 75 (macro trend is down)
2. Primary timeframe STC crosses below 75 (momentum turning down)
3. Force Index crosses below 0 OR already negative (volume confirms)
4. Price below 50 EMA (local trend is down)
Best for: Trending markets, continuation trades
Win rate: Moderate (60-65%)
Risk/Reward: 1:2 to 1:3
───────────────────────────────────────────────────────────────────
SETUP B: DIVERGENCE REVERSAL (HIGHEST PROBABILITY)
Concept: Identify exhaustion points where price makes new extremes but
momentum (Force Index) fails to confirm
BULLISH DIVERGENCE:
1. Price makes a lower low (LL) over 10 bars
2. Force Index makes a higher low (HL) — refuses to follow price down
3. STC is below 25 (oversold condition)
Trigger: STC starts rising AND Force Index crosses above zero
BEARISH DIVERGENCE:
1. Price makes a higher high (HH) over 10 bars
2. Force Index makes a lower high (LH) — refuses to follow price up
3. STC is above 75 (overbought condition)
Trigger: STC starts falling AND Force Index crosses below zero
Why this works: Divergences signal that the current trend is losing steam.
When volume (Force Index) doesn't confirm new price extremes, a reversal
is likely.
Best for: Reversal trading, range-bound markets
Win rate: High (70-75%)
Risk/Reward: 1:3 to 1:5
───────────────────────────────────────────────────────────────────
SETUP C: QUICK BOUNCE AT EXTREMES
Concept: Catch rapid mean-reversion moves when price touches EMA50 in
extreme STC zones
LONG CONDITIONS:
1. Price touches 50 EMA from above (pullback in uptrend)
2. STC < 15 (extreme oversold)
3. Force Index > 0 (buyers stepping in)
SHORT CONDITIONS:
1. Price touches 50 EMA from below (pullback in downtrend)
2. STC > 85 (extreme overbought)
3. Force Index < 0 (sellers stepping in)
Best for: Scalping, quick mean-reversion trades
Win rate: Moderate (55-60%)
Risk/Reward: 1:1 to 1:2
Note: Use tighter stops and quick profit-taking
═══════════════════════════════════════════════════════════════════
HOW TO USE THE INDICATOR
STEP 1: CONFIGURE TIMEFRAMES
Primary Timeframe (STC - Primary Timeframe):
- Leave empty to use your current chart timeframe
- This is where you'll take trades
Higher Timeframe (STC - Higher Timeframe):
- Default: 30 minutes
- Recommended ratios:
* 5min chart → 30min higher TF
* 15min chart → 1H higher TF
* 1H chart → 4H higher TF
* Daily chart → Weekly higher TF
───────────────────────────────────────────────────────────────────
STEP 2: ADJUST STC PARAMETERS FOR YOUR MARKET
Default (23/50/10) works well for stocks and forex, but adjust for:
CRYPTO (volatile):
- Length 1: 15
- Length 2: 35
- Smoothing: 8
(Faster response for rapid price movements)
STOCKS (standard):
- Length 1: 23
- Length 2: 50
- Smoothing: 10
(Balanced settings)
FOREX MAJORS (slower):
- Length 1: 30
- Length 2: 60
- Smoothing: 12
(Filters out noise in 24/7 markets)
───────────────────────────────────────────────────────────────────
STEP 3: ENABLE YOUR PREFERRED SETUPS
Toggle setups based on your trading style:
Conservative Trader:
✓ Setup B (Divergence) — highest win rate
✗ Setup A (Classic) — only in strong trends
✗ Setup C (Bounce) — too aggressive
Trend Trader:
✓ Setup A (Classic) — primary signals
✓ Setup B (Divergence) — for entries on pullbacks
✗ Setup C (Bounce) — not suitable for trending
Scalper:
✓ Setup C (Bounce) — quick in-and-out
✓ Setup B (Divergence) — high probability scalps
✗ Setup A (Classic) — too slow
───────────────────────────────────────────────────────────────────
STEP 4: READ THE SIGNALS
ON THE CHART:
Labels appear when conditions are met:
Green labels:
- "LONG A" — Setup A long entry
- "LONG B DIV" — Setup B divergence long (best signal)
- "LONG C" — Setup C bounce long
Red labels:
- "SHORT A" — Setup A short entry
- "SHORT B DIV" — Setup B divergence short (best signal)
- "SHORT C" — Setup C bounce short
IN THE INDICATOR PANEL (bottom):
- Blue line = Primary timeframe STC
- Orange dots = Higher timeframe STC (optional)
- Green/Red bars = Force Index histogram
- Dashed lines at 25/75 = Entry/Exit zones
- Background shading = Oversold (green) / Overbought (red)
INFO TABLE (top-right corner):
Shows real-time status:
- STC values for both timeframes
- Force Index direction
- Price position vs EMA
- Current trend direction
- Active signal type
═══════════════════════════════════════════════════════════════════
TRADING STRATEGY & RISK MANAGEMENT
ENTRY RULES:
Priority ranking (best to worst):
1st: Setup B (Divergence) — wait for these
2nd: Setup A (Classic) — in confirmed trends only
3rd: Setup C (Bounce) — scalping only
Confirmation checklist before entry:
☑ Signal label appears on chart
☑ TREND in info table matches signal direction
☑ Higher timeframe STC aligned (check orange dots or table)
☑ Force Index confirming (check histogram color)
───────────────────────────────────────────────────────────────────
STOP LOSS PLACEMENT:
Setup A (Classic):
- LONG: Below recent swing low
- SHORT: Above recent swing high
- Typical: 1-2 ATR distance
Setup B (Divergence):
- LONG: Below the divergence low
- SHORT: Above the divergence high
- Typical: 0.5-1.5 ATR distance
Setup C (Bounce):
- LONG: 5-10 pips below EMA50
- SHORT: 5-10 pips above EMA50
- Typical: 0.3-0.8 ATR distance
───────────────────────────────────────────────────────────────────
TAKE PROFIT TARGETS:
Conservative approach:
- Exit when STC reaches opposite level
- LONG: Exit when STC > 75
- SHORT: Exit when STC < 25
Aggressive approach:
- Hold until opposite signal appears
- Trail stop as STC moves in your favor
Partial profits:
- Take 50% at 1:2 risk/reward
- Let remaining 50% run to target
───────────────────────────────────────────────────────────────────
WHAT TO AVOID:
❌ Trading Setup A in sideways/choppy markets
→ Wait for clear trend or use Setup B only
❌ Ignoring higher timeframe STC
→ Always check orange dots align with your direction
❌ Taking signals against the major trend
→ If weekly trend is down, be cautious with longs
❌ Overtrading Setup C
→ Maximum 2-3 bounce trades per session
❌ Trading during low volume periods
→ Force Index becomes unreliable
═══════════════════════════════════════════════════════════════════
ALERTS CONFIGURATION
The indicator includes 8 alert types:
Individual setup alerts:
- "Setup A - LONG" / "Setup A - SHORT"
- "Setup B - DIV LONG" / "Setup B - DIV SHORT" ⭐ recommended
- "Setup C - BOUNCE LONG" / "Setup C - BOUNCE SHORT"
Combined alerts:
- "ANY LONG" — fires on any long signal
- "ANY SHORT" — fires on any short signal
Recommended alert setup:
- Create "Setup B - DIV LONG" and "Setup B - DIV SHORT" alerts
- These are the highest probability signals
- Set "Once Per Bar Close" to avoid false alerts
═══════════════════════════════════════════════════════════════════
VISUALIZATION SETTINGS
Show Labels on Chart:
Toggle on/off the signal labels (green/red)
Disable for cleaner chart once you're familiar with the indicator
Show Higher TF STC:
Toggle the orange dots showing higher timeframe STC
Useful for visual confirmation of multi-timeframe alignment
Info Panel:
Cannot be disabled — always shows current status
Positioned top-right to avoid chart interference
═══════════════════════════════════════════════════════════════════
EXAMPLE TRADE WALKTHROUGH
SETUP B DIVERGENCE LONG EXAMPLE:
1. Market Context:
- Price in downtrend, below 50 EMA
- Multiple lower lows forming
- STC below 25 (oversold)
2. Divergence Formation:
- Price makes new low at $45.20
- Force Index refuses to make new low (higher low forms)
- This indicates selling pressure weakening
3. Signal Trigger:
- STC starts turning up
- Force Index crosses above zero
- Label appears: "LONG B DIV"
4. Trade Execution:
- Entry: $45.50 (current price at signal)
- Stop Loss: $44.80 (below divergence low)
- Target 1: $47.90 (STC reaches 75) — risk/reward 1:3.4
- Target 2: Opposite signal or trail stop
5. Trade Management:
- Price rallies to $47.20
- STC reaches 68 (approaching target zone)
- Take 50% profit, move stop to breakeven
- Exit remaining at $48.10 when STC crosses 75
Result: 3.7R gain
═══════════════════════════════════════════════════════════════════
ADVANCED TIPS
1. MULTI-TIMEFRAME CONFLUENCE
For highest probability trades, wait for:
- Primary TF signal
- Higher TF STC aligned (>25 for longs, <75 for shorts)
- Even higher TF trend in same direction (manual check)
2. VOLUME CONFIRMATION
Watch the Force Index histogram:
- Increasing bar size = Strengthening momentum
- Decreasing bar size = Weakening momentum
- Use this to gauge signal strength
3. AVOID THESE MARKET CONDITIONS
- Major news events (Force Index becomes erratic)
- Market open first 30 minutes (volatility spikes)
- Low liquidity instruments (Force Index unreliable)
- Extreme trending days (wait for pullbacks)
4. COMBINE WITH SUPPORT/RESISTANCE
Best signals occur near:
- Key horizontal levels
- Fibonacci retracements
- Previous day's high/low
- Psychological round numbers
5. SESSION AWARENESS
- Asia session: Use lower timeframes, Setup C works well
- London session: Setup A and B both effective
- New York session: All setups work, highest volume
═══════════════════════════════════════════════════════════════════
INDICATOR WINDOWS LAYOUT
MAIN CHART:
- Price action
- 50 EMA (green/red)
- Signal labels
- Info panel
INDICATOR WINDOW:
- STC oscillator (blue line, 0-100 scale)
- Higher TF STC (orange dots, optional)
- Force Index histogram (green/red bars)
- Reference levels (25, 50, 75)
- Background zones (green oversold, red overbought)
═══════════════════════════════════════════════════════════════════
PERFORMANCE OPTIMIZATION
For best results:
Backtesting:
- Test on your specific instrument and timeframe
- Adjust STC parameters if win rate < 55%
- Record which setup works best for your market
Position Sizing:
- Risk 1-2% per trade
- Setup B can use 2% risk (higher win rate)
- Setup C should use 1% risk (lower win rate)
Trade Frequency:
- Setup B: 2-5 signals per week (be patient)
- Setup A: 5-10 signals per week
- Setup C: 10+ signals per week (scalping)
═══════════════════════════════════════════════════════════════════
CREDITS & REFERENCES
This indicator builds upon established technical analysis concepts:
Schaff Trend Cycle:
- Developed by Doug Schaff (1996)
- Original concept published in Technical Analysis of Stocks & Commodities
- Implementation based on standard STC formula
Force Index:
- Developed by Dr. Alexander Elder
- Described in "Trading for a Living" (1993)
- Classic volume-momentum indicator
The multi-timeframe integration, three-setup system, and specific
entry conditions are original contributions of this indicator.
═══════════════════════════════════════════════════════════════════
DISCLAIMER
This indicator is a technical analysis tool and does not guarantee profits.
Past performance is not indicative of future results. Always:
- Use proper risk management
- Test on demo account first
- Combine with fundamental analysis
- Never risk more than you can afford to lose
═══════════════════════════════════════════════════════════════════
SUPPORT & QUESTIONS
If you find this indicator helpful, please:
- Leave a like and comment
- Share your feedback and results
- Report any bugs or issues
For questions about usage or optimization for specific markets,
feel free to comment below.
═════════════════════════════════════════════════════════════

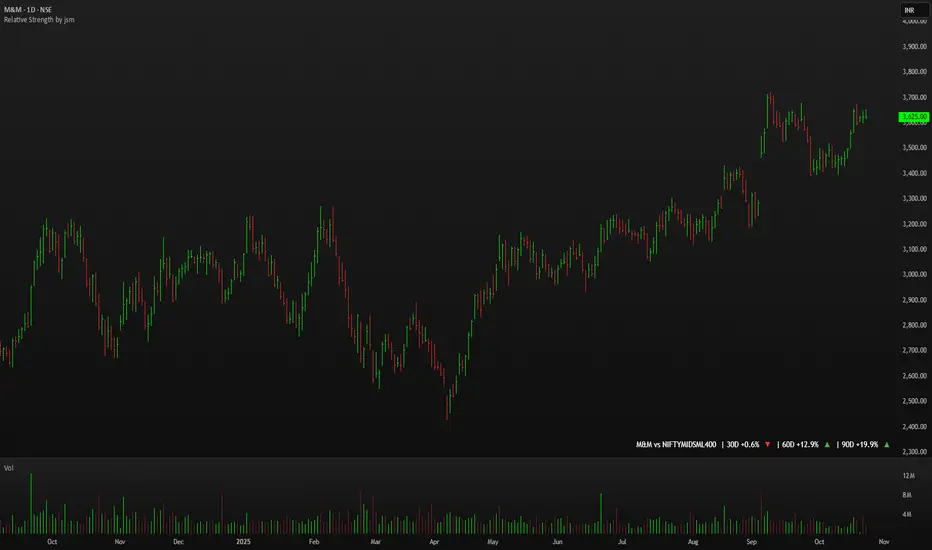
Relative Strength by jsm
1) Compare any stock against an Indian sector/index quickly and clearly.
2) Quickly gauge if your stock is outperforming or lagging its sector.
3) Instant relative strength tracker for Indian stocks & indices.
4) See 30D / 60D / 90D returns vs NIFTY, BANKNIFTY & more.
5) Smart visual tool to spot sector outperformance at a glance.
What it shows
A compact one-line readout (top-right by default):
TICKER vs INDEX | 30D +x.x% ▲ | 60D +y.y% ▼ | 90D +z.z% ▲
- +x.x% → stock return over the past 30 trading days (always uses daily bars).
- Arrow indicates relative performance vs the selected index: green ▲ = stock outperformed, red ▼ = stock underperformed, - = neutral (within tolerance).
- Percent values are shown with one decimal and a leading + for positives (e.g. +3.4%, -1.2%).
How it works
Apply the indicator to the stock chart (bottom chart in a dual-chart layout).
Choose the sector/index to compare from the “Compare with any Indian Index / Sector” dropdown. The indicator immediately calculates:
- Stock % change over 30 / 60 / 90 daily bars
- Index % change over the same periods
- Displays an arrow that reflects stock% − index% (colored only on the arrow to keep the numbers readable).
Inputs
- Pick Sector : preset list of Indian indices/sectors (no free-text by default).
- Box placement : Top/Bottom × Left/Right.
- Box Size : Tiny / Small / Normal / Large / Huge (controls font size).
- Dark Mode : toggles text color for dark/light charts.
- Show 30D / Show 60D / Show 90D : enable/disable individual periods.
- Equality tolerance (%) : small tolerance window to treat values as “equal” (shows neutral symbol).
Behavior & design choices
- Uses daily series for lookbacks (so 30D/60D/90D = 30/60/90 trading days) — works correctly on intraday charts too.
- Arrow only is colored (green/red/gray) for quick visual scanning; numbers remain neutral for readability.
- No intrusive background box by default — flat overlay that blends with your chart.
- Defaults: Bottom-right placement, Normal size, Light mode = off (so dark charts show white text).
Limitations / notes
- Not financial advice — use as a quick comparative visual, not a trade signal.
- The indicator calculates using the preset index symbols; if your broker/data feed lacks a symbol, the cell shows n/a.
- Due to TradingView table rendering, a tiny pixel gap may appear between a percent and its colored arrow (kept minimal on purpose).
Example
On SMSPHARMA chart with NSE:NIFTY selected:
SMSPHARMA vs NIFTY | 30D +13.0% ▲ | 60D +18.5% ▲ | 90D +13.5% ▲
— stock has outperformed NIFTY in all periods.
Smart MACD Volume Trader# Smart MACD Volume Trader
## Overview
Smart MACD Volume Trader is an enhanced momentum indicator that combines the classic MACD (Moving Average Convergence Divergence) oscillator with an intelligent high-volume filter. This combination significantly reduces false signals by ensuring that trading signals are only generated when price momentum is confirmed by substantial volume activity.
The indicator supports over 24 different instruments including major and exotic forex pairs, precious metals (gold and silver), energy commodities (crude oil, natural gas), and industrial metals (copper). For forex and commodity traders, the indicator automatically maps to CME and COMEX futures contracts to provide accurate institutional-grade volume data.
## Originality and Core Concept
Traditional MACD indicators generate signals based solely on price momentum, which can result in numerous false signals during low-activity periods or ranging markets. This indicator addresses this critical weakness by introducing a volume confirmation layer with automatic institutional volume integration.
**What makes this approach original:**
- Signals are triggered only when MACD crossovers coincide with elevated volume activity
- Implements a lookback mechanism to detect volume spikes within recent bars
- Automatically detects and maps 24+ forex pairs and commodities to their corresponding CME and COMEX futures contracts
- Provides real institutional volume data for forex pairs where spot volume is unreliable
- Combines two independent market dimensions (price momentum and volume) into a single, actionable signal
- Includes intelligent asset detection that works across multiple exchanges and ticker formats
**The underlying principle:** Volume validates price movement. When institutional money enters the market, it creates volume signatures. By requiring high volume confirmation and using actual institutional volume data from futures markets, this indicator filters out weak price movements and focuses on trades backed by genuine market participation. The automatic futures mapping ensures that forex and commodity traders always have access to the most accurate volume data available, without manual configuration.
## How It Works
### MACD Component
The indicator calculates MACD using standard methodology:
1. **Fast EMA (default: 12 periods)** - Tracks short-term price momentum
2. **Slow EMA (default: 26 periods)** - Tracks longer-term price momentum
3. **MACD Line** - Difference between Fast EMA and Slow EMA
4. **Signal Line (default: 9-period SMA)** - Smoothed average of MACD line
**Crossover signals:**
- **Bullish:** MACD line crosses above Signal line (momentum turning positive)
- **Bearish:** MACD line crosses below Signal line (momentum turning negative)
### Volume Filter Component
The volume filter adds an essential confirmation layer:
1. **Volume Moving Average** - Calculates exponential MA of volume (default: 20 periods)
2. **High Volume Threshold** - Multiplies MA by ratio (default: 2.0x or 200%)
3. **Volume Detection** - Identifies bars where current volume exceeds threshold
4. **Lookback Period** - Checks if high volume occurred in recent bars (default: 5 bars)
**Signal logic:**
- Buy/Sell signals only trigger when BOTH conditions are met:
- MACD crossover/crossunder occurs
- High volume detected within lookback period
### Automatic CME Futures Integration
For forex traders, spot FX volume data can be unreliable or non-existent. This indicator solves this problem by automatically detecting forex pairs and mapping them to corresponding CME futures contracts with real institutional volume data.
**Supported Major Forex Pairs (7):**
- EURUSD → CME:6E1! (Euro FX Futures)
- GBPUSD → CME:6B1! (British Pound Futures)
- AUDUSD → CME:6A1! (Australian Dollar Futures)
- USDJPY → CME:6J1! (Japanese Yen Futures)
- USDCAD → CME:6C1! (Canadian Dollar Futures)
- USDCHF → CME:6S1! (Swiss Franc Futures)
- NZDUSD → CME:6N1! (New Zealand Dollar Futures)
**Supported Exotic Forex Pairs (4):**
- USDMXN → CME:6M1! (Mexican Peso Futures)
- USDRUB → CME:6R1! (Russian Ruble Futures)
- USDBRL → CME:6L1! (Brazilian Real Futures)
- USDZAR → CME:6Z1! (South African Rand Futures)
**Supported Cross Pairs (6):**
- EURJPY → CME:6E1! (Uses Euro Futures)
- GBPJPY → CME:6B1! (Uses British Pound Futures)
- EURGBP → CME:6E1! (Uses Euro Futures)
- AUDJPY → CME:6A1! (Uses Australian Dollar Futures)
- EURAUD → CME:6E1! (Uses Euro Futures)
- GBPAUD → CME:6B1! (Uses British Pound Futures)
**Supported Precious Metals (2):**
- Gold (XAUUSD, GOLD) → COMEX:GC1! (Gold Futures)
- Silver (XAGUSD, SILVER) → COMEX:SI1! (Silver Futures)
**Supported Energy Commodities (3):**
- WTI Crude Oil (USOIL, WTIUSD) → NYMEX:CL1! (Crude Oil Futures)
- Brent Oil (UKOIL) → NYMEX:BZ1! (Brent Crude Futures)
- Natural Gas (NATGAS) → NYMEX:NG1! (Natural Gas Futures)
**Supported Industrial Metals (1):**
- Copper (COPPER) → COMEX:HG1! (Copper Futures)
**How the automatic detection works:**
The indicator intelligently identifies the asset type by analyzing:
1. Exchange name (FX, OANDA, TVC, COMEX, NYMEX, etc.)
2. Currency pair pattern (6-letter codes like EURUSD, GBPUSD)
3. Commodity identifiers (XAU for gold, XAG for silver, OIL for crude)
When a supported instrument is detected, the indicator automatically switches to the corresponding futures contract for volume analysis. For stocks, cryptocurrencies, and other assets, the indicator uses the native volume data from the current chart.
**Visual feedback:**
An information table appears in the top-right corner of the MACD pane showing:
- Current chart symbol
- Exchange name
- Currency pair or asset name
- Volume source being used (highlighted in orange for futures, yellow for native volume)
- Current high volume status
This provides complete transparency about which data source the indicator is using for its volume analysis.
## How to Use
### Basic Setup
1. Add the indicator to your chart
2. The indicator displays in a separate pane (MACD) and overlay (signals/volume bars)
3. Default settings work well for most assets, but can be customized
### Signal Interpretation
### Visual Signals
**Visual Signals:**
- **Green "BUY" label** - Bullish MACD crossover confirmed by high volume
- **Red "SELL" label** - Bearish MACD crossunder confirmed by high volume
- **Green/Red candles** - Highlight bars with volume exceeding the threshold
- **Light green/red background** - Emphasizes signal bars on the chart
**Information Table:**
A detailed information table appears in the top-right corner of the MACD pane, providing real-time transparency about the indicator's operation:
- **Chart:** Current symbol being analyzed
- **Exchange:** The exchange or data feed being used
- **Pair:** The currency pair or asset name extracted from the ticker
- **Volume From:** The actual symbol used for volume analysis
- Orange color indicates CME or COMEX futures are being used (automatic institutional volume)
- Yellow color indicates native volume from the chart symbol is being used
- Hover tooltip shows whether automatic futures mapping is active
- **High Volume:** Current status showing YES (green) when volume exceeds threshold, NO (gray) otherwise
This table ensures complete transparency and allows you to verify that the correct volume source is being used for your analysis.
**Volume Analysis:**
- Gray histogram bars = Normal volume
- Red histogram bars = High volume (exceeds threshold)
- Green line = Volume moving average baseline
**MACD Analysis:**
- Blue line = MACD line (momentum indicator)
- Orange line = Signal line (trend confirmation)
- Gray dotted line = Zero line (bullish above, bearish below)
### Parameter Customization
**MACD Parameters:**
- Adjust Fast/Slow EMA lengths for different sensitivities
- Shorter periods = More signals, faster response
- Longer periods = Fewer signals, less noise
**Volume Parameters:**
- **Volume MA Period:** Higher values smooth volume analysis
- **High Volume Ratio:** Lower values (1.5x) = More signals; Higher values (3.0x) = Fewer, stronger signals
- **Volume Lookback Bars:** Controls how recent the volume spike must be
**Direction Filters:**
- **Only Buy Signals:** Enables long-only strategy mode
- **Only Sell Signals:** Enables short-only strategy mode
### Alert Configuration
The indicator includes three alert types:
1. **Buy Signal Alert** - Triggers when bullish signal appears
2. **Sell Signal Alert** - Triggers when bearish signal appears
3. **High Volume Alert** - Triggers when volume exceeds threshold
To set up alerts:
1. Click the indicator name → "Add alert on Smart MACD Volume Trader"
2. Select desired alert condition
3. Configure notification method (popup, email, webhook, etc.)
## Trading Strategy Guidelines
### Best Practices
**Recommended markets:**
- Liquid stocks (large-cap, high daily volume)
- Major forex pairs (EURUSD, GBPUSD, USDJPY, AUDUSD, USDCAD, USDCHF, NZDUSD)
- Exotic forex pairs (USDMXN, USDRUB, USDBRL, USDZAR)
- Cross pairs (EURJPY, GBPJPY, EURGBP, AUDJPY, EURAUD, GBPAUD)
- Precious metals (Gold, Silver with automatic COMEX futures mapping)
- Energy commodities (Crude Oil, Natural Gas with automatic NYMEX futures mapping)
- Industrial metals (Copper with automatic COMEX futures mapping)
- Major cryptocurrency pairs
- Index futures and ETFs
**Timeframe recommendations:**
- **Day trading:** 5-minute to 15-minute charts
- **Swing trading:** 1-hour to 4-hour charts
- **Position trading:** Daily charts
**Risk management:**
- Use signals as entry confirmation, not standalone strategy
- Combine with support/resistance levels
- Consider overall market trend direction
- Always use stop-loss orders
### Strategy Examples
**Trend Following Strategy:**
1. Identify overall trend using higher timeframe (e.g., daily chart)
2. Trade only in trend direction
3. Use "Only Buy" filter in uptrends, "Only Sell" in downtrends
4. Enter on signal, exit on opposite signal or at resistance/support
**Volume Breakout Strategy:**
1. Wait for consolidation period (low volume, tight MACD range)
2. Enter when signal appears with high volume (confirms breakout)
3. Target previous swing highs/lows
4. Stop loss below/above recent consolidation
**Forex Scalping Strategy (with automatic CME futures):**
1. The indicator automatically detects forex pairs and uses CME futures volume
2. Trade during active sessions only (use session filter)
3. Focus on quick profits (10-20 pips)
4. Exit at opposite signal or profit target
**Commodities Trading Strategy (Gold, Silver, Oil):**
1. The indicator automatically maps to COMEX and NYMEX futures contracts
2. Trade during high-liquidity sessions (overlap of major markets)
3. Use the high volume confirmation to identify institutional entry points
4. Combine with key support and resistance levels for entries
5. Monitor the information table to confirm futures volume is being used (orange color)
6. Exit on opposite MACD signal or at predefined profit targets
## Why This Combination Works
### The Volume Advantage
Studies consistently show that price movements accompanied by high volume are more likely to continue, while low-volume movements often reverse. This indicator leverages this principle by requiring volume confirmation.
**Key benefits:**
1. **Reduced False Signals:** Eliminates MACD whipsaws during low-volume consolidation
2. **Confirmation Bias:** Two independent indicators (price momentum + volume) agreeing
3. **Institutional Alignment:** High volume often indicates institutional participation
4. **Trend Validation:** Volume confirms that price momentum has "conviction"
### Statistical Edge
By combining two uncorrelated signals (MACD crossovers and volume spikes), the indicator creates a higher-probability setup than either signal alone. The lookback mechanism ensures signals aren't missed if volume spike slightly precedes the MACD cross.
## Supported Exchanges and Automatic Detection
The indicator includes intelligent asset detection that works across multiple exchanges and ticker formats:
**Forex Exchanges (Automatic CME Mapping):**
- FX (TradingView forex feed)
- OANDA
- FXCM
- SAXO
- FOREXCOM
- PEPPERSTONE
- EASYMARKETS
- FX_IDC
**Commodity Exchanges (Automatic COMEX/NYMEX Mapping):**
- TVC (TradingView commodity feed)
- COMEX (directly)
- NYMEX (directly)
- ICEUS
**Other Asset Classes (Native Volume):**
- Stock exchanges (NASDAQ, NYSE, AMEX, etc.)
- Cryptocurrency exchanges (BINANCE, COINBASE, KRAKEN, etc.)
- Index providers (SP, DJ, etc.)
The detection algorithm analyzes three factors:
1. Exchange prefix in the ticker symbol
2. Pattern matching for currency pairs (6-letter codes)
3. Commodity identifiers in the symbol name
This ensures accurate automatic detection regardless of which data feed or exchange you use for charting. The information table in the top-right corner always displays which volume source is being used, providing complete transparency.
## Technical Details
**Calculations:**
- MACD Fast MA: EMA(close, fastLength)
- MACD Slow MA: EMA(close, slowLength)
- MACD Line: Fast MA - Slow MA
- Signal Line: SMA(MACD Line, signalLength)
- Volume MA: Exponential MA of volume
- High Volume: Current volume >= Volume MA × Ratio
**Signal logic:**
```
Buy Signal = (MACD crosses above Signal) AND (High volume in last N bars)
Sell Signal = (MACD crosses below Signal) AND (High volume in last N bars)
```
## Parameters Reference
| Parameter | Default | Description |
|-----------|---------|-------------|
| Volume Symbol | Blank | Manual override for volume source (leave blank for automatic detection) |
| Use CME Futures | False | Legacy option (automatic detection is now built-in) |
| Alert Session | 1530-2200 | Active session time range for alerts |
| Timezone | UTC+1 | Timezone for alert sessions |
| Volume MA Period | 20 | Number of periods for volume moving average |
| High Volume Ratio | 2.0 | Volume threshold multiplier (2.0 = 200% of average) |
| Volume Lookback | 5 | Number of bars to check for high volume confirmation |
| MACD Fast Length | 12 | Fast EMA period for MACD calculation |
| MACD Slow Length | 26 | Slow EMA period for MACD calculation |
| MACD Signal Length | 9 | Signal line SMA period |
| Only Buy | False | Filter to show only bullish signals |
| Only Sell | False | Filter to show only bearish signals |
| Show Signals | True | Display buy and sell labels on chart |
## Optimization Tips
**For volatile markets (crypto, small caps):**
- Increase High Volume Ratio to 2.5-3.0
- Reduce Volume Lookback to 3-4 bars
- Consider faster MACD settings (8, 17, 9)
**For stable markets (large-cap stocks, bonds):**
- Decrease High Volume Ratio to 1.5-1.8
- Increase Volume MA Period to 30-50
- Use standard MACD settings
**For forex (with automatic CME futures):**
- The indicator automatically uses CME futures when forex pairs are detected
- Set appropriate trading session based on your timezone
- Use Volume Lookback of 5-7 bars
- Consider session-based alerts only
- Monitor the information table to verify correct futures mapping
**For commodities (Gold, Silver, Oil, Copper):**
- The indicator automatically maps to COMEX and NYMEX futures
- Increase High Volume Ratio to 2.0-2.5 for metals
- Use slightly higher Volume MA Period (25-30) for smoother analysis
- Trade during active market hours for best volume data
- The information table will show the futures contract being used (orange highlight)
## Limitations and Considerations
**What this indicator does NOT do:**
- Does not predict future price direction
- Does not guarantee profitable trades
- Does not replace proper risk management
- Does not work well in extremely low-volume conditions
**Market conditions to avoid:**
- Pre-market and after-hours sessions (low volume)
- Major news events (volatile, unpredictable volume)
- Holidays and low-liquidity periods
- Extremely low float stocks
## Conclusion
Smart MACD Volume Trader represents a significant evolution of the traditional MACD indicator by combining volume confirmation with automatic institutional volume integration. This dual-confirmation approach significantly improves signal quality by filtering out low-conviction price movements and ensuring traders work with accurate volume data.
The indicator's automatic detection and mapping system supports over 24 instruments across forex, commodities, and metals markets. By intelligently switching to CME and COMEX futures contracts when appropriate, the indicator provides forex and commodity traders with the same quality of volume data that stock traders naturally have access to.
This indicator is particularly valuable for traders who want to:
- Align their entries with institutional money flow
- Avoid getting trapped in false breakouts
- Trade forex pairs with reliable volume data
- Access accurate volume information for gold, silver, and energy commodities
- Combine momentum and volume analysis in a single, streamlined tool
Whether you are day trading stocks, swing trading forex pairs, or positioning in commodities markets, this indicator provides a robust framework for identifying high-probability momentum trades backed by genuine institutional participation. The automatic futures mapping works seamlessly across all supported instruments, requiring no manual configuration or expertise in futures markets.
---
## Support and Updates
This indicator is actively maintained and updated based on user feedback and market conditions. For questions about implementation or custom modifications, please use the comments section below.
**Disclaimer:** This indicator is for educational and informational purposes only. Past performance does not guarantee future results. Always conduct your own analysis and risk management before trading.
