Trend Pressure Prism [LuxAlgo]The Trend Pressure Prism indicator is a comprehensive trend-analysis tool that synthesizes momentum, market structure, and pullback quality into a single composite oscillator to identify high-conviction trading opportunities.
🔶 USAGE
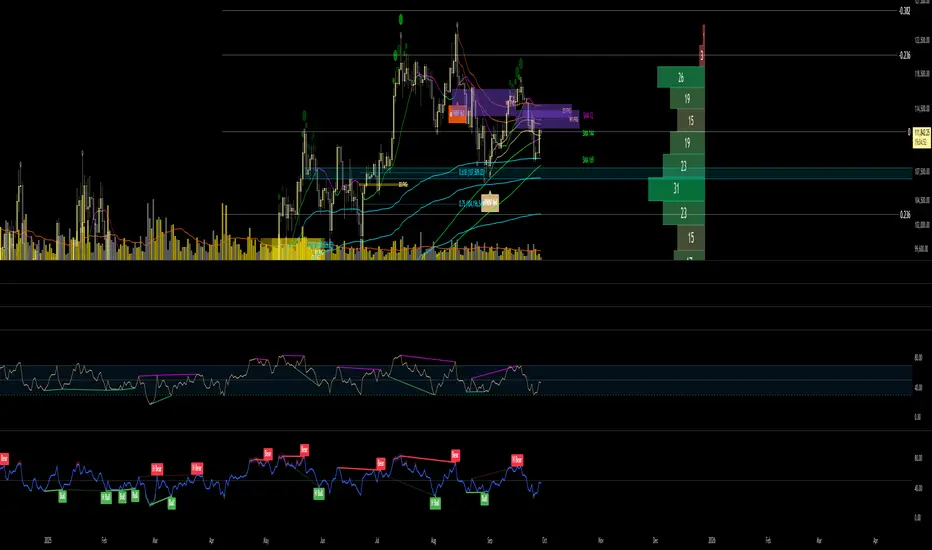
The indicator operates as a "prism," refracting price action through three distinct lenses to determine the total pressure behind a market move. Users can monitor the central ribbon to gauge trend strength and the "Agreement" metric to identify how unified the underlying forces are.
🔹 Trend States & Conviction
The oscillator fluctuates between -100 and 100. When the ribbon enters the "Extreme Zones" (above 80 or below -80), the background glows, signaling a period of high conviction.
Bullish Conviction: High positive pressure with unified agreement among the three pillars.
Bearish Conviction: High negative pressure with unified agreement among the three pillars.
Exhaustion: Occurs when the pressure score remains high but agreement drops below 50%, suggesting a potential reversal or thinning liquidity.
🔹 Filtered Crossover signals
The indicator includes a Signal Line (EMA) that generates entry and exit cues. To ensure only high-quality opportunities are highlighted, signals are filtered by primary conditions:
Relative Volume (RVOL): Ensures the move is backed by institutional participation.
Agreement Filter: Requires a minimum level of harmony between momentum and structure.
Dynamic Sizing: Signals are plotted as circles on the ribbon. Their size and opacity scale based on volume—larger, solid circles represent high-volume breakouts, while smaller circles indicate standard filtered moves.
🔶 DETAILS
The script is built upon three core components that form the Composite Pressure Score:
Momentum Drive: Measures the aggression of price movement using a normalized Rate of Change.
Structural Alignment: Analyzes price position relative to fast and slow EMAs to ensure the trend has structural support.
Pullback Quality: Evaluates the health of retracements by analyzing where price sits within its recent range.
The Agreement metric calculates the mathematical harmony between these three components. High agreement suggests a "perfect storm" where all three factors point in the same direction, increasing the probability of a sustained move.
🔹 Dashboard Information
The on-screen dashboard provides a real-time summary of the market's technical state:
Current State: Identifies the market regime, such as "Bullish/Bearish Conviction," "Exhaustion" (divergent forces), or "Glass / Neutral" (low-conviction environments).
Action: Provides a suggested context based on the prism's logic. This includes "Bullish/Bearish Cross" for potential entries, "Hold" for trending environments with high agreement, and "Wait" for low-conviction periods.
Pressure Score: The numerical value of the composite oscillator (-100 to 100).
Agreement: A percentage representing how unified the three internal forces are. Higher percentages indicate stronger confluence.
🔶 SETTINGS
🔹 Calculation Settings
Lookback Period: Determines the window used for momentum, structure, and range calculations.
Prism Sensitivity: Controls how reactive the normalized scores are to price changes.
Min Signal RVOL: The volume threshold required to trigger a signal circle (e.g., 1.2 requires 20% above average volume).
Min Signal Agreement: The required harmony between the 3 pillars (0.0 to 1.0) for a signal to appear.
🔹 Visual Settings
Prism Opacity: Adjusts the transparency of the central ribbon and conviction glows.
Enable Dashboard: Toggles the on-screen information panel.
Position/Size: Controls the placement and scale of the dashboard UI.
مؤشر Pine Script®