BTC - AXIS: Coppock + Williams %R CompositeTitle: BTC - AXIS: Coppock + Williams %R Composite | RM
Overview & Philosophy
AXIS (Advanced X-Momentum Intensity Score) is a specialized momentum composite designed to identify market structural shifts. In physics, an axis is the central line around which a body rotates; in this indicator, the Zero-Baseline acts as the AXIS for capital flow.
By fusing a slow-moving momentum engine ( Coppock Curve ) with a high-sensitivity tactical oscillator ( Williams %R ), this tool filters out the "market noise" that leads to overtrading and focuses on the high-conviction "Trend-Aligned Dips."
Methodology
Most indicators either suffer from too much lag (Moving Averages) or too much noise (Standard RSI). AXIS solves this through "Speed-Balanced Normalization."
1. Macro Engine (Coppock Curve): Named after Edwin Coppock, this component identifies major market bottoms by smoothing two separate Rates of Change (RoC). It is your structural compass.
2. Tactical Trigger (Williams %R): Created by Larry Williams, this measures the current close relative to the High-Low range.
• Re-centered Logic: Standard Williams %R oscillates between 0 and -100. Here, this is re-centered to oscillate around zero, ensuring it interacts mathematically correctly with the Coppock baseline.
3. The AXIS Score: The Composite line (Orange) is the weighted sum of these two engines. It provides a singular view of the market's "Net Momentum Intensity."
How to Read the Chart
🟧 The AXIS Composite (Orange Line): The primary signal line. It tracks the speed and exhaustion of the price by fusing macro and tactical data.
• Red Zone (> 150): Overheated. Short and long-term momentum are at extreme highs. Risk of a blow-off top or local reversal is high.
• Green Zone (< -150): Capitulation. The market is statistically exhausted. Historically, these zones represent high-conviction accumulation areas.
• Bullish Momentum (> 0): The market is rotating above the central Axis. Buyers are in control of the trend.
• Bearish Momentum (< 0): The market is rotating below the central Axis. Sellers are in control of the trend.
🟦 The Coppock Line (Blue): The macro filter. When Blue is above 0, the long-term trend is up.
🟥 The Williams %R Line (Red): The short-term cycles. Watch for divergences here to spot early trend fatigue.
Strategy: The "AXIS Alignment" Signal
The highest-conviction entry point—and the primary "Alpha" of this tool—occurs when:
The macro trend is Bullish ( Blue Line > 0 ).
The market experiences a correction, pushing the Orange (AXIS) Line into the Green Capitulation Zone.
The AXIS Score turns back upward.
This indicates that a short-term panic has been absorbed by a long-term bull trend—the ideal "Buy the Dip" scenario.
Settings
• Long/Short RoC: Standardized to 14/11 for cycle accuracy.
• Weighting: Allows you to prioritize trend (Coppock) or cycle sensitivity (%R).
• Visibility Toggles: Fully customizable display switches for each line.
Credits
• Edwin Coppock: For the foundation of long-term recovery momentum.
• Larry Williams: For the Percent Range methodology.
⚠️ Note: This indicator is optimized for the Daily (1D) Timeframe. Please switch your chart to 1D for accurate signal reading.
Disclaimer
This script is for research and educational purposes only. Past performance does not guarantee future results.
Tags
bitcoin, btc, axis, momentum, oscillator, coppock, williams r, on-chain, valuation, cycle, Rob Maths
المؤشرات والاستراتيجيات


Bear Momentum Engine (RSI Regime)Title: Bear Momentum Engine (RSI Regime)
Bear Momentum Engine is a professional-grade analytical tool designed specifically for crypto markets during bearish cycles. Unlike traditional RSI indicators that look for "oversold" levels, this engine focuses on momentum structure and regime expansion phases.
The Philosophy
Most traders lose money by buying "oversold" RSI during a crash. This tool is built on Andrew Cardwell’s range shift theory: in a true bear regime, RSI struggles to break above 60, and its real power is found in how it expands away from its moving average.
Key Features:
Bear Regime Detection: Automatically identifies the bearish market phase. The background turns red only when the structural momentum confirms a downside bias.
Momentum Expansion: A proprietary algorithm tracks the "detachment" of RSI from its MA. When the distance increases, it signals a high-probability bearish thrust.
Iron Exit: A disciplined profit-taking system. It triggers an exit signal as soon as the momentum starts to fade, allowing you to lock in gains before the bounce.
No-Trade Zones: Filters out "market noise." The gray background indicates a sideways market where the risk-to-reward ratio is unfavorable.
Best Use Cases:
Strategy: Short-selling, Futures, and Perpetuals.
Goal: Trading with the trend and avoiding "bull traps."
Recommended Timeframes: 1H, 4H, Daily.

Guru Dronacharya Pro Institutional Option Intelligence# Guru Dronacharya Pro – Institutional Option Intelligence
## 🎯 Professional Options Trading Indicator with Dynamic Intensity System
**Guru Dronacharya Pro** is an advanced institutional-grade indicator designed specifically for **NSE Options traders** (NIFTY, BANKNIFTY, FINNIFTY, MIDCPNIFTY). It combines intelligent option chain analysis, volatility detection, and a revolutionary **intensity-based visualization system** to help you identify high-probability option trades.
***
## ✨ KEY FEATURES
### 🔥 **Dynamic Intensity System** (Unique Feature)
- **Adaptive Brightness**: Candles automatically brighten when movement, volume, and volatility surge
- **Multi-Factor Analysis**: Combines Volume Surge + IV Expansion + Price Acceleration
- **Real-Time Intensity Score**: 0-100% intensity meter for both CE and PE
- **Visual Intelligence**: Instantly spot when options are heating up 🔥
### 🎯 **Intelligent Strike Selection**
- **Auto-Select Best Pair**: Scans ±5 strikes from ATM to find optimal CE/PE pairs
- **Compression Analysis**: Identifies strikes with minimal price difference (premium parity)
- **Liquidity Filter**: Ensures selected options have sufficient volume
- **Manual Override**: Take control with manual strike selection when needed
### 📈 **Advanced Signal Generation**
- **Buy Call Signals**: Triggered on CE breakout + volatility expansion + momentum
- **Buy Put Signals**: Triggered on PE breakout + volatility expansion + momentum
- **Multi-Filter Confirmation**: BBW expansion, EMA trend, delta momentum, dominance
- **No Repainting**: All signals confirmed on bar close
### 📊 **Professional Analytics Panel**
- **🔥 Intensity Metrics**: Real-time CE/PE activity levels
- **PCR (Put-Call Ratio)**: Volume-based market sentiment
- **Volume Delta**: CE vs PE volume comparison with trend
- **IV Percentile**: 1-year implied volatility ranking
- **BBW (Bollinger Band Width)**: Volatility expansion detector
- **Momentum Trackers**: Real-time CE/PE momentum analysis
- **Premium Ratio**: CE/PE price relationship analysis
### 🎨 **Customizable Visualization**
- **Dual Candle Display**: Side-by-side CE and PE premium tracking
- **Normalized View**: % change from open (easier comparison)
- **Absolute View**: Raw premium values
- **EMA Overlays**: Trend confirmation lines
- **Theme-Aware**: Auto-detects dark/light mode for optimal visibility
- **Adjustable Tables**: Position and size controls for metrics panel
***
## 💡 WHAT MAKES IT UNIQUE?
### **1. Intensity-Based Coloring** 🔥
Traditional indicators show static colors. **Guru Dronacharya Pro** uses dynamic brightness:
- **Dim Candles** = Low activity (avoid these setups)
- **Medium Brightness** = Building momentum (watch closely)
- **Bright Candles** = High activity (trade opportunities!) 🔥🔥
This helps you:
✅ Focus on liquid, moving options
✅ Avoid low-volume, dead zones
✅ Identify institutional money flow
✅ Time entries during volatility expansion
### **2. Smart Strike Selection**
No more guessing which strike to trade! The indicator:
- Scans multiple strikes simultaneously
- Finds pairs with balanced premiums
- Filters out illiquid options
- Highlights the best trading pair
### **3. Multi-Timeframe Compatible**
Works on any timeframe:
- **1-5 min**: Scalping and day trading
- **15-30 min**: Intraday swing trades
- **1H+**: Positional option strategies
***
## 📖 HOW TO USE
### **Step 1: Configure Your Symbol**
1. Set **Underlying** (NSE:NIFTY, NSE:BANKNIFTY, etc.)
2. Enter **Expiry Date** (Year, Month, Day)
3. Input **ATM Strike** (rounded to nearest strike interval)
4. Choose **Symbol Format** (NSE Standard, NSE Weekly, or Custom)
### **Step 2: Understand the Display**
**Chart Elements:**
- **Green/Lime Candles** = Call Option (CE)
- **Pink/Magenta Candles** = Put Option (PE)
- **Brightness** = Activity intensity (brighter = more action!)
- **Triangle Up** = Buy Call Signal ▲
- **Triangle Down** = Buy Put Signal ▼
**Metrics Panel (Bottom Right):**
- **🔥 CE/PE INT**: Intensity score (higher = better)
- **PCR**: Above 1.0 = Bullish, Below 1.0 = Bearish
- **VOL Δ**: Positive = CE volume dominance
- **IV%ile**: Above 70 = High IV (premium sellers advantage)
- **BBW**: Expansion indicator (⚡ = expanding)
- **Momentum**: Price acceleration tracker
### **Step 3: Trading Rules**
**For Buying Calls (Bullish):**
1. Wait for ▲ signal below CE candle
2. Check **CE INT > 40%** (moderate to high activity)
3. Confirm **CE BBW ⚡** (volatility expanding)
4. Verify **CE Mom** positive (momentum building)
5. **Entry**: Current CE premium
6. **Target**: Use Fibonacci levels or book on intensity drop
**For Buying Puts (Bearish):**
1. Wait for ▼ signal above PE candle
2. Check **PE INT > 40%** (moderate to high activity)
3. Confirm **PE BBW ⚡** (volatility expanding)
4. Verify **PE Mom** positive (momentum building)
5. **Entry**: Current PE premium
6. **Target**: Use Fibonacci levels or book on intensity drop
**Risk Management:**
- Avoid trades when intensity < 30% (low liquidity)
- Higher intensity = tighter stops (volatile moves)
- Watch for intensity divergence (price up, intensity down = weakness)
***
## ⚙️ SETTINGS GUIDE
### **Group 1: UNDERLYING & SYMBOL**
- **Underlying**: Main index/stock ticker
- **Option Root**: Symbol prefix (NIFTY, BANKNIFTY, etc.)
- **Strike Interval**: 50 for NIFTY, 100 for BANKNIFTY
- **Expiry Date**: Target expiry (Year/Month/Day)
- **Spot Source**: Auto (First 5m), Live Close, or Manual
### **Group 2: OPTION CHAIN SCANNER**
- **ATM Strike**: Center point for scanning (manually input)
- **Scan Range**: ±N strikes to scan (1-5)
- **Compression Threshold**: Max CE-PE difference % (8% default)
- **Min Volume**: Liquidity filter (100 default)
- **Auto-Select**: Enable for automatic best pair selection
### **Group 3: SIGNAL FILTERS**
- **BBW Length**: Volatility calculation period (20 default)
- **BBW Expansion Threshold**: Multiplier for expansion (1.30x)
- **Min BBW**: Minimum volatility % (2.0%)
- **EMA Filter**: Enable trend confirmation (21 EMA)
- **Delta Momentum**: Require CE > PE momentum for calls (vice versa)
### **Group 4: SIGNAL DISPLAY**
- **Show Buy Signals**: Toggle call/put signals
- Simple triangle markers (▲ for calls, ▼ for puts)
### **Group 5: VISUALIZATION**
- **Plot Candles**: Show CE/PE candlesticks
- **Normalize to % Change**: Compare premiums as % (recommended)
- **Show EMA**: Display trend lines
- **Show Metrics Panel**: Display analytics table
- **Table Position**: Move metrics panel (9 positions)
- **Table Size**: Adjust text size (Tiny to Huge)
### **Group 6: OPTION ANALYTICS**
- **Show PCR**: Put-Call Ratio display
- **Show Volume Analysis**: Volume delta tracking
- **Show IV Percentile**: 1-year IV ranking
### **Group 7: INTENSITY SYSTEM** 🔥
- **Enable Intensity Coloring**: Turn on dynamic brightness
- **Intensity Smoothing**: Higher = smoother (3 default)
- **Volume Weight**: Impact of volume surges (35%)
- **IV/BBW Weight**: Impact of volatility expansion (40%)
- **Movement Weight**: Impact of price acceleration (25%)
- **Min Brightness**: Dimmest state (70% transparency)
- **Max Brightness**: Brightest state (0% = fully opaque)
***
## 🎓 TRADING STRATEGIES
### **Strategy 1: Intensity Breakout**
- Wait for intensity to rise from <30% to >60%
- Enter on signal with bright candle
- Exit when intensity drops below 40%
### **Strategy 2: Volatility Expansion**
- Monitor BBW indicator
- Enter on ⚡ expansion + signal
- Target quick 20-30% premium gains
### **Strategy 3: PCR Contrarian**
- PCR > 1.3 = Oversold (look for call signals)
- PCR < 0.7 = Overbought (look for put signals)
- Combine with intensity confirmation
### **Strategy 4: Volume Delta Momentum**
- Strong positive VOL Δ = CE buying pressure
- Enter calls on dips with high CE intensity
- Vice versa for puts
***
## 📋 SUPPORTED EXCHANGES & SYMBOLS
**Exchanges:**
- NSE (National Stock Exchange of India)
**Supported Underlyings:**
- NIFTY 50
- BANKNIFTY
- FINNIFTY
- MIDCPNIFTY
- Individual stocks with liquid options
**Option Formats:**
- NSE Standard: `NSE:NIFTY251230C25900`
- NSE Weekly: `NSE:NIFTY25DEC25900CE`
- Custom/Broker-Specific formats
***
## ⚡ PERFORMANCE OPTIMIZATION
This indicator is optimized for speed:
- **Tuple-based security requests** (80% faster than standard)
- **Minimal repainting** (signals confirmed on bar close)
- **Efficient array operations**
- **Smart caching** of repeated calculations
- Works smoothly even on 1-minute charts
***
## 🚨 ALERTS
Built-in alert conditions:
- **Buy Call Signal**: Triggered on confirmed call entry
- **Buy Put Signal**: Triggered on confirmed put entry
**Setup:**
1. Click "Create Alert" on TradingView
2. Select "Guru Dronacharya Pro"
3. Choose "Buy Call Signal" or "Buy Put Signal"
4. Set notification method (popup/email/webhook)
***
## ⚠️ RISK DISCLAIMER
**IMPORTANT**: This indicator is for **educational purposes only**.
- Options trading carries substantial risk of loss
- Past performance does not guarantee future results
- Always use proper risk management (stop losses, position sizing)
- No indicator guarantees profitable trades
- Test thoroughly on paper/sim before live trading
- Consult a financial advisor before trading
**The creator is not responsible for any trading losses incurred using this indicator.**
***
## 🔄 VERSION HISTORY
**v1.0 (Current)**
- Initial release
- Dynamic intensity system
- Intelligent strike selection
- Multi-filter signal generation
- Professional analytics panel
- Theme-aware visualization
- Full customization support
***
## 💬 FEEDBACK & SUPPORT
Found this indicator helpful? Please:
- ⭐ Leave a rating
- 💬 Share your experience in comments
- 📊 Publish your chart ideas using this indicator
- 🔔 Follow for updates and new indicators
**Questions?** Drop a comment, and I'll help you optimize your settings!
***
## 🏆 WHO IS THIS FOR?
✅ **Intraday Option Traders** (scalping & day trading)
✅ **Swing Option Traders** (multi-day positions)
✅ **Premium Buyers** (directional option strategies)
✅ **Technical Analysts** (volatility & momentum-based)
✅ **NSE Options Specialists** (NIFTY/BANKNIFTY focused)
❌ **NOT suitable for:**
- Complete beginners (learn basics first)
- Premium sellers (different indicator needed)
- Set-and-forget strategies (requires active monitoring)
***
## 🙏 ACKNOWLEDGMENTS
Named after **Guru Dronacharya**, the legendary teacher from Mahabharata known for precision, discipline, and strategic mastery – qualities every successful trader needs.
**May your trades be profitable and your risk be managed! 🚀**
***
**Tags:** Options Trading, NSE Options, NIFTY Options, BANKNIFTY Options, Option Chain Analysis, Volatility Trading, Intensity System, Indian Stock Market, Intraday Trading, Premium Analysis, PCR Indicator, Options Signals
***
**Legal:** This indicator does not constitute financial advice. All trading decisions are your responsibility. Always trade with risk capital you can afford to lose.

Reference TimesThe Reference Times indicator highlights historical candles on your chart based on the user's selected criteria. This tool allows traders to reference the current graph's price movements against historical movements at specific times and days, helping to anticipate potential future market direction, swings, and timing.
For even more advaned features check out "Reference Times - Advanced"
good luck and all the best!

Liquidity Sweep pro📌 Liquidity Sweep Pro – Strategy Description
Liquidity Sweep Pro is a price–action based trading strategy designed to identify liquidity grabs and smart money reversals around key swing highs and lows.
This strategy focuses on moments where price takes out resting liquidity above recent highs or below recent lows, then shows clear rejection and directional intent, which often precedes strong reversals or continuations.
🔍 Core Logic
The strategy is built on three main concepts:
1️⃣ Liquidity Sweep Detection
Identifies recent swing highs and swing lows using pivot structure
Detects when price sweeps above a high or below a low, signaling liquidity collection
2️⃣ CISD Confirmation (Change in State of Delivery)
After a liquidity sweep, the strategy waits for:
Bearish confirmation after sweeping highs
Bullish confirmation after sweeping lows
This confirmation is based on candle behavior and price closing back inside the structure, filtering out false breakouts.
3️⃣ Optional Trend Filter (Hull MA)
An optional Hull Moving Average filter can be enabled to trade:
Longs in bullish conditions
Shorts in bearish conditions
This helps reduce counter-trend trades while keeping the strategy flexible.
🎯 Risk Management
Stop Loss and Take Profit are calculated dynamically using ATR
Fully customizable Risk : Reward ratio
Designed to adapt to different market conditions and volatility levels
⚙️ Recommended Usage
Best suited for intraday and scalping trading
Works well on:
XAUUSD (Gold) – M3 / M5
Crypto – M5 / M15
Indices – M5
The strategy does not repaint and only generates signals after candle close.
⚠️ Disclaimer
This strategy is for educational and research purposes only.
Always test and optimize parameters for your specific market and timeframe before using it in live trading.

CVD Divergence Background By HKOverview This indicator visualizes Delta Divergences (also known as Absorption) directly on your main chart. It highlights candles where the price direction contradicts the underlying net volume flow (CVD). This is a powerful method to spot "traps," limit order absorption, and potential reversals.
How it Works The script calculates the Intrabar Volume Delta based on price action relative to the candle's range. It then compares this Delta with the candle's color (Open vs. Close).
Bearish Divergence (Absorption Top):
Scenario: The candle is GREEN (Price closed higher), but the Volume Delta is NEGATIVE (Net Selling).
Visual: Red Background.
Meaning: Sellers are aggressively absorbing the buying pressure via limit orders. Price struggled to rise despite the volume.
Bullish Divergence (Absorption Bottom):
Scenario: The candle is RED (Price closed lower), but the Volume Delta is POSITIVE (Net Buying).
Visual: Green Background.
Meaning: Buyers are aggressively absorbing the selling pressure via limit orders. Price struggled to fall despite the volume.
Features
Background Highlighting: Instantly spot divergences without checking a separate oscillator window.
Seamless Integration: Works perfectly behind your price candles and other indicators (like Big Trade detectors).
Customizable: You can adjust the colors and transparency to fit your chart theme.
Use Case Use this to identify exhausted moves. If you see a green candle with a red background at a resistance level, it suggests that buyers are running into a wall of sellers, increasing the probability of a reversal.

MTF Multi Indicator Table by JAB76TABLE for trading with EMA and ICHIMOKU , HELPS IN ANALYSIS OF TREND

BTC - Metcalfes Law (Deviation)Title: BTC – Metcalfe's Law (Deviation) | RM
Overview & Philosophy
The BTC – Metcalfe's Law (Deviation) is a fundamental valuation oscillator that answers one of the most important questions in network economics: "Is the current price justified by the number of active users?" Metcalfe's Law states that the value of a network is proportional to the square of the number of its connected users (Value = Users squared). In the context of Bitcoin, this means that as the number of active addresses grows linearly, the network's fair value should grow exponentially.This script identifies periods where Bitcoin’s market capitalization has become "overextended" or "undervalued" relative to its actual network activity.
Methodology
The indicator performs a rolling log-log regression (Ordinary Least Squares) between Bitcoin's Market Cap and its Active Address count over a 730-day (2-year) window.
1. The Regression: The script calculates the statistical relationship: ln(Market Cap) = alpha + beta * ln(Active Addresses)
2. Pure Metcalfe vs. Generalized Metcalfe:
• Pure Metcalfe (Beta=2): By default, the script enforces a slope of 2.0, adhering to the classic mathematical law.
• Dynamic Fit: Users can disable the "Enforce Metcalfe" setting to let the model find the best historical fit (often resulting in a Beta between 1.5 and 1.8).
3. The Deviation (The Signal):
The resulting line represents the Log-Deviation from Fair Value.
• A value of 0.0 means Bitcoin is priced exactly according to its network utility.
• Positive values indicate a "valuation premium".
• Negative values indicate a "valuation discount".
How to Read the Chart
🔴 The Red Zone (Overvaluation > 1.0)
Meaning: The Market Cap has outpaced the growth of active users. Historically, these peaks represent speculative bubbles or cycle tops where price is driven by hype rather than utility.
🟢 The Green Zone (Undervaluation < -0.25)
Meaning: The network is being utilized, but the price has crashed below its fundamental support. Historically, these "Utility Floors" have marked the most profitable accumulation zones in Bitcoin’s history.
🟠 The Orange Line (Fair Value Transition)
Meaning: The market is in a healthy growth phase, moving in lockstep with user adoption.
Strategy & Interpretation
This tool is a Macro Compass . It is designed to help investors stay objective during periods of extreme market emotion.
• In a Bull Market: Watch for the deviation to hit the Red Zone. This is your signal that the "Network Utility" can no longer support the price, and a major correction is likely imminent.
• In a Bear Market: Look for the "Green Floor." When the price stays below the -0.25 level despite stable user activity, it suggests a massive mismatch between value and price—a classic buy signal.
Settings
• Regression Window (Default: 730 Days): Chosen to capture mid-to-long term cycle trends. Adjust to shorter timeframes for more dynamic behavior or longer timeframes (like 1460 Days) to catch longer cycles.
• Enforce Metcalfe: Toggle between the classic law (Beta=2) and a dynamic fit.
• Smoothing: A 30-day SMA is applied to active addresses to filter out daily "jitter."
Credits
• Robert Metcalfe: For the original law of network utility.
• Willy Woo & Greg Wheatley: For their pioneering work in applying Metcalfe's Law specifically to Bitcoin's valuation.
Important Data Requirement
To function, this indicator requires a data feed for Active Addresses . By default, it is set to GLASSNODE:BTC_ACTIVEADDRESSES . Please Note: On-chain data usually requires a premium vendor subscription on TradingView (e.g., Glassnode, IntoTheBlock, or CryptoQuant). If you do not have a subscription, the indicator will display a "Missing Data" warning.
⚠️ Note: This indicator is optimized for the Daily (1D) Timeframe. Please switch your chart to 1D for accurate signal reading.
Disclaimer
This script is for research and educational purposes only. It relies on third-party on-chain data. Fundamental valuation is only one piece of the puzzle; market dynamics can remain irrational longer than metrics can predict.
Tags
bitcoin, btc, on-chain, metcalfe, adoption, fundamental, valuation, active addresses, cycle, Rob Maths

CVD & Big Trade Detector By HKOverview The CVD & Big Trade Detector By HK offers a unique perspective on Cumulative Volume Delta (CVD). This indicator utilizes Floating Bars (Candles) to visualize the cumulative buying and selling pressure. This design allows you to clearly see the net delta of each specific candle relative to the cumulative trend.
Additionally, it integrates the "Big Trade" algorithm to highlight statistically significant volume anomalies (Whale activity) directly on the CVD bars.
How it Works Since standard volume data does not always provide buy/sell splitting, this script estimates intrabar pressure using price action logic:
Buying Pressure: Calculated based on the push from the Low to the Close.
Selling Pressure: Calculated based on the push from the High to the Close.
The indicator then calculates the Delta (Buy Vol - Sell Vol) and accumulates it.
Floating Bars: Instead of plotting from the zero-line, each bar opens at the previous CVD value and closes at the new cumulative value.
Teal/Green Bar: Net buying in the current period (CVD increased).
Maroon/Red Bar: Net selling in the current period (CVD decreased).
Key Features
Floating CVD Structure: Prevents the "barcode effect" common in histogram CVDs. It provides a clean, candle-like view of momentum accumulation.
Whale Detection:
The script calculates the moving average and standard deviation (Sigma) of the buying/selling volume.
Green Dots: Appear when buying volume exceeds the statistical threshold (Signifying a "Big Buy").
Red Dots: Appear when selling volume exceeds the statistical threshold (Signifying a "Big Sell").
Precise Positioning: Whale markers are plotted exactly at the closing value of the CVD bar, showing you exactly where the volume spike impacted the delta.
How to Use
Divergences: Look for situations where Price makes a Higher High, but the CVD Bars fail to make a new high (bearish divergence).
Absorption: If you see a Large Whale Dot on a very small CVD bar (doji-like), it indicates massive volume fighting for direction with little net result—often a sign of absorption or a pending reversal.
Trend Confirmation: Strong floating bars in the direction of the trend, accompanied by Whale Dots, confirm smart money participation.
Settings
Lookback Period: Defines the baseline for the statistical volume calculation (default: 50).
Sensitivity (Sigma): Adjusts how strict the "Whale" detection is (default: 3.0). Higher values = fewer, more significant signals.
Colors: Fully customizable colors for Up/Down bars and Buy/Sell markers.
Built with Pine Script™ v6

A+ / A- Radar + BUY/SELL (VWAP & EMA9 & M2/T3)simple script with vwap and m9 and displacement create by m2/t3 code.
best timeframe to use 5m

Best RSI (SIIT) By Nagaraj HiremathBest RSI (SIIT) By Nagaraj Hiremath is based on RSI shows when to By and sell .

Best Algo (SIIT) By Nagaraj HiremathBest Algo (SIIT) By Nagaraj Hiremath is Based on Ema,Pivot,Renko Candle

RS of long term KSTDescription
Relative Strength of KST (Know Sure Thing) momentum between a stock and a reference index (e.g., Intesa San Paolo vs. FTSEMIB).
This indicator computes the KST oscillator separately for the chart symbol and the comparative symbol, then plots the difference (stock KST minus index KST). A positive or rising value indicates the stock has stronger momentum than the benchmark.
Best used on weekly timeframes.
Features:
- Fully configurable KST parameters (ROC lengths, SMA smoothing, weights).
- Signal line (SMA of the RS of KST) for potential crossover signals.
- Zero line for reference.
Rising values or crossings above the signal line may suggest improving relative momentum.
What the Script Does
This indicator calculates the Relative Strength of the KST momentum oscillator between the current chart symbol (e.g., a stock) and a comparative symbol (default: FTSEMIB).
KST Calculation (Know Sure Thing oscillator, originally developed by Martin Pring), computes four Rate-of-Change (ROC) values with different lengths (10, 13, 15, 20 by default). Each ROC is smoothed with its own SMA. The four smoothed ROCs are weighted (weights 1, 2, 3, 4 by default) and summed to create the final KST value.
This is done separately for: The chart symbol → kst
The comparative symbol → kstSymbol
Relative Strength of KST res = kst - kstSymbol
This is a subtraction-based relative strength (difference) of the two KST values, not a ratio, as to avoid singularity (division by zero).
A rising line or value above zero means the stock’s momentum (KST) is stronger than the index’s momentum.
Plotting Plots the RS of KST as a blue line.
Overlays a gray SMA (default length 10) with cross style (acts as a signal line).
Horizontal line at zero for reference.
This is best used on weekly charts (as KST is typically a longer-term momentum indicator).

TCR by AMAGADON TCR - THREE CANDLE RULES
The Methodology
TCR (Three Candle Rules) is a systematic confirmation indicator developed to solve the problem of "False Breakouts." Many traders lose capital by entering as soon as price touches a level; TCR eliminates this by enforcing a Two-Candle Validation rule.
The algorithm identifies a session-based range and requires price to "prove" its strength by holding outside that range for two consecutive candles before a signal is issued.
How the TCR Logic Works:
Zone Identification: The script anchors to the high and low of the session start (Asia, London, or NY).
Validation (The Rule):
For a BUY: Two consecutive M15 candles must both Open and Close entirely above the session high.
For a SELL: Two consecutive M15 candles must both Open and Close entirely below the session low.
The Trigger Box: Once validated, a Blue (Buy) or Red (Sell) box is drawn. The 50% (Midpoint) of the trigger candle becomes the high-probability entry zone.
STRICT FOREX RISK DISCLOSURE
⚠️ HIGH-RISK WARNING: Trading Foreign Exchange (Forex) involves a high level of risk and may not be suitable for all investors. The high degree of leverage can lead to the loss of your entire investment. Only trade with money you can afford to lose.
NO FINANCIAL ADVICE: TCR - THREE CANDLE RULES is a technical analysis tool for educational and informational purposes only. It does not constitute financial or investment advice.
LIMITATION OF LIABILITY:
No Accuracy Guarantees: Mathematical patterns do not guarantee future results.
Execution Risks: The author is not responsible for losses due to market volatility, news spikes, or broker slippage.
User Responsibility: By using this script, you acknowledge that all trading decisions are yours alone. The author is not liable for any financial damages

Relative StrengthDescription
Relative Strength between a stock and a reference index (e.g., Intesa San Paolo vs. FTSEMIB).
This indicator calculates the Relative Strength (RS) as either a simple ratio of the base symbol's close to the comparative symbol's close, or as a normalized ratio over a lookback period. It helps identify the relative performance of a stock against an index, which can signal intermediate trends when the RS is above its moving average.
Key features:
- Input for comparative symbol (default: FTSEMIB).
- Option to toggle between simple ratio or ratio-over-time calculation.
- Adjustable lookback period for the ratio-over-time method.
- Optional display of a moving average on the RS line for trend analysis.
Use it to compare a stock's strength to the market—rising RS may indicate outperformance.
Script Overview
This is a Relative Strength (RS) indicator for TradingView (written in Pine Script version 5).
It compares the price performance of the current chart's symbol (e.g., a stock like Intesa San Paolo) against another symbol you choose (by default, the Italian index FTSEMIB).
The goal is to show whether the stock is outperforming or underperforming the reference index.
User Inputs (configurable in the settings panel)
Comparative Symbol Default: FTSEMIB
You can change it to any other ticker (e.g., SPX, DAX, etc.).
Calculate RS as simple ratio (true) or ratio over time (false)?
true (default): Simple ratio → current close of stock ÷ current close of index.
false: Ratio of returns over a lookback period (more normalized, less affected by absolute price levels).
Lookback Period (default 40 - weeks)
Only used when the above option is set to false.
Defines how many bars back to calculate the price change.
Show Moving Average (default off)
Optionally overlays a simple moving average on the RS line.
Moving Average Period (default 40 - weeks)
Length of the SMA when the MA is enabled.
Typical Use CaseTraders often look for:
Rising RS line → the stock is gaining strength vs. the index.
RS crossing above its moving average → potential bullish signal for relative performance.
Declining or falling RS → the stock is weakening vs. the broader market.
In summary, this is a clean and flexible relative strength comparator that lets you quickly visualize how strongly (or weakly) a stock is performing compared to a benchmark index, with two different calculation methods to suit different analytical preferences.

Panic Spike Reversal Strategy | KR3000Panic Spike Reversal Strategy | KR3000
This is a highly attractive yet dangerous trading tool, designed for traders who understand risk and are willing to face it.
The core idea is simple but powerful:
when the market experiences an abnormal surge or collapse within a higher timeframe, this strategy identifies those panic-driven spikes and enters against the move, aiming to capture the natural price mean reversion that often follows extreme emotional behavior.
This strategy is not designed for comfort.
It is designed for discipline, execution, and courage.
🔍 What This Strategy Does
Monitors a higher timeframe (e.g. 1H) in real time
Detects sharp upward or downward price spikes based on user-defined percentage thresholds
Automatically enters contrarian positions:
Spike up → Short
Spike down → Long
Optionally allows both directions within the same monitoring bar, selecting the stronger extreme when both occur
Executes all entries only after bar close, ensuring non-repainting behavior
Uses fixed percentage-based take profit and stop loss, fully adjustable by the user
Limits signals to one trigger per monitoring timeframe bar (optional), preventing overtrading
⚙️ Core Logic & Principles
Markets do not move in straight lines.
Extreme moves are often driven by fear, greed, and forced liquidity, not balanced price discovery.
This strategy is built on the assumption that:
Violent price expansions are statistically unstable
Panic moves frequently overextend, creating short-term opportunities in the opposite direction
However, mean reversion is not guaranteed.
This is why strict stop loss control is essential and fully configurable.
⚠️ Risk Warning
This is a contrarian strategy by nature.
It intentionally trades against strong momentum
Losses can occur quickly if the trend continues
It is not suitable for beginners
Best used by experienced traders who understand:
market structure
volatility behavior
and emotional discipline
If you are looking for safety, this strategy is not for you.
If you are looking for controlled danger with defined risk, this tool may be worth your attention.
🧠 Who This Strategy Is For
Traders who specialize in mean reversion or fade setups
Instruments with high liquidity and volatility (e.g. indices, gold, FX majors)
Users who value transparent logic, non-repainting signals, and full parameter control
Traders who accept that high reward potential comes with high psychological pressure

Sistema Neutro GOULART HUD Regime Radar ORB VWAPSistema Neutro GOULART is an advanced visual trading indicator that integrates:
• A unified HUD displaying session status, ORB, VWAP, risk and market bias
• A Regime Radar heatmap (GO / WAIT / NO) designed to provide clarity without chart clutter
• ORB with straight daily lines and a clean zone limited to the current session
• Direction filtering using VWAP and VWAP slope
• Condition assessment based on risk and overall market context
• A harmonized visual design focused on objective decision-making
⚠️ This indicator does NOT generate trade signals.
It provides market context, regime classification, and quality assessment to support discretionary trading decisions.
Ideal for:
• Futures markets (ES, NQ, YM)
• Day trading using ORB + VWAP
• Traders who prioritize context, discipline, and structure over signals
For educational purposes only.

Besho SetupThe Moving Averages (The Colored Lines) These three lines are the backbone of this system. They are perfectly aligned for a bullish trend (Yellow > Green > Red) and act as protective shields for the price:
The Red Line (at the bottom): This is the "General Trend Line," typically the EMA 200 (200-period Exponential Moving Average).
Function: It separates the uptrend from the downtrend. As long as the price remains well above it, the trend is strongly "bullish." Notice that the price is very far from it, indicating strong momentum.
The Green Line (in the middle): This is the "Intermediate Support Line," typically the EMA 50 or EMA 100.
Function: It acts as a bounce zone (Dynamic Support) during deep corrections. The price is shown to respect this level well in the image.
The Yellow Line (closest to the price): This is the "Fast Momentum Line," typically the EMA 20 or EMA 21.
Function: It is used for quick entries and exits. As long as the candles are closing above it, the bullish wave is sharp and continuous.

TSS by AMAGADONTSS - THE SESSION SETUP
The Methodology
THE SESSION SETUP (TSS) is a price-action framework that utilizes session-specific volatility to define intraday expansion zones. By isolating the opening ranges of the Asia, London, and New York sessions on the 15-minute (M15) timeframe, TSS identifies clear institutional "interest zones."
The algorithm monitors these ranges for two specific price-action events:
Primary Breakouts: Decisive candle closes outside the session boundaries.
Liquidity Reversals (Counter-Signals): Identification of "fake-outs" where price traps initial breakout traders before reversing through the entire session range.
Features
Automated Session Boxes: Dynamic range calculation for all major global sessions.
Precision TP Levels: Systematic profit targets based on the measured session range (R).
Timeframe Integrity: Built-in guard to ensure the logic is only applied to the M15 timeframe, preserving the accuracy of the range calculations.
Visual Median: Dotted mid-lines to identify the "mean" price within a session.
CRITICAL DISCLOSURE - PLEASE READ CAREFULLY
HIGH RISK INVESTMENT WARNING: Trading Foreign Exchange (Forex) is highly speculative, carries a high level of risk, and may not be suitable for all investors. You may sustain a loss of some or all of your invested capital; therefore, you should not speculate with capital that you cannot afford to lose. NO FINANCIAL ADVICE: The TSS - THE SESSION SETUP indicator is a technical analysis tool provided for informational and educational purposes only. It does not constitute investment advice, financial advice, or a recommendation to buy or sell any currency pair or financial instrument.
LIMITATION OF LIABILITY:
Execution Risk: The author does not guarantee the accuracy of signals. Market conditions, including news-driven volatility, spreads, and slippage, can result in trades that differ significantly from the indicator's visual signals.
Backtesting Limitation: Past performance and historical signals are not indicative of future results.
User Responsibility: You are solely responsible for your trading decisions. The author of this script shall not be held liable for any loss or damage, including without limitation, any loss of profit, which may arise directly or indirectly from the use of or reliance on this tool.
BY USING THIS SCRIPT, YOU AGREE THAT YOU ARE TRADING AT YOUR OWN RISK.

Forex Sniper @24 Support is based on Asia high and low , plus shows New York sessions and London
Background with out cuts only shows volativity times

Americana Crypto Retail FOMO IndexRetail FOMO Index
Overview
The Retail FOMO Index is a sentiment indicator designed to help identify when retail investors are piling into the crypto market — often a sign that the market may be approaching overheated conditions. Historically, periods of extreme retail enthusiasm have coincided with local and macro tops, making this a useful tool for gauging market temperature.
What It Measures
This indicator combines two real-time data sources to create a composite "FOMO score" scaled from 0 to 100:
Coinbase Premium (50% weight)
This measures the price difference between Bitcoin on Coinbase (USD) and Binance (USDT). When US retail investors are aggressively buying, Coinbase often trades at a premium to other exchanges. A rising premium suggests increased retail demand, while a negative premium can indicate selling pressure or reduced interest.
Coinbase Stock Volume (50% weight)
This tracks the trading volume of COIN (Coinbase's stock on NASDAQ) relative to its recent average. When retail interest in crypto surges, Coinbase stock volume tends to spike as both crypto traders and traditional investors react to market momentum. The indicator calculates a Z-score to identify when volume is unusually high or low compared to its norm.
Settings
The indicator includes adjustable parameters:
Weights: Adjust the balance between Coinbase Premium and COIN Volume if you find one component more relevant
Lookback Period: Controls how much historical data is used for normalization (default: 50 periods)
Smoothing: Reduces noise in the final output (default: 7 periods)
Threshold Levels: Customize the boundaries for each zone
Display Options: Toggle component lines and background fills on/off
Important Notes
The COIN volume data begins in April 2021 (Coinbase IPO), so the indicator does not have data prior to that date
The Coinbase Premium is calculated using BTC regardless of what asset chart you apply it to — BTC tends to be the leading indicator for broad retail sentiment
This indicator works best on daily, weekly, and monthly timeframes
This is a sentiment tool, not a trade signal — use it alongside your existing analysis to add context

Koma-Indikator v2272,19
USD
+0,35
+0,13%
Apple, Inc. engages in the design, manufacture, and sale of smartphones, personal computers, tablets, wearables and accessories, and other varieties of related services. It operates through the following geographical segments: Americas, Europe, Greater China, Japan, and Rest of Asia Pacific. The Americas segment includes North and South America. The Europe segment consists of European countries, as well as India, the Middle East, and Africa. The Greater China segment comprises China, Hong Kong, and Taiwan. The Rest of Asia Pacific segment includes Australia and Asian countries. Its products and services include iPhone, Mac, iPad, AirPods, Apple TV, Apple Watch, Beats products, AppleCare, iCloud, digital content stores, streaming, and licensing services. The company was founded by Steven Paul Jobs, Ronald Gerald Wayne, and Stephen G. Wozniak in April 1976 and is headquartered in Cupertino, CA.
Es sind noch 14 Min. für die Script-Bearbeitung übrig
in dieser Minute
Koma-Indikator v2
Zu Favoriten hinzufügen
Auf Chart verwenden
0
0
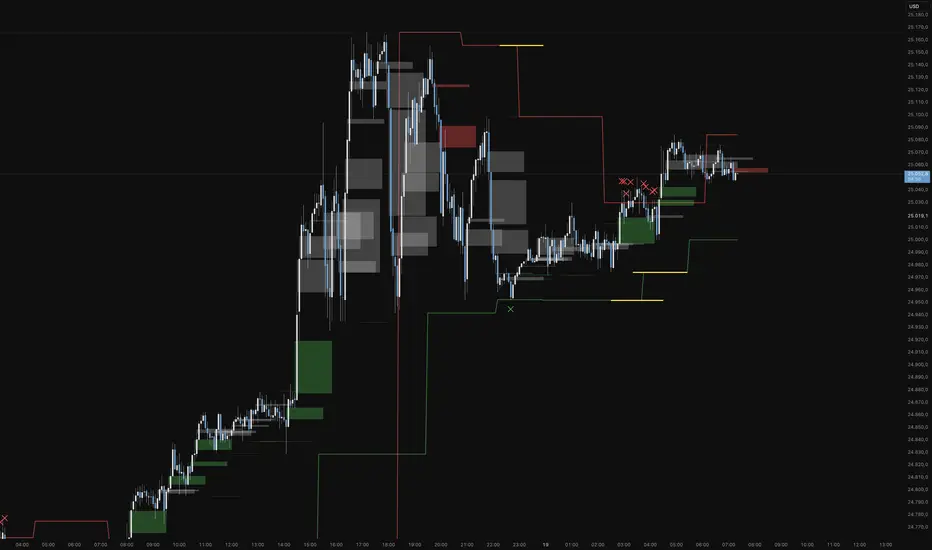
Functional Overview: Koma-Indikator V2
This indicator is a specialized analytical tool for Smart Money Concepts (SMC) trading. It is designed to automatically identify trend reversals, liquidity pools, and order flow shifts within the chart.
1. Liquidity Identification (BSL/SSL)
Major Range: The script automatically calculates significant highs and lows based on the "Major Lookback" period.
Buy-Side & Sell-Side Liquidity: These levels are plotted as red (BSL) and green (SSL) lines, serving as primary targets where the market often "hunts" for liquidity.
2. Sweep Detection (Liquidity Grabs)
The indicator detects when the price briefly exceeds a major high or low but closes back within the range.
Visuals: These potential reversal points are marked with an "X" icon above or below the candle (Sweep H/L).
3. Automated Market Structure Shifts (MSS)
The core logic tracks direction changes on two distinct levels:
Major MSS (Bold Yellow Line): Signals a significant trend reversal following a liquidity sweep. This is the primary confirmation for a new trend.
Minor MSS (Dotted Yellow Line): Highlights smaller structural breaks within a trend—ideal for aggressive "Sniper" entries on lower timeframes.
4. Dynamic Fair Value Gaps (FVG) & iFVGs
FVG Recognition: The indicator automatically draws boxes for bullish (green) and bearish (red) price imbalances.
Change in Delivery (iFVG): When a price candle closes through an existing FVG box, the box turns gray. This signals an Inverted FVG (iFVG), indicating that the order flow has officially shifted in the new direction.
5. Customization (Inputs)
Sensitivity: Users can adjust the lookback periods for both Trend (Major) and Entries (Minor) to suit different assets or timeframes.
Visual Hierarchy: All colors, line widths, and box lengths are configurable to maintain a clean and professional chart layout.
Trading Application:
By automating the "grunt work" of structural analysis, this tool allows you to focus on the trade execution:
Locate Liquidity: Identify BSL/SSL lines.
Watch for the Sweep: Look for the "X" marks.
Confirm the Shift: Wait for the yellow MSS lines.
Execute via Order Flow: Use the gray iFVG boxes as your Point of Interest (POI).
Geschütztes Skript
Dieses Script ist als Closed-Source veröffentlicht. Sie können es kostenlos und ohne Einschränkungen verwenden – erfahren Sie hier mehr.
Phantomas1
Haftungsausschluss
Die Informationen und Veröffentlichungen sind nicht als Finanz-, Anlage-, Handels- oder andere Arten von Ratschlägen oder Empfehlungen gedacht, die von TradingView bereitgestellt oder gebilligt werden, und stellen diese nicht dar. Lesen Sie mehr in den Nutzungsbedingungen.
Skript bearbeiten
Minimieren
Schließen
Koma-Indikator v2
Functional Overview: Koma-Indikator V2
This indicator is a specialized analytical tool for Smart Money Concepts (SMC) trading. It is designed to automatically identify trend reversals, liquidity pools, and order flow shifts within the chart.
1. Liquidity Identification (BSL/SSL)
Major Range: The script automatically calculates significant highs and lows based on the "Major Lookback" period.
Buy-Side & Sell-Side Liquidity: These levels are plotted as red (BSL) and green (SSL) lines, serving as primary targets where the market often "hunts" for liquidity.
2. Sweep Detection (Liquidity Grabs)
The indicator detects when the price briefly exceeds a major high or low but closes back within the range.
Visuals: These potential reversal points are marked with an "X" icon above or below the candle (Sweep H/L).
3. Automated Market Structure Shifts (MSS)
The core logic tracks direction changes on two distinct levels:
Major MSS (Bold Yellow Line): Signals a significant trend reversal following a liquidity sweep. This is the primary confirmation for a new trend.
Minor MSS (Dotted Yellow Line): Highlights smaller structural breaks within a trend—ideal for aggressive "Sniper" entries on lower timeframes.
4. Dynamic Fair Value Gaps (FVG) & iFVGs
FVG Recognition: The indicator automatically draws boxes for bullish (green) and bearish (red) price imbalances.
Change in Delivery (iFVG): When a price candle closes through an existing FVG box, the box turns gray. This signals an Inverted FVG (iFVG), indicating that the order flow has officially shifted in the new direction.
5. Customization (Inputs)
Sensitivity: Users can adjust the lookback periods for both Trend (Major) and Entries (Minor) to suit different assets or timeframes.
Visual Hierarchy: All colors, line widths, and box lengths are configurable to maintain a clean and professional chart layout.
Trading Application:
By automating the "grunt work" of structural analysis, this tool allows you to focus on the trade execution:
Locate Liquidity: Identify BSL/SSL lines.
Watch for the Sweep: Look for the "X" marks.
Confirm the Shift: Wait for the yellow MSS lines.
Execute via Order Flow: Use the gray iFVG boxes as your Point of Interest (POI).
Fortfahren