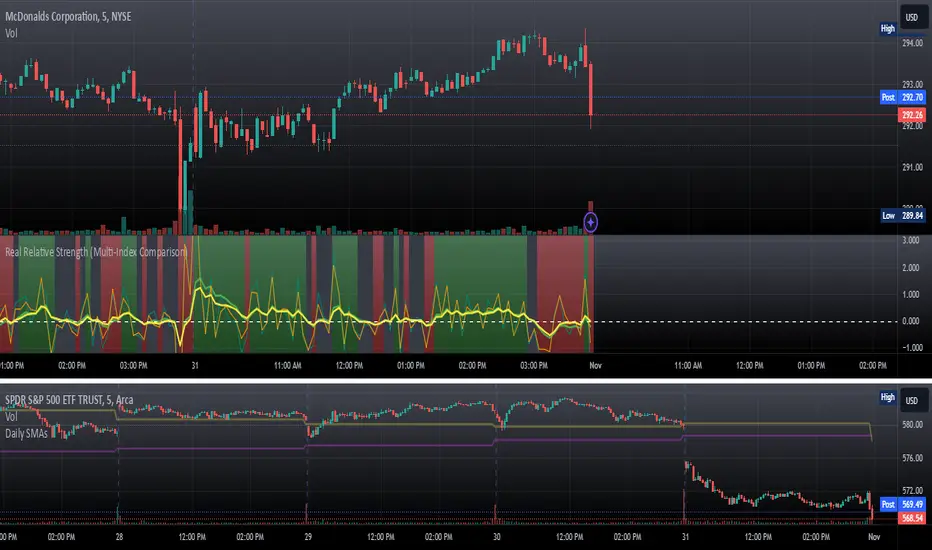
Real Relative Strength Indicator (Multi-Index Comparison)The Real Relative Strength (RRS) indicator implements the "Real Relative Strength" equation, as detailed on the Real Day Trading subreddit wiki. This equation measures whether a stock is outperforming a benchmark (such as SPY or any preferred ETF/index) by calculating price change normalized by the Average True Range (ATR) of both the stock and the indices it’s being compared to.
The RRS metric often highlights potential accumulation by institutional players. For example, in this chart, you can observe accumulation in McDonald’s beginning at 1:25 pm ET on the 5-minute chart and continuing until 2:55 pm ET. When used in conjunction with other indicators or technical analysis, RRS can provide valuable buy and sell signals.
This indicator also supports multi-index analysis, allowing you to plot relative strength against two indices simultaneously—defaulting to SPY and QQQ—to gain insights into the "real relative strength" across different benchmarks. Additionally, this indicator includes an EMA line and background coloring to help automatically identify relative strength trends, providing a clearer visualization than typical Relative Strength Comparison indicators.
المؤشرات والاستراتيجيات
Ongoing YieldFort protection (BTC)This script shows the operation of YieldFort's protection, updated every 2nd and 4th week of the month. YieldFort protection helps hedge against volatility, preventing dollar losses on BTC, ETH, or TON investments. If the cryptocurrency price drops by the end of the period, clients are compensated in the respective crypto. If the price rises, clients keep their gains. The participation fee is 0.21% per 2-week period. Recommended for Deribit charts, as calculations are based on Deribit’s expiration rates between the 2nd and 4th weeks.


ChikouTradeIndicatorIndicator Title: ChikouTradeIndicator
Short Title: CTI
Description:
The ChikouTradeIndicator (CTI) is designed to help traders identify potential trend reversals by analyzing short-term and long-term price ranges. It calculates the midpoint of the highest high and lowest low over two customizable lengths – the Turning Length (TL) and the Kumo Length (KL) – and determines market momentum by plotting the difference between these midpoints.
How It Works:
- Positive values (above the zero line) indicate bullish momentum, suggesting potential buying opportunities.
- Negative values (below the zero line) indicate bearish momentum, suggesting potential selling opportunities.
Features:
- Two customizable inputs:
- TL (Turning Length): Period used to calculate the short-term high/low midpoint.
- KL (Kumo Length): Period used to calculate the longer-term high/low midpoint.
Disclaimer:
This indicator is intended as a supportive tool to enhance trading analysis. It does not guarantee profitability and should be used with caution. Trading involves risk, and users should perform their own research before making any trading decisions. The developer is not responsible for any losses incurred through the use of this indicator.

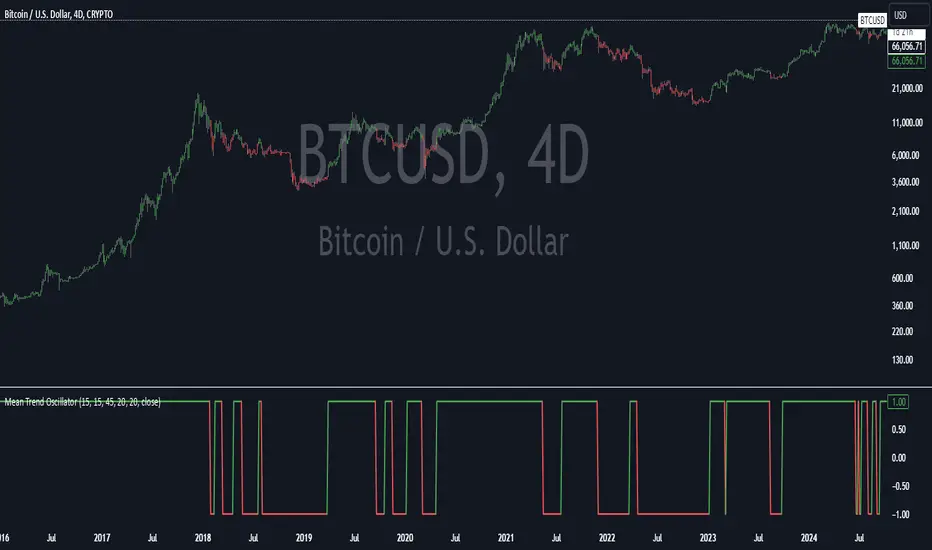
Mean Trend OscillatorMean Trend Oscillator
The Mean Trend Oscillator offers an original approach to trend analysis by integrating multiple technical indicators, using statistic to get a probable signal, and dynamically adapting to market volatility.
This tool aggregates signals from four popular indicators—Relative Strength Index (RSI), Simple Moving Average (SMA), Exponential Moving Average (EMA), and Relative Moving Average (RMA)—and adjusts thresholds using the Average True Range (ATR). By using this, we can use Statistics to aggregate or take the average of each indicators signal. Mathematically, Taking an average of these indicators gives us a better probability on entering a trending state.
By consolidating these distinct perspectives, the Mean Trend Oscillator provides a comprehensive view of market direction, helping traders make informed decisions based on a broad, data-driven trend assessment. Traders can use this indicator to enter long spot or leveraged positions. The Mean Trend Oscillator is intended to be use in long term trending markets. Scalping MUST NOT be used with this indicator. (This indicator will give false signals when the Timeframe is too low. The best intended use for high-quality signals are longer timeframes).
The current price of a beginning trend series may tell us something about the next move. Thus, the Mean Trend Oscillator allows us to spot a high probability trending market and potentially exploit this information enter long or shorts strategy. (again, this indicator will give false signals when the Timeframe is too low. The best intended use for high-quality signals are longer timeframes).
Concept and Calculation and Inputs
The Mean Trend Oscillator calculates a “net trend” score as follows:
RSI evaluates market momentum, identifying overbought and oversold conditions, essential for confirming trend direction.
SMA, EMA, and RMA introduce varied smoothing methods to capture short- to medium-term trends, balancing quick price changes with smoothed averages.
ATR-Enhanced Thresholds: ATR is used as a dynamic multiplier, adjusting each indicator’s thresholds to current volatility levels, which helps reduce noise in low-volatility conditions and emphasizes significant signals when volatility spikes.
Length could be used to adjust how quickly each indicator can more or how slower each indicator can be.
Time Coherency for Inputs: Each indicator must be calculated where each signal is relatively around the same area.
For example:
Simply:
SMA, RMA, EMA, and RSI enters long around each intended trend period. Doesn't have to be perfect, but the indicators all enter long around there.
Each indicator contributes a score (+1 for bullish and -1 for bearish), and these scores are averaged to generate the final trend score:
A positive score, shown as a green line, suggests bullish conditions.
A negative score, indicated by a red line, signifies bearish conditions.
Thus, giving us a signal to long or short.
How to Use the Mean Trend Oscillator
This indicator’s output is straightforward and can fit into various trading strategies:
Bullish Signal: A green line shows that the trend is bullish, based on a positive average score across the indicators, signaling a consideration of longing an asset.
Bearish Signal: A red line indicates bearish conditions, with an overall negative trend score, signaling a consideration to shorting an asset.
By aggregating these indicators, the Mean Trend Oscillator helps traders identify strong trends while filtering out minor fluctuations, making it a versatile tool for both short- and long-term analysis. This multi-layered, adaptive approach to trend detection sets it apart from traditional single-indicator trend tools.
9497707056 Ema 5 and 15-Minute Signal5 EMA
A 5-period EMA is a dynamic line on a trading chart that's highly responsive to recent price movements. The 5 EMA scalping strategy looks for reversals when the price moves away from the 5 EMA, which is considered the mean point of the price.
15 EMA
A 15 EMA is used in conjunction with the 5 EMA to identify bullish crossovers. A bullish crossover occurs when the 5 EMA crosses above the 15 EMA.

Colored Moving Averages With RSI SignalsMoving Average (MA):
Helps to determine the overall market trend. If the price is above the MA, it may indicate an uptrend, and if below, a downtrend.
In this case, a Simple Moving Average (SMA) is used, but other types can be applied as well.
Relative Strength Index (RSI):
This is an oscillator that measures the speed and changes of price movements.
Values above 70 indicate overbought conditions (possible sell signal), while values below 30 indicate oversold conditions (possible buy signal).
Purpose of This Indicator:
Trading Signals: The indicator generates "Buy" and "Sell" signals based on the intersection of the price line and the moving average, as well as RSI values. This helps traders make more informed decisions.
Signal Filtering: Using RSI in combination with MA allows for filtering false signals since it considers not only the current trend but also the state of overbought or oversold conditions.
How to Use:
For Short-Term Trading: Traders can use buy and sell signals to enter trades based on short-term market fluctuations.
In Combination with Other Indicators: It can be combined with other indicators for a more comprehensive analysis (e.g., adding support and resistance levels).
Overall, this indicator helps traders respond more quickly and accurately to changes in market conditions, enhancing the chances of successful trades.

SMC Order Block & Liquidity EntryThe SMC Order Block and Liquidity Trap Entry Strategy script uses Smart Money Concepts (SMC), which analyze institutional actions in the market, to assist traders in identifying high-probability trades. In order to help traders match their entry with institutional activity, this script highlights important regions of interest, including order blocks, liquidity zones, and indications for Break of Structure (BOS) or Change of Character (CHoCH).
The fundamental ideas of this approach, which focuses on regions where institutions frequently make sizable orders or sweep liquidity, are based on SMC principles. Order blocks, which are frequently important support or resistance zones when institutions are involved, are the final bullish or bearish candle before a significant price move in the other direction. There are liquidity zones that show where retail stop-loss orders build up (above recent highs or below recent lows), such as Buy-Side Liquidity (BSL) and Sell-Side Liquidity (SSL). Before changing the direction of the price, institutions could target these zones, giving traders possible chances.
The script depicts liquidity levels above or below recent highs and lows, automatically finds order blocks within a specified lookback time, and looks for BOS (a continuation signal) or CHoCH (a reversal signal). When liquidity retests inside an order block coincide with BOS or CHoCH circumstances, entry signals are produced. While short entries are triggered when the price breaks below the order block and SSL, long entry alerts are triggered when the price breaks above the order block and BSL.

Dino EMA and WMAวัตถุประสงค์ของตัวชี้วัด
ตัวชี้วัดนี้มีประโยชน์สำหรับเทรดเดอร์และนักวิเคราะห์ในการระบุแนวโน้มในตลาดอย่างชัดเจนโดยอิงจากค่าเฉลี่ยเคลื่อนที่ที่คำนวณได้แต่ละค่า EMA จะให้ข้อมูลเชิงลึกเกี่ยวกับพฤติกรรมราคาตลอดช่วงเวลาที่แตกต่างกัน ซึ่งช่วยให้เทรดเดอร์สามารถตัดสินใจได้อย่างมีข้อมูลตามทิศทางของแนวโน้ม:
EMA ระยะสั้น (เช่น EMA 10 และ EMA 14) สามารถบ่งบอกถึงการเคลื่อนไหวของราคาในระยะสั้น
EMA ระยะยาว (เช่น EMA 100 และ EMA 200) ช่วยในการระบุแนวโน้มโดยรวมของตลาด
การใช้งานจริง
เทรดเดอร์มักมองหาการตัดกันระหว่าง EMA (เช่น เมื่อ EMA ระยะสั้นตัดขึ้นหรือตัดลงกับ EMA ระยะยาว) เป็นสัญญาณซื้อหรือขายที่อาจเกิดขึ้น WMA ยังสามารถใช้ในการยืนยันแนวโน้มได้ เนื่องจากมันตอบสนองต่อการเปลี่ยนแปลงราคาล่าสุด
โดยการวางตัวชี้วัดเหล่านี้บนกราฟราคา เทรดเดอร์สามารถมองเห็นพลศาสตร์ของตลาดได้ชัดเจนยิ่งขึ้น ซึ่งช่วยสนับสนุนกลยุทธ์การเทรดของพวกเขา

Stochastic и MACDStrategy Algorithm
1. Identify a "big candle" based on the following conditions:
Green (bullish) candle: consider only the upper shadow, ignoring the lower shadow.
Red (bearish) candle: consider only the lower shadow, ignoring the upper shadow.
2. Indicator filters:
The candle should be outside the bounds of the Stochastic and MACD indicators.
3. Fibonacci levels:
Draw Fibonacci levels from -1 to 2 on the selected candle.
The Fibonacci projection extends to the right, covering the next 25 candles.


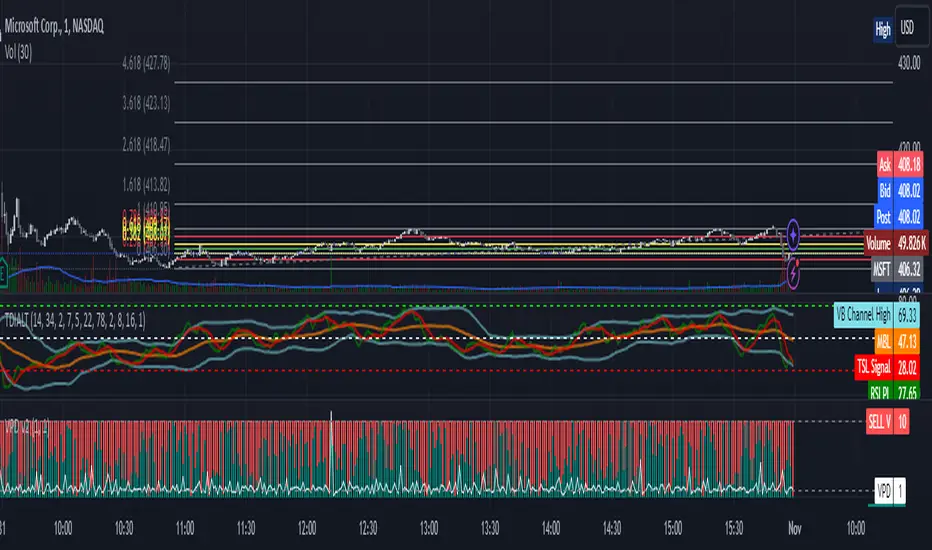
Volume/Price Divergence v2The "Volume/Price Divergence v2" indicator is designed to analyze the relationship between volume and price movements in a financial market. It helps traders identify potential divergences that may indicate a change in market trends. Here’s a breakdown of how it works:
### Key Components
1. **Volume Calculation**:
- **Buying Volume**: This is calculated based on the relationship between the closing price and the high/low range. If the closing price is closer to the low, more volume is attributed to buying.
- **Selling Volume**: Conversely, if the closing price is closer to the high, more volume is considered selling.
The formulas used are:
```pinescript
buyVolume = high == low ? 0 : volume * (close - low) / (high - low)
sellVolume = high == low ? 0 : volume * (high - close) / (high - low)
```
2. **Plotting Volume**:
- The total volume is plotted in red and buying volume is plotted in teal. This helps visualize the volume distribution during different price movements.
3. **Rate of Change (ROC)**:
- The indicator calculates the rate of change for both volume and price over a specified period. This allows traders to see how volume and price are changing relative to each other.
```pinescript
roc = source / source
roc2 = source2 / source2
```
4. **Volume/Price Divergence (VPD)**:
- The VPD is derived from the ratio of the ROC of volume to the ROC of price. This ratio helps identify divergences:
- A VPD significantly above 10 may indicate strong divergence, suggesting that price movements are not supported by volume.
- A VPD around 1 indicates that volume and price are moving in harmony.
5. **Horizontal Lines**:
- The indicator includes horizontal lines at levels 10 (high divergence) and 1 (low divergence), serving as visual cues for traders to assess the market's state.
### Interpretation
- **Divergence**: If price makes a new high but volume does not follow (or vice versa), it may signal a potential reversal or weakness in the trend.
- **Volume Trends**: Analyzing the buying vs. selling volume can provide insights into market sentiment, helping traders make informed decisions.
- **Potential for a Strong Move**: A high VPD during a breakout indicates that while volume is increasing, the price isn’t moving significantly, suggesting that a big price move could be imminent.
- **Caution Before Entry**: Traders should be aware that the lack of price movement relative to high volume may signal an impending volatility spike, which could lead to a rapid price change in either direction.
Overall, this indicator is useful for traders looking to gauge the strength of price movements and identify potential reversals or breakouts based on volume trends.
9497707056 Golden CrossoverDay traders close positions within the same day, while swing traders hold overnight or for several days to weeks for potential profits. Are swing traders more successful? The success of swing traders depends on various factors, including their strategy, risk management, and market conditions.

RANDI NACHDISCLAIMER
This indicator is not promoting scalping related activities and give financial advise to buy or sell.
This indicator is made for educational purpose only which gives the idea about the trend based on strength.
This script is a tool designed for educational and informational purposes in the field of technical analysis. It does not guarantee any financial return and should not be used as a substitute for professional trading advice. Always perform thorough research and consult with a financial advisor before making any trading decisions. Past performance is not indicative of future results, and trading involves significant risks, including the loss of capital.
Strategy Explanation
This Pine Script indicator combines Bollinger Bands and RSI to identify potential trend reversal zones.
Bollinger Bands (BB): A volatility indicator using a moving average and standard deviations. The script calculates Bollinger Bands based on a user-selected timeframe and inputs for period length and standard deviation.
Relative Strength Index (RSI): A momentum oscillator that ranges from 0 to 100. It’s commonly used to identify overbought or oversold conditions. The script calculates RSI on a selectable timeframe with a default period of 14.

Trend Change Detection by SpotTheTrendThis script identifies potential trend changes by analyzing volume, RSI, and EMA indicators, with a built-in cool-down to avoid consecutive signals.
█ OVERVIEW
The "Trend Change Detection" script helps traders identify potential shifts in market direction by analyzing specific conditions in volume, RSI, and EMA. A cool-down period between signals minimizes noise, providing clearer entry signals.
█ CONCEPTS
Unlike many indicators that produce frequent signals, this script’s cool-down feature filters out consecutive signals, focusing on quality over quantity. This approach reduces premature entries and potential false signals, making it a valuable tool for more disciplined trading.
The main idea of this indicator is to help in risk management and drawdown reduction by enforcing selectivity, the cool-down period helps prevent over-trading in volatile or sideways markets, which can reduce exposure to extended drawdowns. This functionality supports more prudent trade entries, aligning with risk management strategies for improved trading outcomes.
We can take a look at the NASDAQ:NVDA chart as an example of a potential long position:
The main trend is bullish. While some might enter directly, avoiding drawdowns may suit others’ trading styles better::
• FEATURES
Bullish and Bearish Signals: Displays potential trend changes with bullish signals marked as green dots and bearish signals as red dots directly on the chart.
Cool-down Period: Reduces noise by limiting consecutive signals.
Visual Indicators: Colors bars by trend direction for quick visual reference.
• HOW TO USE
Bullish Signals: Indicated by green dots above bars, suggesting potential long opportunities.
Bearish Signals: Indicated by red dots below bars, suggesting potential short opportunities.
I created the "Trend Change Detection" indicator with the hope that it becomes a valuable part of your trading toolkit, helping you monitor trends with clarity and manage risk more effectively.
• DISCLAIMER
This tool is for informational purposes only. Always perform thorough analysis before entering trades.


20-40 SMA Crossover with Buy/Sell ArrowsThis script is designed to help traders visually identify potential entry and exit points based on the crossover of two Simple Moving Averages (SMA) — the 20-period and 40-period SMAs. By using these widely followed moving averages, this indicator highlights possible buy and sell opportunities in line with the trend.
How It Works
20 SMA (Short-term) and 40 SMA (Mid-term): The 20-period SMA is a short-term moving average, while the 40-period SMA is a mid-term average. The crossover of these SMAs provides insights into potential trend shifts.
Crossover & Crossunder Signals:
A Buy Signal is generated when the 20 SMA crosses above the 40 SMA, signaling upward momentum and potential entry points. Green arrows labeled "BUY" mark these points below the price bars.
A Sell Signal is triggered when the 20 SMA crosses below the 40 SMA, indicating possible downward momentum and exit points. Red arrows labeled "SELL" are shown above the price bars.
Key Features
Visual Clarity: Green and red arrows mark buy and sell points on the chart, making it easy to spot opportunities at a glance.
Overlay on Price Chart: The script overlays the 20 SMA and 40 SMA directly on the chart, offering a clear view of price in relation to these averages.
Customizable for Multiple Timeframes: This indicator can be applied to various timeframes, adapting to different trading styles.
Ideal for
Trend Traders looking to capture the momentum of the market.
Beginner and Intermediate Traders who need a simple and effective trend-following strategy.
Note: This indicator is best used in trending markets and should be combined with additional analysis and risk management techniques for effective trading decisions.

Dino EMA and WMA
✨ สัมผัสกับความแม่นยำในการซื้อขายด้วย Exponential Moving Averages (EMA) และ Weighted Moving Average (WMA)! 🎯
🔸 EMA 14 (สีเหลือง): ติดตามแนวโน้มระยะสั้นอย่างรวดเร็ว
🔸 EMA 10 (สีชมพู): ให้สัญญาณที่ชัดเจนในตลาดที่มีความผันผวน
🔸 EMA 50 (สีแดง): เส้นสำคัญที่ช่วยยืนยันแนวโน้มในระยะกลาง
🔸 EMA 60 (สีฟ้า): เส้นที่บ่งบอกถึงการเปลี่ยนแปลงแนวโน้มที่สำคัญ
🔸 EMA 100 (สีเขียว): มุมมองระยะยาวที่ช่วยให้คุณเห็นภาพรวม
🔸 EMA 200 (สีม่วง): เส้นแนวโน้มหลักที่ยืนยันทิศทางการเคลื่อนไหวในระยะยาว
🔵 Weighted Moving Average 720 (สีน้ำเงินเข้ม): เน้นความสำคัญของข้อมูลในอดีตเพื่อสร้างสัญญาณที่แม่นยำ
พัฒนาโดย เพอซี่ลูกปั๊กอัจริยะ


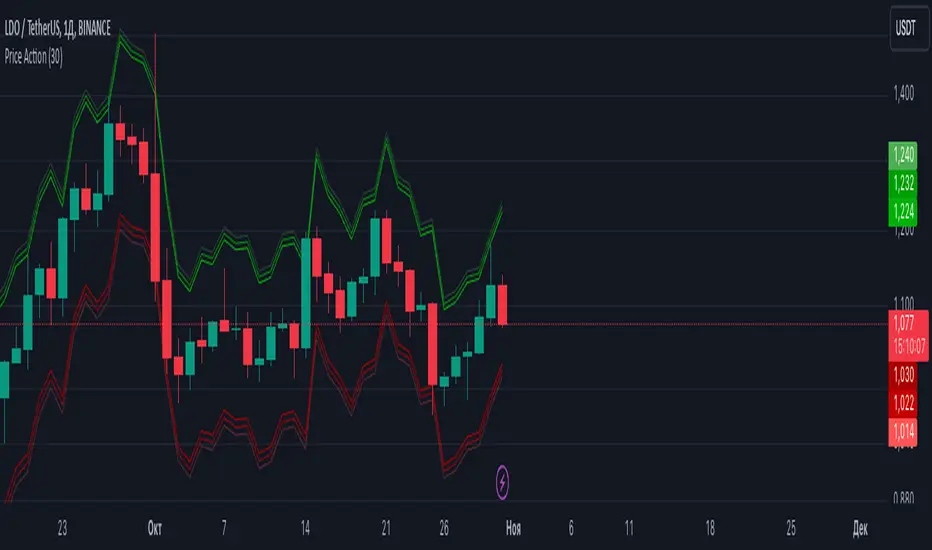
Price ActionThis Pine Script code creates an indicator that plots price channels for volatility analysis:
The main parameter is the period length (default is 30), used to calculate volatility with ATR (Average True Range). Data retrieval: The indicator takes the closing price and uses it for calculations. Channel calculation: Based on volatility, three levels of channels are created: the first is the base channel, while the second and third are expanded by 8% and 16%.
First-level channels: The upper and lower boundaries of the channel are calculated based on volatility. This uses the previous bar's closing price, adjusted by a volatility coefficient.
Second and third-level channels: These channels expand by 8% and 16%, respectively, from the base channel. This creates zones that can indicate increasing or decreasing market volatility.
Each channel uses different colors and transparency levels:
The upper and lower boundaries of the first channel have solid colors.
The second channel boundaries are more transparent to denote extended levels.
The third channel boundaries are also transparent, indicating the widest range of deviation.
Visualization: Channels are displayed with different colors and transparency levels to illustrate price ranges and volatility changes.
Purpose: The indicator helps traders visualize price ranges and assess market volatility, which is useful for making trading decisions.
Practical application: This indicator assists traders in evaluating market volatility and building trading strategies based on price ranges. The extended channels can be used to identify potential reversal or trend continuation zones.
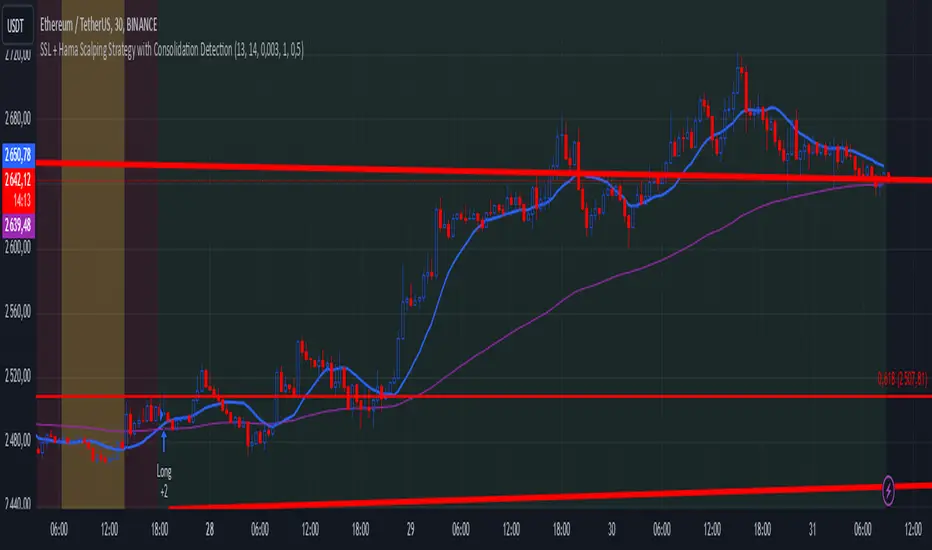
TrendGuard Scalper: SSL + Hama Candle with Consolidation ZonesThis TradingView script brings a powerful scalping strategy that combines the SSL Channel and Hama Candles indicators with a special twist—consolidation detection. Designed for traders looking for consistency in various markets like crypto, forex, and stocks, this strategy highlights clear trend signals, risk management, and helps filter out risky trades during consolidation periods.
Why Use This Strategy?
Clear Trend Detection:
With the SSL Channel, you’ll know exactly when the market is in an uptrend (green) or downtrend (red), giving you straightforward entry points.
Short-Term Trend Precision with Hama Candles:
By calculating unique EMAs for open, high, low, and close, the Hama Candles show the strength and direction of short-term trends. Combined with the Hama Line, it gives you a solid confirmation on whether the trend is strong or about to reverse, allowing for precise entries and exits.
Avoiding Choppy Markets:
Thanks to ATR-based consolidation detection, this strategy identifies low-volatility periods where the market is “choppy” and less predictable. During these times, a yellow background appears on the chart, warning you to hold off on trades, reducing the likelihood of entering losing trades.
Built-In Risk Management:
With adjustable Take Profit and Stop Loss levels based on price movements, you can set and forget your trades, with a safety net if the market turns against you. The strategy automatically closes positions if the price returns to the Hama Candle, keeping your risk low.
How It Works:
Long Position: When both the SSL and Hama indicators show a green trend, and the price is above the Hama Candles, the strategy opens a long position. Take Profit triggers at your chosen risk-to-reward ratio, while Stop Loss protects you just below the Hama Line.
Short Position: When both indicators align in red and the price is below the Hama Candles, the strategy opens a short. Similar to longs, Stop Loss is set just above the Hama Line, and Take Profit is at your defined level.
Start Trading Confidently
Test this strategy with different settings and discover how it can perform across various assets. Whether you're trading Bitcoin, forex pairs, or stocks, this system has the flexibility and robustness to help you spot profitable trends and avoid risky zones. Try it today on a 30-minute timeframe to see how it aligns with your trading goals, and let the consolidation detection guide you away from false signals.
Happy trading, and may the trends be with you! 📈
Strategy Guide | XEONEDIAStrategy Guide | XEONEDIA is a digital checklist of well-known trading strategies, it does not show anything in the chart but only a customized checklist per strategy of priorities can be processed, this indicator is a comprehensive trading indicator that serves as a digital checklist, supporting traders in the preparation and execution of their trading strategies. The indicator is ideal for beginners and advanced traders who value clear structure and precise steps for each trading method.
Why Strategy Guide | XEONEDIA?
🎨 User-friendly design, perfect for beginners and advanced traders
🌐 Multi-language options, including 🇩🇪, 🇬🇧, 🇫🇷, and 🇱🇺.
⚙️ Customizable checklist for every strategy
📲 Easy integration and access on all TradingView devices
Features of Strategy Guide | XEONEDIA:
Strategy Documentation and Analysis
📋 Define a clear trading strategy
🔄 Conduct backtests and analyze results
🎯 Set realistic goals and reflect on the success rate
✍️ Document key insights to regularly refine the strategy
Risk Management
💼 Set clear risk limits (1-2% per trade)
🚨 Use stop-loss orders to protect against significant losses
⚖️ Ensure at least a 2:1 risk-reward ratio
📝 Adjust position sizes according to market conditions
Technical Analysis
📊 Analyze charts and market indicators for trading signals
🔎 Identify support and resistance levels
📈 Utilize indicators like RSI and moving averages
📍 Set entry and exit points for strategic decisions
📲 Create alerts for important market conditions
Market Conditions
🌍 Consider external factors and economic data
📆 Monitor the economic calendar and relevant news
📰 Conduct fundamental analysis to identify trends
📉 Observe market volatility and global events
💡 Adjust the strategy when significant market changes occur
Psychological Management
🧠 Control emotions and avoid impulsive actions
📑 Strictly adhere to the trading plan
🛠 Set realistic expectations and learn from each trade
🌱 Take regular mental breaks to manage stress
💬 Reflect on your trading and note insights for future decisions
✅ Mastercheck Feature
The Mastercheck feature allows you to check off all points directly in the TradingView interface, efficiently organizing your trading preparation. This feature ensures that you have access to your checklist entries anywhere, anytime, and can make real-time adjustments.
Strategy Guide | XEONEDIA simplifies the complex world of trading by helping you approach it systematically and focused, enabling you to pursue your goals efficiently and with mindful risk management.

Gelişmiş Destek/Direnç, Fibonacci ve Al/Sat Sinyalleri//@version=5
indicator("Gelişmiş Destek/Direnç, Fibonacci ve Al/Sat Sinyalleri", overlay=true)
// Parametreler
smaLength = input.int(50, "SMA Uzunluğu", minval=1)
atrLength = input.int(14, "ATR Uzunluğu", minval=1)
lookback = input.int(20, "Destek/Direnç Aralığı", minval=1)
volumeThreshold = input.float(1.5, "Hacim Eşik Değeri", minval=1)
// Ortalama Gerçek Aralık (ATR) ile Destek/Direnç Seviyeleri
atr = ta.atr(atrLength)
highestHigh = ta.highest(high, lookback)
lowestLow = ta.lowest(low, lookback)
upperBand = highestHigh + atr
lowerBand = lowestLow - atr
// Fibonacci Seviyeleri
fib_0 = lowestLow
fib_236 = lowestLow + (highestHigh - lowestLow) * 0.236
fib_382 = lowestLow + (highestHigh - lowestLow) * 0.382
fib_50 = lowestLow + (highestHigh - lowestLow) * 0.5
fib_618 = lowestLow + (highestHigh - lowestLow) * 0.618
fib_100 = highestHigh
// SMA Hesaplama
sma = ta.sma(close, smaLength)
// Al/Sat Sinyalleri - Fiyat SMA'nın Üzerinde ve Hacim Yüksek Olmalı
isBullish = ta.crossover(close, sma) and volume > ta.sma(volume, 20) * volumeThreshold
isBearish = ta.crossunder(close, sma) and volume > ta.sma(volume, 20) * volumeThreshold
// Grafik Üzerine Çizim
plot(sma, color=color.blue, linewidth=2, title="50 Günlük SMA")
// Dinamik Destek ve Direnç Çizgileri
var line upperLine = na
var line lowerLine = na
if (bar_index > lookback)
line.delete(upperLine)
line.delete(lowerLine)
upperLine := line.new(x1=bar_index-lookback, y1=upperBand, x2=bar_index, y2=upperBand, color=color.red, width=1, style=line.style_dotted)
lowerLine := line.new(x1=bar_index-lookback, y1=lowerBand, x2=bar_index, y2=lowerBand, color=color.green, width=1, style=line.style_dotted)
// Fibonacci Çizgileri
line.new(bar_index - lookback, fib_0, bar_index, fib_0, color=color.purple, width=1, style=line.style_solid)
line.new(bar_index - lookback, fib_236, bar_index, fib_236, color=color.purple, width=1, style=line.style_dotted)
line.new(bar_index - lookback, fib_382, bar_index, fib_382, color=color.purple, width=1, style=line.style_dotted)
line.new(bar_index - lookback, fib_50, bar_index, fib_50, color=color.purple, width=1, style=line.style_dotted)
line.new(bar_index - lookback, fib_618, bar_index, fib_618, color=color.purple, width=1, style=line.style_dotted)
line.new(bar_index - lookback, fib_100, bar_index, fib_100, color=color.purple, width=1, style=line.style_solid)
// Al ve Sat İşaretleri
plotshape(series=isBullish, location=location.abovebar, color=color.green, style=shape.labelup, text="AL")
plotshape(series=isBearish, location=location.belowbar, color=color.red, style=shape.labeldown, text="SAT")
