Index Position Size Calculator for [US30 / US100 / SP500]What it does
This tool helps you size positions consistently for index trades on US30 (Dow Jones), NAS100 (Nasdaq-100), and SP500 (S&P 500). Enter your account balance, risk %, and your planned Entry / Stop-Loss / Target and the script calculates:
• Position Size (rounded to your lot/contract step)
• Risk-to-Reward (R/R)
• Potential P/L in USD based on your inputs
• Visual Entry / SL / TP lines with green/red zones and concise labels
Supported contract styles
Choose a preset for common products (e.g., CFD $1/pt, YM/NQ/ES futures, MYM/MNQ/MES micros) or override the economics yourself. You remain in control of the two key levers:
• $/point — how many dollars you gain/lose per 1 index point per contract/lot
• Point size — how many price units equal 1 index point on your chart (often 1.0, but some brokers use 0.1 or 0.5)
Inputs
• Account Balance ($) and Risk % per trade
• Index: US30 / NAS100 / SP500
• Contract: CFD / Futures (YM, NQ, ES) / Micros (MYM, MNQ, MES)
• $/point: auto from Contract or manual override
• Point size: auto from Index or manual override
• Position size step: rounding (e.g., 1 for futures, 0.01 for CFDs)
• Entry / SL / TP: typed values (snapped to tick), with on-chart zones and labels
• Display toggles for lines and labels
How the math works
• StopPoints = |Entry − SL| ÷ PointSize
• ProfitPoints = |TP − Entry| ÷ PointSize
• Position Size = (AccountBalance × Risk%) ÷ (StopPoints × $/point)
• R/R = ProfitPoints ÷ StopPoints
• Potential P/L = PositionSize × Points × $/point
How to use (quick start)
1. Select Index and Contract.
2. Confirm $/point and Point size match your broker’s specs.
3. Enter Entry / SL / TP for the trade idea.
4. Read the Position Size, R/R, and Potential P/L in the info box.
5. Adjust for fees, spreads, and slippage as needed.
Notes & limitations
• Broker symbols can vary. Always verify $/point and Point size for your instrument before risking capital.
• The script does not place orders and does not generate trade signals; it’s a sizing/visualization tool.
• Results can differ across brokers due to pricing, spreads, minimum lot sizes, and execution rules.
• Use on the intended indices; you’ll see a reminder if you load it elsewhere.
Changelog highlights
• Pine v6, constant-safe inputs, tick-snapping, global fills (no local-scope errors).
• Robust label handling and optional minimal chart markers.
Disclaimer
This script is provided for educational purposes only and does not constitute financial advice or a recommendation to buy or sell any security or derivative. Trading involves risk, including the possible loss of principal. Always do your own research, verify contract specifications with your broker, and consider testing in a demo environment before trading live.
خدمات Pine

Apex Edge - London Open Session# Apex Edge - London Open Session Trading System
## Overview
The London Open Session indicator captures institutional price action during the first hour of the London forex session (8:00-9:00 AM GMT) and identifies high-probability breakout and retest opportunities. This system tracks the session's high/low range and generates precise entry signals when price breaks or retests these key institutional levels.
## Core Strategy
**Session Tracking**: Automatically identifies and marks the London Open session boundaries, creating a trading zone from the first hour's price range.
**Dual Entry Logic**:
- **Breakout Entries**: Triggers when price closes beyond the session high/low and continues in that direction
- **Retest Entries**: Activates when price returns to test the broken level as new support/resistance
**Performance Analytics**: Built-in win rate tracking displays real-time performance statistics over user-defined lookback periods, enabling data-driven optimization for each currency pair.
## Key Features
### Automated Zone Detection
- Precise London session timing with timezone offset controls
- Visual session boundaries with customizable colours
- Automatic high/low range calculation and display
### Smart Entry System
- Breakout confirmation requiring candle close beyond zone
- Retest detection with configurable pip distance tolerance
- Separate risk/reward ratios for breakout vs retest entries
- Visual entry arrows with clear trade direction labels
### Performance HUD
- Real-time win rate calculation over customizable periods (7-365 days)
- Total trades tracking with win/loss breakdown
- Average risk-reward ratio display
- Color-coded performance metrics (green >70%, yellow >50%, red <50%)
### PineConnector Integration
- Direct MT4/MT5 execution via PineConnector alerts
- Proper forex pip calculations for all currency pairs
- Customizable risk percentage per trade
- Symbol override capability for broker compatibility
- Automatic SL/TP level calculation in pips
## Critical Usage Requirements
### Pair-Specific Optimization
Each currency pair requires individual optimization due to varying volatility characteristics, institutional participation levels, and typical price ranges during London hours. The performance HUD is essential for identifying optimal settings before live trading.
**Recommended Testing Process**:
1. Apply indicator to desired currency pair and timeframe
2. Experiment with session timing - while 8:00-9:00 AM GMT is standard, some pairs may show improved performance with alternative hourly windows (e.g., 7:00-8:00 AM or 9:00-10:00 AM)
3. Adjust Stop Loss distances, Risk/Reward ratios, and Retest distances
4. Monitor win rate over 30+ day periods using the performance HUD
5. Only proceed with live alerts once consistent 60%+ win rates are achieved
6. Create separate optimized chart setups for each profitable pair/timeframe combination
### Timeframe Specifications
This indicator is specifically designed and tested for:
- **1-minute charts**: Optimal for capturing immediate institutional reactions
- **5-minute charts**: Balanced approach between noise reduction and opportunity frequency
Higher timeframes generally produce inferior results due to increased noise and reduced institutional edge during the London session window.
## Settings Configuration
### Session Timing
- **London Open/Close Hours**: Adjust for your chart's timezone
- **Rectangle End Time**: Set to 4:30 PM to stop signals before NY session close
- **Timezone Offset**: Ensure accurate London session capture
### Entry Parameters
- **Retest Distance**: 3-8 pips depending on pair volatility
- **Stop Loss Pips**: Separate settings for breakouts (10-15 pips) and retests (8-12 pips)
- **Risk/Reward Ratios**: Independent ratios for different entry types
### PineConnector Setup
- **License ID**: Your PineConnector license key
- **Symbol Override**: MT4/MT5 symbol names if different from TradingView
- **Risk Percentage**: Position size as percentage of account balance
- **Prefix/Comment**: Organize trades in terminal
## Manual Trading Limitations
Without PineConnector automation, traders face significant practical challenges:
**Settings Management**: Each currency pair requires different optimized parameters. Switching between charts means manually adjusting multiple settings each time, creating potential for errors and missed opportunities.
**Timing Sensitivity**: London Open signals can occur rapidly during high-volatility periods. Manual execution may result in slippage or missed entries.
**Multi-Pair Monitoring**: Tracking 4-11 currency pairs simultaneously while manually adjusting settings for each switch becomes impractical for most traders.
**Parameter Consistency**: Risk of using suboptimal settings when quickly switching between pairs, potentially compromising the careful optimization work.
## Recommended Workflow
1. **Historical Testing**: Use win rate HUD to identify profitable pairs and optimal parameters
2. **Demo Automation**: Test PineConnector alerts on demo accounts with optimized settings
3. **Live Implementation**: Deploy alerts only on proven profitable pair/timeframe combinations
4. **Ongoing Monitoring**: Regular review of performance metrics to maintain edge
## Risk Disclaimer
This indicator provides analysis tools and automation capabilities but does not guarantee profitable trading outcomes. Past performance does not predict future results. Users should thoroughly backtest and demo trade before risking live capital. The London session strategy works best during specific market conditions and may underperform during low volatility or unusual market environments.
## Support Requirements
Successful implementation requires:
- Basic understanding of London session market dynamics
- PineConnector subscription for automation features
- Patience for proper optimization process
- Realistic expectations about win rates and drawdown periods
This system is designed for serious traders willing to invest time in proper optimization and risk management rather than plug-and-play solutions.

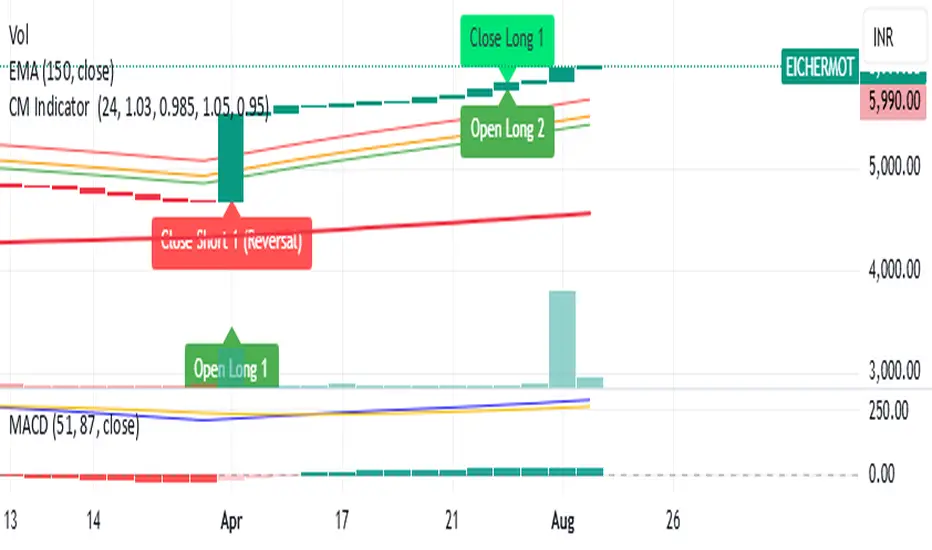
CM Indicator About Indicator:-
1) This is best Indicator for trend identification.
2) This is based on 42 EMA with Upper Band and Lower bands for trend identification.
3) This should be used for Line Bar chart only.
4) Line bar chart should be used at 1 hour for 15 line breaks.
How to Use:-
1) To go with trend is best use of this indicator.
2) This is for stocks and options not for index. Indicator used for Stocks at one hour and options for 10-15 minutes line break.
3) There will be 5% profitability defined for each entry, 3 entries with profit are best posible in same continuous trend 4 and 5th entry is in riskier zone in continuous trend.
4) Loss will only happen if there is trend reversal.
5) Loss could only be one trade of profit out of three profitable trades.
6) Back tested on 200 stocks and 100 options.
Auto Daily High/Low/50%This indicator automatically plots the current daily high and low, as well as the midrange.

RSI-MACD-trade"Strategic trading strategy using RSI and MASCD
Highest returns when applied to weekly charts"
US100 Liquidity Precision StrategyScalping strategy 5-10 point sl / 17 points tp
Automatic BE
Consistent money over time

Script Info BannerThe script includes a small template displaying the username, script name, and date of analysis. This feature is implemented to establish credibility and prevent unauthorized use of the analysis.
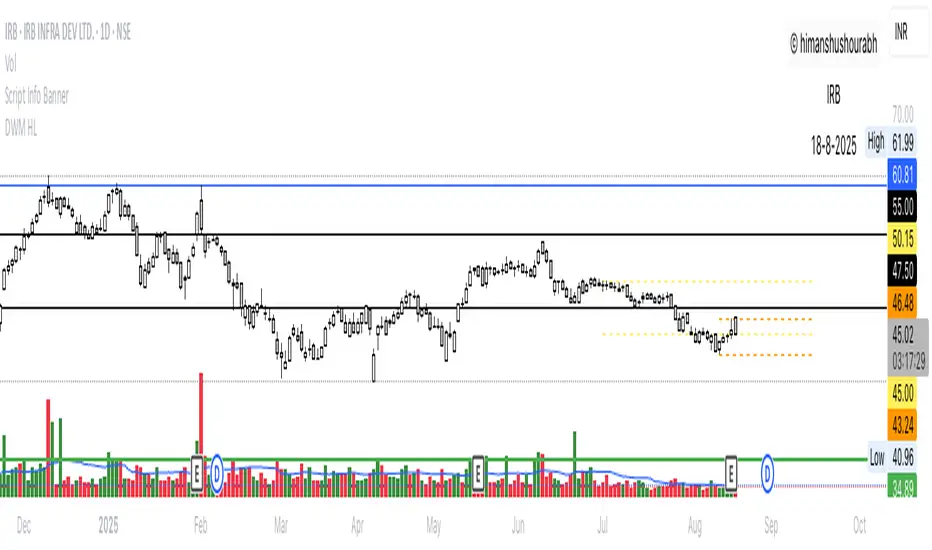
Chart-Only Scanner — Pro Table v2.5.1Chart-Only Scanner — Pro Table v2.5
User Manual (Pine Script v6)
What this tool does (in one line)
A compact, on-chart table that scores the current chart symbol (or an optional override) using momentum, volume, trend, volatility, and pattern checks—so you can quickly decide UP, DOWN, or WAIT.
Quick Start (90 seconds)
Add the indicator to any chart and timeframe (1m…1M).
Leave “Override chart symbol” = OFF to auto-use the chart’s symbol.
Choose your layout:
Row (wide horizontal strip), or Grid (title + labeled cells).
Pick a size preset (Micro, Small, Medium, Large, Mobile).
Optional: turn on “Use Higher TF (EMA 20/50)” and set HTF Multiplier (e.g., 4 ⇒ if chart is 15m, HTF is 60m).
Watch the table:
DIR (↑/↓/→), ROC%, MOM, VOL, EMA stack, HTF, REV, SCORE, ACT.
Add an alert if you want: the script fires when |SCORE| ≥ Action threshold.
What to expect
A small table appears on the chart corner you choose, updating each bar (or only at bar close if you keep default smart-update).
The ACT cell shows 🔥 (strong), 👀 (medium), or ⏳ (weak).
Panels & Settings (every option explained)
Core
Momentum Period: Lookback for rate-of-change (ROC%). Shorter = more reactive; longer = smoother.
ROC% Threshold: Minimum absolute ROC% to call direction UP (↑) or DOWN (↓); otherwise →.
Require Volume Confirmation: If ON and VOL ≤ 1.0, the SCORE is forced to 0 (prevents low-volume false positives).
Override chart symbol + Custom symbol: By default, the indicator uses the chart’s symbol. Turn this ON to lock to a specific ticker (e.g., a perpetual).
Higher TF
Use Higher TF (EMA 20/50): Compares EMA20 vs EMA50 on a higher timeframe.
HTF Multiplier: Higher TF = (chart TF × multiplier).
Example: on 3H chart with multiplier 2 ⇒ HTF = 6H.
Volatility & Oscillators
ATR Length: Used to show ATR% (ATR relative to price).
RSI Length: Standard RSI; colors: green ≤30 (oversold), red ≥70 (overbought).
Stoch %K Length: With %D = SMA(%K, 3).
MACD Fast/Slow/Signal: Standard MACD values; we display Line, Signal, Histogram (L/S/H).
ADX Length (Wilder): Wilder’s smoothing (internal derivation); also shows +DI / −DI if you enable the ADX column.
EMAs / Trend
EMA Fast/Mid/Slow: We compute EMA(20/50/200) by default (editable).
EMA Stack: Bull if Fast > Mid > Slow; Bear if Fast < Mid < Slow; Flat otherwise.
Benchmark (optional, OFF by default)
Show Relative Strength vs Benchmark: Displays RS% = ROC(symbol) − ROC(benchmark) over the Momentum Period.
Benchmark Symbol: Ticker used for comparison (e.g., BTCUSDT as a market proxy).
Columns (show/hide)
Toggle which fields appear in the table. Hiding unused fields keeps the layout clean (especially on mobile).
Display
Layout Mode:
Row = a single two-row strip; each column is a metric.
Grid = a title row plus labeled pairs (label/value) arranged in rows.
Size Preset: Micro, Small, Medium, Large, Mobile change text size and the grid density.
Table Corner: Where the panel sits (e.g., Top Right).
Opaque Table Background: ON = dark card; OFF = transparent(ish).
Update Every Bar: ON = update intra-bar; OFF = smart update (last bar / real-time / confirmed history).
Action threshold (|score|): The cutoff for 🔥 and alert firing (default 70).
How to read each field
CHART: The active symbol name (or your custom override).
DIR: ↑ (ROC% > threshold), ↓ (ROC% < −threshold), → otherwise.
ROC%: Rate of change over Momentum Period.
Formula: (Close − Close ) / Close × 100.
MOM: A scaled momentum score: min(100, |ROC%| × 10).
VOL: Volume ratio vs 20-bar SMA: Volume / SMA(Volume,20).
1.5 highlights as yellow (significant participation).
ATR%: (ATR / Close) × 100 (volatility relative to price).
RSI: Colored for extremes: ≤30 green, ≥70 red.
Stoch K/D: %K and %D numbers.
MACD L/S/H: Line, Signal, Histogram. Histogram color reflects sign (green > 0, red < 0).
ADX, +DI, −DI: Trend strength and directional components (Wilder). ADX ≥ 25 is highlighted.
EMA 20/50/200: Current EMA values (editable lengths).
STACK: Bull/Bear/Flat as defined above.
VWAP%: (Close − VWAP) / Close × 100 (premium/discount to VWAP).
HTF: ▲ if HTF EMA20 > EMA50; ▼ if <; · if flat/off.
RS%: Symbol’s ROC% − Benchmark ROC% (positive = outperforming).
REV (reversal):
🟢 Eng/Pin = bullish engulfing or bullish pin detected,
🔴 Eng/Pin = bearish engulfing or bearish pin,
· = none.
SCORE (absolute shown as a number; sign shown via DIR and ACT):
Components:
base = MOM × 0.4
volBonus = VOL > 1.5 ? 20 : VOL × 13.33
htfBonus = use_mtf ? (HTF == DIR ? 30 : HTF == 0 ? 15 : 0) : 0
trendBonus = (STACK == DIR) ? 10 : 0
macdBonus = 0 (placeholder for future versions)
scoreRaw = base + volBonus + htfBonus + trendBonus + macdBonus
SCORE = DIR ≥ 0 ? scoreRaw : −scoreRaw
If Require Volume Confirmation and VOL ≤ 1.0 ⇒ SCORE = 0.
ACT:
🔥 if |SCORE| ≥ threshold
👀 if 50 < |SCORE| < threshold
⏳ otherwise
Practical examples
Strong long (trend + participation)
DIR = ↑, ROC% = +3.2, MOM ≈ 32, VOL = 1.9, STACK = Bull, HTF = ▲, REV = 🟢
SCORE: base(12.8) + volBonus(20) + htfBonus(30) + trend(10) ≈ 73 → ACT = 🔥
Action idea: look for longs on pullbacks; confirm risk with ATR%.
Weak long (no volume)
DIR = ↑, ROC% = +1.0, but VOL = 0.8 and Require Volume Confirmation = ON
SCORE forced to 0 → ACT = ⏳
Action: wait for volume > 1.0 or turn off confirmation knowingly.
Bearish reversal warning
DIR = →, REV = 🔴 (bearish engulfing), RSI = 68, HTF = ▼
SCORE may be mid-range; ACT = 👀
Action: watch for breakdown and rising VOL.
Alerts (how to use)
The script calls alert() whenever |SCORE| ≥ Action threshold.
To receive pop-ups, sounds, or emails: click “⏰ Alerts” in TradingView, choose this indicator, and pick “Any alert() function call.”
The alert message includes: symbol, |SCORE|, DIR.
Layout, Size, and Corner tips
Row is best when you want a compact status ribbon across the top.
Grid is clearer on big screens or when you enable many columns.
Size:
Mobile = one pair per row (tall, readable)
Micro/Small = dense; good for many fields
Large = presentation/screenshots
Corner: If the table overlaps price, change the corner or set Opaque Background = OFF.
Repaint & timeframe behavior
Default smart update prefers stability (last bar / live / confirmed history).
For a stricter, “close-only” behavior (less repaint): turn Update Every Bar = OFF and avoid Heikin Ashi when you want raw market OHLC (HA modifies price inputs).
HTF logic is derived from a clean, integer multiple of your chart timeframe (via multiplier). It works with 3H/4H and any TF.
Performance notes
The script analyzes one symbol (chart or override) with multiple metrics using efficient tuple requests.
If you later want a multi-symbol grid, do it with pages (10–15 per page + rotate) to stay within platform limits (recommended future add-on).
Troubleshooting
No table visible
Ensure the indicator is added and not hidden.
Try toggling Opaque Background or switch Corner (it might be behind other drawings).
Keep Columns count reasonable for the chosen Size.
If you turned ON Override, verify the Custom symbol exists on your data provider.
Numbers look different on HA candles
Heikin Ashi modifies OHLC; switch to regular candles if you need raw price metrics.
3H/4H issues
Use integer HTF Multiplier (e.g., 2, 4). The tool builds the correct string internally; no manual timeframe strings needed.
Power user tips
Volume gating: keeping Require Volume Confirmation = ON filters most fake moves; if you’re a scalper, reduce strictness or turn it off.
Action threshold: 60–80 is typical. Higher = fewer but stronger signals.
Benchmark RS%: great for spotting leaders/laggards; positive RS% = outperformance vs benchmark.
Change policy & safety
This version doesn’t alter your historical logic you tested (no radical changes).
Any future “radical” change (score weights, HTF logic, UI hiding data) will ship with a toggle and an Impact Statement so you can keep old behavior if you prefer.
Glossary (quick)
ROC%: Percent change over N bars.
MOM: Scaled momentum (0–100).
VOL ratio: Volume vs 20-bar average.
ATR%: ATR as % of price.
ADX/DI: Trend strength / direction components (Wilder).
EMA stack: Relationship between EMAs (bullish/bearish/flat).
VWAP%: Premium/discount to VWAP.
RS%: Relative strength vs benchmark.

Higher High Close 3 Days & Price ±5% 200 EMAScript by Raj Natarajan V 1
This script identifies stocks that are within +/- 5% of the 200 day EMA and within that sub-set, it identifies stocks that have had three consecutive days of higher highs.

Close Just Above 44MA with Uptrendpine editor code for indicator to identify stocks whose price closes just above MA 44 with MA 44 trending up on a daily chart for swing trading

My ScriptMulti-Timeframe Momentum Sync - 1 line
1,5,15 averaged into 1 line, WHY?
"YNOT", my boat's name.
Seems responsive and sensitive, no lag, this is just the beginning.
Smart Wick AnalyzerSmart Wick Analyzer (SWA)
Purpose: Highlight potential liquidity‑grab candles (long wicks) and turn them into actionable, rule‑based buy/sell signals with trend, volume, and cooldown filters.
Type: Indicator (not a strategy). Educational tool to contextualize wick events.
🧠 What This Script Does
SWA looks for candles where the wick is large relative to its body—a common signature of liquidity sweeps / rejection. It then adds three confirmations before marking a trade signal:
1. Wick Event
• Upper‑wick event (possible rejection from above)
• Lower‑wick event (possible rejection from below)
• Condition: wick length > body × Wick‑to‑Body Ratio
2. Context Filters
• Trend filter : closing price vs. SMA of lookbackBars
• Volume filter : current volume vs. average volume × volumeThreshold
3. Signal Hygiene
• Cooldown : prevents clustering; a minimum number of bars must pass before a new signal is allowed.
If a candle passes these checks:
• Buy Signal (triangle up): long lower wick + price above SMA + relative‑high volume + cooldown passed
• Sell Signal (triangle down): long upper wick + price below SMA + relative‑high volume + cooldown passed
The signal candle is also bar‑colored black for quick visual focus.
⸻
✳️ What the Dotted Lines Mean (including the green one)
On every signal bar the script draws two dotted horizontal levels, extended to the right:
• Open line of the signal candle
• Close line of the signal candle
• They use the signal color: green for Buy, red for Sell.
How to interpret (example: green = Buy signal):
• The green dotted close line represents the momentum validation level. If subsequent candles close above this line, it indicates follow‑through after the wick rejection (buyers defended into the close).
• The green dotted open line is a risk context / invalidation reference. If price falls back below it soon after the signal, the wick event may have failed or devolved into chop.
In your annotated chart: the candle initially looked constructive (“closing above could be positive momentum”), but later price failed and rotated down—hence a sell signal interpreted when an upper‑wick event occurred under down‑trend conditions.
⸻
⚙️ Inputs & What They Control
• Wick‑to‑Body Ratio (wickThreshold): how “extreme” a wick must be to count as a liquidity‑grab.
• Lookback Period (lookbackBars):
• SMA period for trend context
• Volume MA for relative‑volume check
• Volume Multiplier (volumeThreshold): strengthens/loosens volume confirmation.
• Cooldown Bars (cooldownBars): minimum spacing between consecutive signals.
• Enable Alerts (showAlerts): turns on alert conditions.
⸻
🔔 Alerts (exact titles)
• “SWA Buy Alert” — potential reversal / Buy signal detected
• “SWA Sell Alert” — potential reversal / Sell signal detected
⸻
📌 How to Use (practical guide)
1. Scan for the black‑colored signal candle and its dotted lines.
2. For Buy signals (green): Prefer continuation if price closes above the green close line within the next few bars. Manage risk using the open line or your own level.
3. For Sell signals (red): Prefer continuation if price closes below the red close line.
4. Avoid chasing during low‑volume / counter‑trend signals; the filters help, but structure (HTF trend, S/R, session context) still matters.
5. Use the cooldown to reduce noise on fast time frames.
⸻
✅ Why This Isn’t Just “Another Wick Indicator”
• The script does not flag every long‑wick; it requires trend alignment and relative volume to suggest participation.
• The two reference lines (open/close) provide post‑signal state tracking—a simple, visual framework to judge follow‑through vs. failure without additional tools.
• Cooldown logic discourages clustered, low‑quality repeats around the same zone.
⸻
⚠️ Notes & Limitations
• Works across markets/time frames, but wick behavior varies by instrument and session. Parameters may need adjustment.
• Signals are contextual, not guarantees. Consolidation and news spikes can invalidate wick reads.
• This indicator is not a strategy; it does not backtest performance on its own.
⸻
📄 Disclaimer
This tool is for educational purposes only and should be combined with personal analysis and risk management. Markets are uncertain; past behavior does not guarantee future results.

EFXU Banker Level Price GridThe EFXU Banker Level Price Grid indicator draws fixed horizontal price levels at key whole-number intervals for Forex pairs, regardless of zoom level or timeframe. It’s designed for traders who want consistent visual reference points for major and minor price zones across all charts.
Features:
Major 1000-pip zones (bold lines) above and below a fixed origin price (auto-detects 1.00000 for non-JPY pairs and 100.000 for JPY pairs, or set manually).
500-pip median levels (dashed lines) between each major zone.
100-pip subdivisions (dotted lines) within each 1000-pip zone.
Adjustable number of zones above and below the origin.
Customizable colors, line widths, and label sizes.
Optional labels on the right edge for quick zone identification.
Works on all timeframes and stays visible regardless of zoom or price position.
Use case:
This tool is ideal for traders using institutional-level zones, psychological price levels, or “big money” areas for planning entries, exits, and risk management. Perfect for swing traders, position traders, and scalpers who rely on major pip milestones for market structure context.

ATR x2 AUTODescription:
This indicator automatically plots ATR-based horizontal levels for each of the most recent candles, helping traders visualize potential stop-loss hunting zones, breakout areas, or price reaction points.
It works by taking the Average True Range (ATR) over a customizable period and multiplying it by a user-defined factor (default: ×2). For each of the last N candles (default: 5), it calculates and draws:
Below green candles (bullish) → A horizontal line placed ATR × multiplier below the candle’s low.
Above red candles (bearish) → A horizontal line placed ATR × multiplier above the candle’s high.
Doji candles → No line is drawn.
Each line extends to the right indefinitely, allowing traders to monitor how price reacts when returning to these ATR-based levels. This makes the tool useful for:
Identifying likely stop-loss clusters below bullish candles or above bearish candles.
Anticipating liquidity sweeps and fakeouts.
Supporting breakout or reversal strategies.
Key Features:
Customizable ATR length, multiplier, number of recent candles, and line thickness.
Separate colors for bullish and bearish candle levels.
Automatic real-time updates for each new bar.
Clean overlay on the main price chart.
Inputs:
ATR Length → Period used for ATR calculation.
Multiplier → Factor applied to the ATR distance.
Number of Candles → How many recent candles to track.
Line Thickness and Colors → Full visual customization.
Usage Tip:
These levels can be combined with key market structure points such as support/resistance, trendlines, or the 200 EMA to anticipate high-probability price reactions.

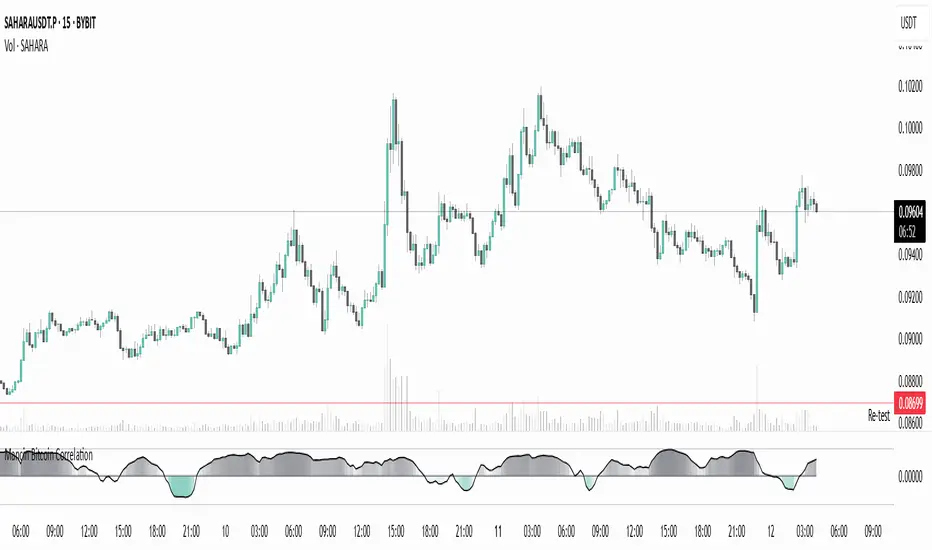
Mancin Bitcoin CorrelationMancin Bitcoin Correlation
This indicator calculates the correlation coefficient between a selected asset and Bitcoin (default: BYBIT:BTCUSDT) over a specified period, and visualizes it as a line or columns with a dynamic color gradient.
Features:
Correlation values range from -1 (inverse relationship) to +1 (strong direct relationship).
Gradient fill changes intensity based on correlation strength:
Positive correlation uses the “high correlation” color.
Negative correlation uses the “low correlation” color.
Fully customizable:
Colors for positive and negative correlation.
Base transparency.
Gradient strength (sensitivity of transparency to correlation changes).
Correlation length.
Line style and color (Line or Columns).
Use cases:
Track how closely your asset moves with Bitcoin.
Spot moments when the asset starts moving in sync or diverging from BTC.
Useful for pair trading, arbitrage strategies, and assessing BTC’s market influence.
Daily 6 AM & 8 AM CST Linesit help so you can figure out 6am and 8am on cst time in americas very fast.

Apex Edge – Liquidity RaiderApex Edge – Liquidity Raider
The Predator That Hunts Where Retail Never Looks
The Liquidity Raider is not your average liquidity line plotter.
This is an institutional-grade hunting system that tracks the pools of liquidity Smart Money algos stalk — and tells you exactly when price is circling in for the strike.
Where most retail tools simply mark lines, this one acts like a predator:
Scans the chart dynamically to detect clustered highs & lows (pivot-based liquidity zones).
Filters noise with sensitivity & price rounding so you only get real liquidity levels — not every random swing.
Plots live BSL (Buy-Side Liquidity) & SSL (Sell-Side Liquidity) lines in clean dotted format.
Auto-deletes levels when swept, so your chart stays clean and focused.
Triggers directional arrows when price comes within your specified % distance to the target liquidity pool — before the market moves.
EMA confluence layer lets you align with institutional flow (customizable Fast & Slow EMAs).
Core Power
Cluster Logic – Finds high-probability liquidity zones using repeated pivot levels.
Sweep Awareness – Lines vanish the moment liquidity is taken, keeping focus on the next pool.
Proximity Strike Detection – Arrow signals only when price is within striking range.
Directional Clarity – Red arrows = targeting BSL, Green arrows = targeting SSL.
Scalable Across Timeframes – Adapts to your chart’s timeframe with dynamic lookback scaling.
Institutional Flow Filter – Optional EMA confirmation keeps you aligned with the real trend.
How to Use
Identify liquidity pools – Dotted green = buy-side, dotted red = sell-side.
Watch proximity arrows – These mean price is in range and hunting that pool.
Align with EMA bias – Enter only in the direction of institutional momentum.
Target the sweep – Your take profit is where the liquidity is resting.
Why Liquidity Raider Wins
This is not a lagging signal system.
It’s a real-time, clean, predictive tool designed to mimic the targeting logic of high-frequency algos.
By removing swept levels and focusing only on the next available pools, Liquidity Raider keeps you one step ahead of the crowd — and perfectly positioned for the kill shot.

Dip Hunter [BackQuant]Dip Hunter
What this tool does in plain language
Dip Hunter is a pullback detector designed to find high quality buy-the-dip opportunities inside healthy trends and to avoid random knife catches. It watches for a quick drop from a recent high, checks that the drop happened with meaningful participation and volatility, verifies short-term weakness inside a larger uptrend, then scores the setup and paints the chart so you can act with confidence. It also draws clean entry lines, provides a meter that shows dip strength at a glance, and ships with alerts that match common execution workflows.
How Dip Hunter thinks
It defines a recent swing reference, measures how far price has dipped off that high, and only looks at candidates that meet your minimum percentage drop.
It confirms the dip with real activity by requiring a volume spike and a volatility spike.
It checks structure with two EMAs. Price should be weak in the short term while the larger context remains constructive.
It optionally requires a higher-timeframe trend to be up so you focus on pullbacks in trending markets.
It bundles those checks into a score and shows you the score on the candles and on a gradient meter.
When everything lines up it paints a green triangle below the bar, shades the background, and (if you wish) draws a horizontal entry line at your chosen level.
Inputs and what they mean
Dip Hunter Settings
• Vol Lookback and Vol Spike : The script computes an average volume over the lookback window and flags a spike when current volume is a multiple of that average. A multiplier of 2.0 means today’s volume must be at least double the average. This helps filter noise and focuses on dips that other traders actually traded.
• Fast EMA and Slow EMA : Short-term and medium-term structure references. A dip is more credible if price closes below the fast EMA while the fast EMA is still below the slow EMA during the pullback. That is classic corrective behavior inside a larger trend.
• Price Smooth : Optional smoothing length for price-derived series. Use this if you trade very noisy assets or low timeframes.
• Volatility Len and Vol Spike (volatility) : The script checks both standard deviation and true range against their own averages. If either expands beyond your multiplier the market confirms the move with range.
• Dip % and Lookback Bars : The engine finds the highest high over the lookback window, then computes the percentage drawdown from that high to the current close. Only dips larger than your threshold qualify.
Trend Filter
• Enable Trend Filter : When on, Dip Hunter will only trigger if the market is in an uptrend.
• Trend EMA Period : The longer EMA that defines the session’s backbone trend.
• Minimum Trend Strength : A small positive slope requirement. In practice this means the trend EMA should be rising, and price should be above it. You can raise the value to be more selective.
Entries
• Show Entry Lines : Draws a horizontal guide from the signal bar for a fixed number of bars. Great for limit orders, scaling, or re-tests.
• Line Length (bars) : How far the entry guide extends.
• Min Gap (bars) : Suppresses new entry lines if another dip fired recently. Prevents clutter during choppy sequences.
• Entry Price : Choose the line level. “Low” anchors at the signal candle’s low. “Close” anchors at the signal close. “Dip % Level” anchors at the theoretical level defined by recent_high × (1 − dip%). This lets you work resting orders at a consistent discount.
Heat / Meter
• Color Bars by Score : Colors each candle using a red→white→green gradient. Red is overheated, green is prime dip territory, white is neutral.
• Show Meter Table : Adds a compact gradient strip with a pointer that tracks the current score.
• Meter Cells and Meter Position : Resolution and placement of the meter.
UI Settings
• Show Dip Signals : Plots green triangles under qualifying bars and tints the background very lightly.
• Show EMAs : Plots fast, slow, and the trend EMA (if the trend filter is enabled).
• Bullish, Bearish, Neutral colors : Theme controls for shapes, fills, and bar painting.
Core calculations explained simply
Recent high and dip percent
The script finds the highest high over Lookback Bars , calls it “recent high,” then calculates:
dip% = (recent_high − close) ÷ recent_high × 100.
If dip% is larger than Dip % , condition one passes.
Volume confirmation
It computes a simple moving average of volume over Vol Lookback . If current volume ÷ average volume > Vol Spike , we have a participation spike. It also checks 5-bar ROC of volume. If ROC > 50 the spike is forceful. This gets an extra score point.
Volatility confirmation
Two independent checks:
• Standard deviation of closes vs its own average.
• True range vs ATR.
If either expands beyond Vol Spike (volatility) the move has range. This prevents false triggers from quiet drifts.
Short-term structure
Price should close below the Fast EMA and the fast EMA should be below the Slow EMA at the moment of the dip. That is the anatomy of a pullback rather than a full breakdown.
Macro trend context (optional)
When Enable Trend Filter is on, the Trend EMA must be rising and price must be above it. The logic prefers “micro weakness inside macro strength” which is the highest probability pattern for buying dips.
Signal formation
A valid dip requires:
• dip% > threshold
• volume spike true
• volatility spike true
• close below fast EMA
• fast EMA below slow EMA
If the trend filter is enabled, a rising trend EMA with price above it is also required. When all true, the triangle prints, the background tints, and optional entry lines are drawn.
Scoring and visuals
Binary checks into a continuous score
Each component contributes to a score between 0 and 1. The script then rescales to a centered range (−50 to +50).
• Low or negative scores imply “overheated” conditions and are shaded toward red.
• High positive scores imply “ripe for a dip buy” conditions and are shaded toward green.
• The gradient meter repeats the same logic, with a pointer so you can read the state quickly.
Bar coloring
If you enable “Color Bars by Score,” each candle inherits the gradient. This makes sequences obvious. Red clusters warn you not to buy. White means neutral. Increasing green suggests the pullback is maturing.
EMAs and the trend EMA
• Fast EMA turns down relative to the slow EMA inside the pullback.
• Trend EMA stays rising and above price once the dip exhausts, which is your cue to focus on long setups rather than bottom fishing in downtrends.
Entry lines
When a fresh signal fires and no other signal happened within Min Gap (bars) , the indicator draws a horizontal level for Line Length bars. Use these lines for limit entries at the low, at the close, or at the defined dip-percent level. This keeps your plan consistent across instruments.
Alerts and what they mean
• Market Overheated : Score is deeply negative. Do not chase. Wait for green.
• Close To A Dip : Score has reached a healthy level but the full signal did not trigger yet. Prepare orders.
• Dip Confirmed : First bar of a fresh validated dip. This is the most direct entry alert.
• Dip Active : The dip condition remains valid. You can scale in on re-tests.
• Dip Fading : Score crosses below 0.5 from above. Momentum of the setup is fading. Tighten stops or take partials.
• Trend Blocked Signal : All dip conditions passed but the trend filter is offside. Either reduce risk or skip, depending on your plan.
How to trade with Dip Hunter
Classic pullback in uptrend
Turn on the trend filter.
Watch for a Dip Confirmed alert with green triangle.
Use the entry line at “Dip % Level” to stage a limit order. This keeps your entries consistent across assets and timeframes.
Initial stop under the signal bar’s low or under the next lower EMA band.
First target at prior swing high, second target at a multiple of risk.
If you use partials, trail the remainder under the fast EMA once price reclaims it.
Aggressive intraday scalps
Lower Dip % and Lookback Bars so you catch shallow flags.
Keep Vol Spike meaningful so you only trade when participation appears.
Take quick partials when price reclaims the fast EMA, then exit on Dip Fading if momentum stalls.
Counter-trend probes
Disable the trend filter if you intentionally hunt reflex bounces in downtrends.
Require strong volume and volatility confirmation.
Use smaller size and faster targets. The meter should move quickly from red toward white and then green. If it does not, step aside.
Risk management templates
Stops
• Conservative: below the entry line minus a small buffer or below the signal bar’s low.
• Structural: below the slow EMA if you aim for swing continuation.
• Time stop: if price does not reclaim the fast EMA within N bars, exit.
Position sizing
Use the distance between the entry line and your structural stop to size consistently. The script’s entry lines make this distance obvious.
Scaling
• Scale at the entry line first touch.
• Add only if the meter stays green and price reclaims the fast EMA.
• Stop adding on a Dip Fading alert.
Tuning guide by market and timeframe
Equities daily
• Dip %: 1.5 to 3.0
• Lookback Bars: 5 to 10
• Vol Spike: 1.5 to 2.5
• Volatility Len: 14 to 20
• Trend EMA: 100 or 200
• Keep trend filter on for a cleaner list.
Futures and FX intraday
• Dip %: 0.4 to 1.2
• Lookback Bars: 3 to 7
• Vol Spike: 1.8 to 3.0
• Volatility Len: 10 to 14
• Use Min Gap to avoid clusters during news.
Crypto
• Dip %: 3.0 to 6.0 for majors on higher timeframes, lower on 15m to 1h
• Lookback Bars: 5 to 12
• Vol Spike: 1.8 to 3.0
• ATR and stdev checks help in erratic sessions.
Reading the chart at a glance
• Green triangle below the bar: a validated dip.
• Light green background: the current bar meets the full condition.
• Bar gradient: red is overheated, white is neutral, green is dip-friendly.
• EMAs: fast below slow during the pullback, then reclaim fast EMA on the bounce for quality continuation.
• Trend EMA: a rising spine when the filter is on.
• Entry line: a fixed level to anchor orders and risk.
• Meter pointer: right side toward “Dip” means conditions are maturing.
Why this combination reduces false positives
Any single criterion will trigger too often. Dip Hunter demands a dip off a recent high plus a volume surge plus a volatility expansion plus corrective EMA structure. Optional trend alignment pushes odds further in your favor. The score and meter visualize how many of these boxes you are actually ticking, which is more reliable than a binary dot.
Limitations and practical tips
• Thin or illiquid symbols can spoof volume spikes. Use larger Vol Lookback or raise Vol Spike .
• Sideways markets will show frequent small dips. Increase Dip % or keep the trend filter on.
• News candles can blow through entry lines. Widen stops or skip around known events.
• If you see many back-to-back triangles, raise Min Gap to keep only the best setups.
Quick setup recipes
• Clean swing trader: Trend filter on, Dip % 2.0 to 3.0, Vol Spike 2.0, Volatility Len 14, Fast 20 EMA, Slow 50 EMA, Trend 100 EMA.
• Fast intraday scalper: Trend filter off, Dip % 0.7 to 1.0, Vol Spike 2.5, Volatility Len 10, Fast 9 EMA, Slow 21 EMA, Min Gap 10 bars.
• Crypto swing: Trend filter on, Dip % 4.0, Vol Spike 2.0, Volatility Len 14, Fast 20 EMA, Slow 50 EMA, Trend 200 EMA.
Summary
Dip Hunter is a focused pullback engine. It quantifies a real dip off a recent high, validates it with volume and volatility expansion, enforces corrective structure with EMAs, and optionally restricts signals to an uptrend. The score, bar gradient, and meter make reading conditions instant. Entry lines and alerts turn that read into an executable plan. Tune the thresholds to your market and timeframe, then let the tool keep you patient in red, selective in white, and decisive in green.

Linh's Anomaly Radar v2What this script does
It’s an event detector for price/volume anomalies that often precede or confirm moves.
It watches a bunch of patterns (Wyckoff tests, squeezes, failed breakouts, turnover bursts, etc.), applies robust z-scores, optional trend filters, cooldowns (to avoid spam), and then fires:
A shape/label on the bar,
A row in the mini panel (top-right),
A ready-made alertcondition you can hook into.
How to add & set up (TradingView)
Paste the script → Save → Add to chart on Daily first (works on any TF).
Open Settings → Inputs:
General
• Use Robust Z (MAD): more outlier-resistant; keep on.
• Z Lookback: 60 bars is ~3 months; bump to 120 for slower regimes.
• Cooldown: min bars to wait before the same signal can fire again (default 5).
• Use trend filter: if on, “bullish” signals only fire above SMA(tfLen), “bearish” below.
Thresholds: fine-tune sensitivity (defaults are sane).
To create alerts: Right-click chart → Add alert
Condition: Linh’s Anomaly Radar v2 → choose a specific signal or Composite (Σ).
Options: “Once per bar close” (recommended).
Customize message if you want ticker/timeframe in your phone push.
The mini panel (top-right)
Signal column: short code (see cheat sheet below).
Fired column: a dot “•” means that on the latest bar this signal fired.
Score (right column): total count of signals that fired this bar.
Σ≥N shows your composite threshold (how many must fire to trigger the “Composite” alert).
Shapes & codes (what’s what)
Code Name (category) What it’s looking for Why it matters
STL Stealth Volume z(volume)>5 & ** z(return)
EVR Effort vs Result squeeze z(vol)>3 & z(TR)<−0.5 Heavy effort, tiny spread → absorption
TGV Tight+Heavy (HL/ATR)<0.6 & z(vol)>3 Tight bar + heavy tape → pro activity
CLS Accumulation cluster ≥3 of last 5 bars: up, vol↑, close near high Classic accumulation footprint
GAP Open drive failure Big gap not filled (≥80%) & vol↑ One-sided open stalls → fade risk
BB↑ BB squeeze breakout Squeeze (z(BBWidth)<−1.3) → close > upperBB & vol↑ Regime shift with confirmation
ER↑ Effort→Result inversion Down day on vol then next bar > prior high Demand overwhelms supply
OBV OBV divergence OBV slope up & ** z(ret20)
WER Wide Effort, Opposite Result z(vol)>3, close+1 Selling into strength / distribution
NS No-Supply (Wyckoff) Down bar, HL<0.6·ATR, vol << avg Sellers absent into weakness
ND No-Demand (Wyckoff) Up bar, HL<0.6·ATR, vol << avg Buyers absent into strength
VAC Liquidity Vacuum z(vol)<−1.5 & ** z(ret)
UTD UTAD (failed breakout) Breaks swing-high, closes back below, vol↑ Stop-run, reversal risk
SPR Spring (failed breakdown) Breaks swing-low, closes back above, vol↑ Bear trap, reversal risk
PIV Pocket Pivot Up bar; vol > max down-vol in lookback Quiet base → sudden demand
NR7 Narrow Range 7 + Vol HL is 7-bar low & z(vol)>2 Coiled spring with participation
52W 52-wk breakout quality New 52-wk close high + squeeze + vol↑ High-quality breakouts
VvK Vol-of-Vol kink z(ATR20,200)>0.5 & z(ATR5,60)<0 Long-vol wakes up, short-vol compresses
TAC Turnover acceleration SMA3 vol / SMA20 vol > 1.8 & muted return Participation surging before move
RBd RSI Bullish div Price LL, RSI HL, vol z>1 Exhaustion of sellers
RS↑ RSI Bearish div Price HH, RSI LH, vol z>1 Exhaustion of buyers
Σ Composite Count of all fired signals ≥ threshold High-conviction bar
Placement:
Triangles up (below bar) → bullish-leaning events.
Triangles down (above bar) → bearish-leaning events.
Circles → neutral context (VAC, VvK, Composite).
Key inputs (quick reference)
General
Use Robust Z (MAD): keep on for noisy tickers.
Z Lookback (lenZ): 60 default; 120 if you want fewer alerts.
Trend filter: when on, bullish signals require close > SMA(tfLen), bearish require <.
Cooldown: prevents repeated firing of the same signal within N bars.
Phase-1 thresholds (core)
Stealth: vol z > 5, |ret z| < 1.
EVR: vol z > 3, TR z < −0.5.
Tight+Heavy: (HL/ATR) < 0.6, vol z > 3.
Cluster: window=5, min=3 strong bars.
GapFail: gap/ATR ≥1.5, fill <80%, vol z > 2.
BB Squeeze: z(BBWidth)<−1.3 then breakout with vol z > 2.
Eff→Res Up: prev bar heavy down → current bar > prior high.
OBV Div: OBV uptrend + |z(ret20)|<0.3.
Phase-2 thresholds (extras)
WER: vol z > 3, close1.
No-Supply/No-Demand: tight bar & very light volume vs SMA20.
Vacuum: vol z < −1.5, |ret z|>1.5.
UTAD/Spring: swing lookback N (default 20), vol z > 2.
Pocket Pivot: lookback for prior down-vol max (default 10).
NR7: 7-bar narrowest range + vol z > 2.
52W Quality: new 52-wk high + squeeze + vol z > 2.
VoV Kink: z(ATR20,200)>0.5 AND z(ATR5,60)<0.
Turnover Accel: SMA3/SMA20 > 1.8 and |ret z|<1.
RSI Divergences: compare to n bars back (default 14).
How to use it (playbooks)
A) Daily scan workflow
Run on Daily for your VN watchlist.
Turn Composite (Σ) alert on with Σ≥2 or ≥3 to reduce noise.
When a bar fires Σ (or a fav combo like STL + BB↑), drop to 60-min to time entries.
B) Breakout quality check
Look for 52W together with BB↑, TAC, and OBV.
If WER/ND appear near highs → downgrade the breakout.
C) Spring/UTAD reversals
If SPR fires near major support and RBd confirms → long bias with stop below spring low.
If UTD + WER/RS↑ near resistance → short/fade with stop above UTAD high.
D) Accumulation basing
During bases, you want CLS, OBV, TGV, STL, NR7.
A pocket pivot (PIV) can be your early add; manage risk below base lows.
Tuning tips
Too many signals? Raise stealthVolZ to 5.5–6, evrVolZ to 3.5, use Σ≥3.
Fast movers? Lower bbwZthr to −1.0 (less strict squeeze), keep trend filter on.
Illiquid tickers? Keep MAD z-scores on, increase lookbacks (e.g., lenZ=120).
Limitations & good habits
First lenZ bars on a new symbol are less reliable (incomplete z-window).
Some ideas (VWAP magnet, close auction spikes, ETF/foreign flows, options skew) need intraday/external feeds — not included here.
Pine can’t “screen” across the whole market; set alerts or cycle your watchlist.
Quick troubleshooting
Compilation errors: make sure you’re on Pine v6; don’t nest functions in if blocks; each var int must be declared on its own line.
No shapes firing: check trend filter (maybe price is below SMA and you’re waiting for bullish signals), and verify thresholds aren’t too strict.

VN30 Effort-vs-Result Multi-Scanner — LinhVN30 Effort-vs-Result Multi-Scanner (Pine v5)
Cross-section scanner for Vietnam’s VN30 stocks that surfaces Effort vs Result footprints and related accumulation/distribution and volatility tells. It renders a ranked table (Top-N) with per-ticker signals and key metrics.
What it does
Scans up to 30 tickers (editable input.symbol slots) using one security() call per symbol → stays under Pine’s 40-call limit and runs reliably on any chart.
Scores each ticker by counting active signals, then ranks and lists the top names.
Optional metrics columns: zVol(60), zTR(60), ATR(20), HL/ATR(20).
Signals (toggleable)
Price/Volume – Effort vs Result
EVR Squeeze (stealth): z(Vol,60) > 4 & z(TR,60) < −0.5
5σ Vol, ≤1σ Ret: z(Vol,60) > 5 & |z(Return,60)| < 1
Wide Effort, Opposite Result: z(Vol,60) > 3 & close < open & z(CLV×Vol,60) > 1
Spread Compression, Heavy Tape: (H−L)/ATR(20) < 0.6 & z(Vol,60) > 3
No-Supply / No-Demand: close < close & range < 0.6×ATR(20) & vol < 0.5×SMA(20)
Momentum & Volatility
Vol-of-Vol Kink: z(ATR20,200) rising & z(ATR5,60) falling
BB Squeeze → Expansion: BBWidth(20) in low regime (z<−1.3) then close > upper band & z(Vol,60) > 2
RSI Non-Confirmation: Price LL/HH with RSI HL/LH & z(Vol,60) > 1
Accumulation/Distribution
OBV Divergence w/ Flat Price: OBV slope > 0 & |z(ret20,260)| < 0.3
Accumulation Days Cluster: ≥3/5 bars: up close, higher vol, close near high
Effort-Result Inversion (Down): big vol on down day then next day close > prior high
How to use
Set the timeframe (works best on 1D for EOD scans).
Edit the 30 symbol slots to your VN30 constituents.
Choose Top N, toggle Show metrics/Only matches and enable/disable scenarios.
Read the table: Rank, Ticker, (metrics), Score, and comma-separated Signals fired.
Method notes
Z-scores use a population-std estimate; CLV×Vol is used for effort/location.
Rolling counts avoid ta.sum; OBV is computed manually; all logic is Pine v5-safe.
Intraday-only ideas (true VWAP magnets, auction volume, flows, futures/options) are not included—Pine can’t cross-scan those datasets.
Disclaimer: Educational tool, not financial advice. Always confirm signals on the chart and with your process.

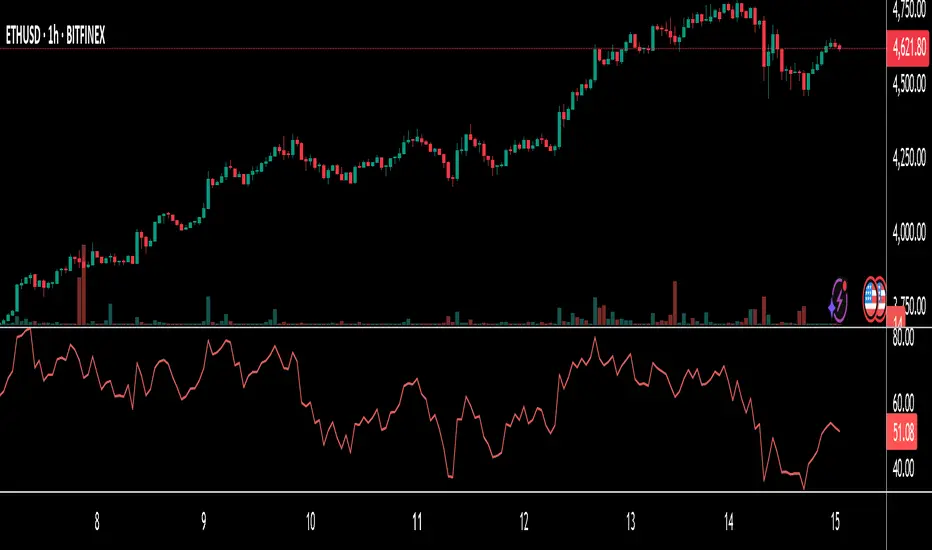
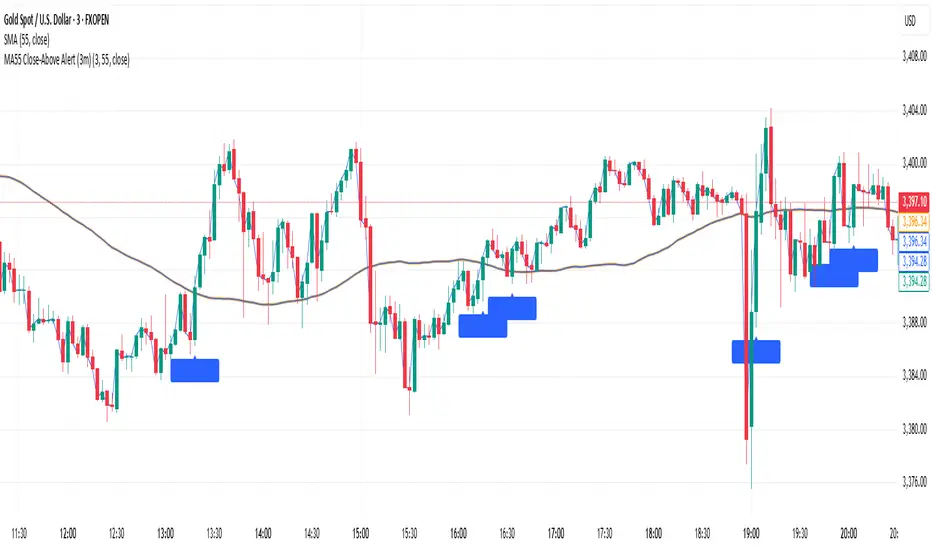
Gold MA55 Close-Above Alert (3m)This is a gold strategy where we can analyse price closing above and enters into trade.
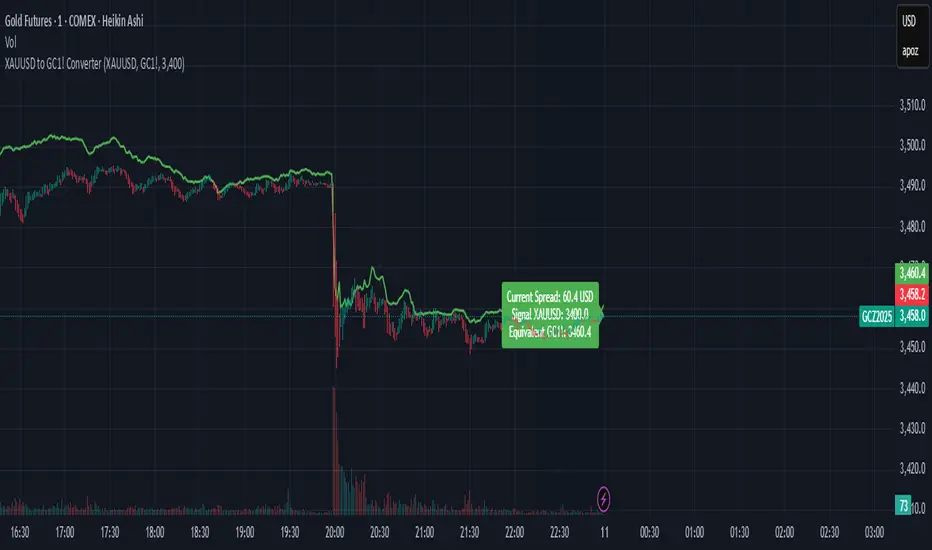
XAUUSD to GC1! ConverterThis simple utility indicator compares the spot gold price (XAUUSD) with the COMEX gold futures contract (GC1!).
It calculates the current spread between the two instruments and allows you to input a signal price on XAUUSD to instantly see the equivalent price on GC1!.
Perfect for traders who receive alerts on spot gold but execute on futures, ensuring seamless price adaptation.
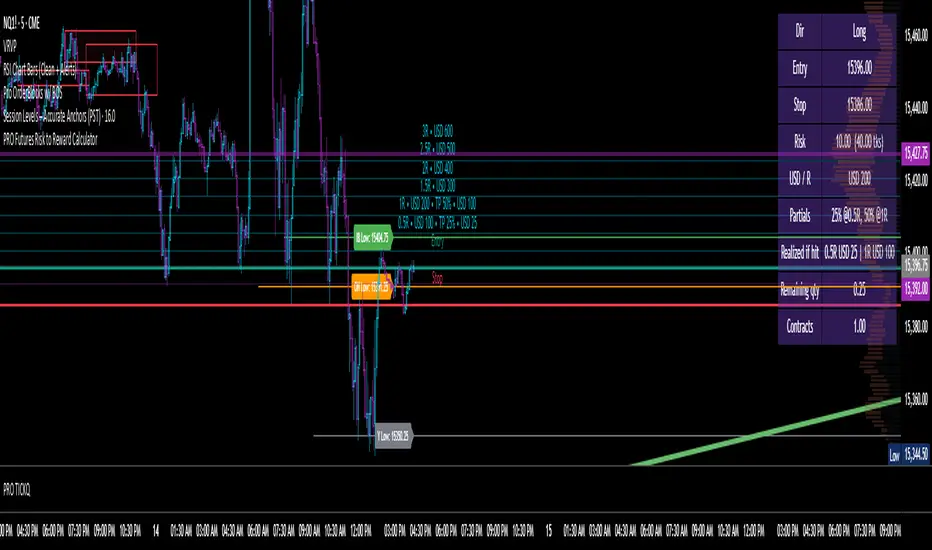
Futures Risk to Reward CalculatorFutures Risk to Reward Calculator with NQ, MNQ, ES, MES, etc price per tick built in.