Combined MTF Camarilla Pivots (HA + Candles)This is a fairly basic (but hopefully useful) indicator that combines three time-frames of Camarilla pivots into one.
Default time-frames are:
Weekly
Monthly
Yearly
Time-frames can be modified as you wish, they are just set to these as I generally only trade higher intervals (just note that formatting labels will not change - but you can update these as needed).
The Camarilla pivots displayed are as follows:
R3, R4, R5, R6
Pivot line (Middle/Base)
S3, S4, S5, S6
R1/S1 & R2/S2 are excluded to make way for R5/S5 & R6/S6 - as these are more useful for the majority of traders. The formula for levels 5/6 are always up for debate, as no official formula has ever been released. I've used what I consider a mid, or consensus calculation.
By default all historical pivot levels are displayed, as there can be some benefit to mapping these forward once the relevant period has ended. If people find it's too cluttered I'll look into having an option to display the current period only.
Unfortunately, TradingView doesn't allow labels on plots (seems like such a basic feature to be missing, but there you go), so you'll have to learn the colours/linewidths.
Oh, and there's a checkbox to enable pivots to be calculated on Heiken-Ashi prices/candles rather than default prices/candles. This heavily modifies the location of the Camarilla Pivots, but I've found that in certain situations you can get some great results.
Let me know your thoughts/comments/suggestions.
Cheers
DD
Pivotsupport


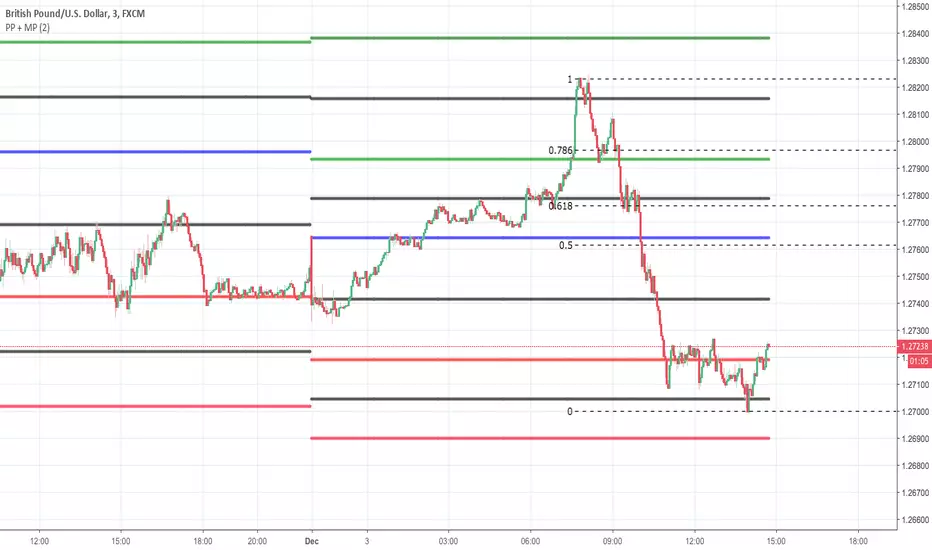
Pivot Point + MidPointsTraditional floor pivots with additional lines in between the s/r levels called Mid Points
If the Pivot Points are used as entering at s/r levels, you can use the Mid Points to scale out of a position or place Sl's behind
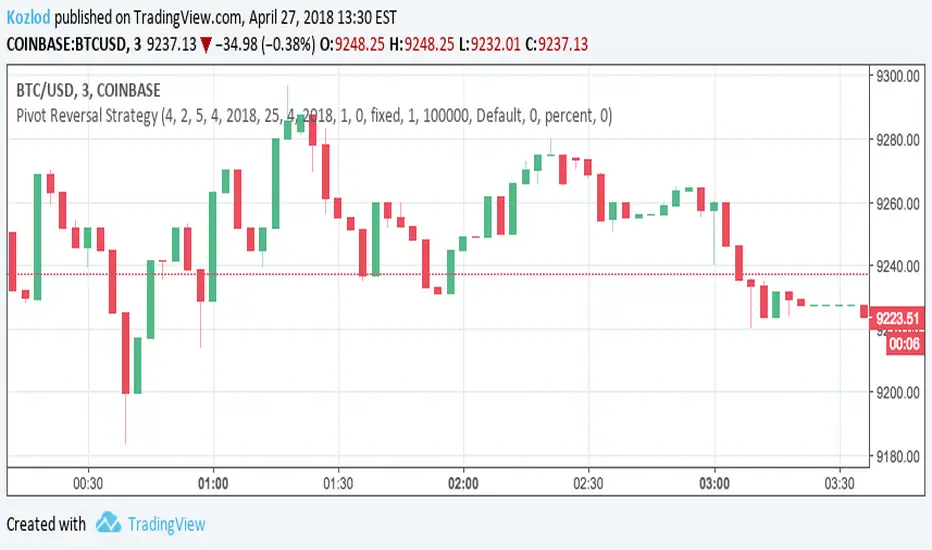
Pivot Reversal Strategy with backtest date rangeThis is standard Pivot Reversal Strategy with backtest date range added.
In parameters you can select from/to date for backtesting range.

Auto DayWeekMonth Fib Levels R2 by JustUncleLThis indicator automatically draws up to Three Sets of Fibonacci Pivot levels based on the previous Candle period's Range (High-Low). The HLC3 is used as the default Pivotal level. Only the most Recent period Candle Levels are displayed. The longer Weekly and Monthly sets are particularly useful in finding long term Supply and Demand levels.
The three sets of selectable periods are spit into the following sets:
Daily Set (1,2,3,4,5,7,10 or 14 Days)
Weekly Set (1,2,3,4,5,10, or 13 Weeks)
Monthly Set (1,2,3,4,5,6,9 or 12 months)
Each set has the option to display Extension levels.
The Pivotal Level HLC3 and Range = (High - Low), are extracted from previous Period Candle.
FIB LEVELS Colours (same in each period set):
Yellow = Pivot and Pivot Zone (HLC3 by default)
Fuchsia = R1,S1 Levels 0.368 * Range
Lime = R2,S2 Levels 0.618 * Range
Red = R3,S3 Levels 0.786 * Range
Aqua = R4,S4 Levels 1.000 * Range
Green = R5,S5 Levels 1.236 * Range
Orange = R6,S6 Levels 1.382 * Range
Black = R7,S7 Levels 1.618 * Range
Maroon = R8,S8 Levels 2.000 * Range

ChartAdvise_Reaction_PointReaction Point Method is based on the concept of Pivot Points that can be used to identify a reversal. These reversals can be tracked for further action. Ideally this method is useful for Intraday play and gives defined opportunity to the traders.
