regressionsLibrary "regressions"
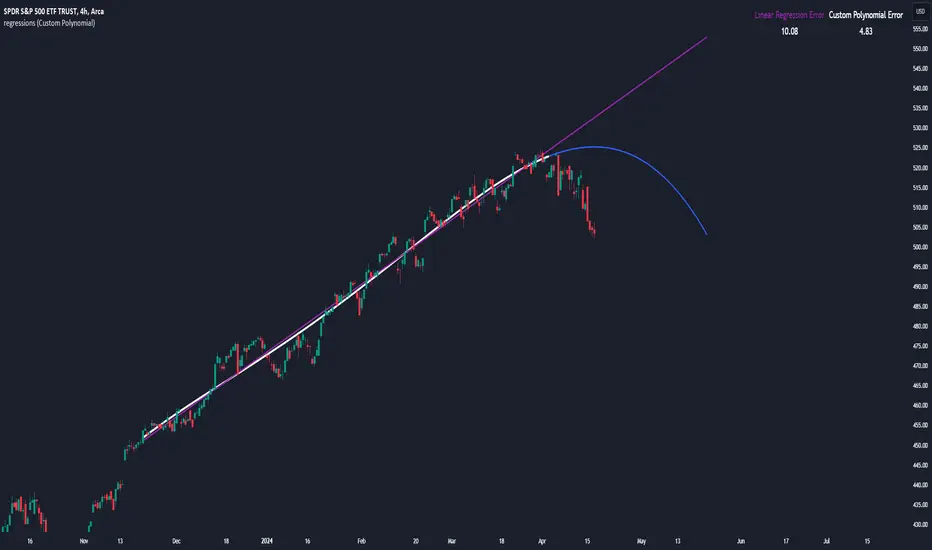
This library computes least square regression models for polynomials of any form for a given data set of x and y values.
fit(X, y, reg_type, degrees)
Takes a list of X and y values and the degrees of the polynomial and returns a least square regression for the given polynomial on the dataset.
Parameters:
X (array) : (float ) X inputs for regression fit.
y (array) : (float ) y outputs for regression fit.
reg_type (string) : (string) The type of regression. If passing value for degrees use reg.type_custom
degrees (array) : (int ) The degrees of the polynomial which will be fit to the data. ex: passing array.from(0, 3) would be a polynomial of form c1x^0 + c2x^3 where c2 and c1 will be coefficients of the best fitting polynomial.
Returns: (regression) returns a regression with the best fitting coefficients for the selecected polynomial
regress(reg, x)
Regress one x input.
Parameters:
reg (regression) : (regression) The fitted regression which the y_pred will be calulated with.
x (float) : (float) The input value cooresponding to the y_pred.
Returns: (float) The best fit y value for the given x input and regression.
predict(reg, X)
Predict a new set of X values with a fitted regression. -1 is one bar ahead of the realtime
Parameters:
reg (regression) : (regression) The fitted regression which the y_pred will be calulated with.
X (array)
Returns: (float ) The best fit y values for the given x input and regression.
generate_points(reg, x, y, left_index, right_index)
Takes a regression object and creates chart points which can be used for plotting visuals like lines and labels.
Parameters:
reg (regression) : (regression) Regression which has been fitted to a data set.
x (array) : (float ) x values which coorispond to passed y values
y (array) : (float ) y values which coorispond to passed x values
left_index (int) : (int) The offset of the bar farthest to the realtime bar should be larger than left_index value.
right_index (int) : (int) The offset of the bar closest to the realtime bar should be less than right_index value.
Returns: (chart.point ) Returns an array of chart points
plot_reg(reg, x, y, left_index, right_index, curved, close, line_color, line_width)
Simple plotting function for regression for more custom plotting use generate_points() to create points then create your own plotting function.
Parameters:
reg (regression) : (regression) Regression which has been fitted to a data set.
x (array)
y (array)
left_index (int) : (int) The offset of the bar farthest to the realtime bar should be larger than left_index value.
right_index (int) : (int) The offset of the bar closest to the realtime bar should be less than right_index value.
curved (bool) : (bool) If the polyline is curved or not.
close (bool) : (bool) If true the polyline will be closed.
line_color (color) : (color) The color of the line.
line_width (int) : (int) The width of the line.
Returns: (polyline) The polyline for the regression.
series_to_list(src, left_index, right_index)
Convert a series to a list. Creates a list of all the cooresponding source values
from left_index to right_index. This should be called at the highest scope for consistency.
Parameters:
src (float) : (float ) The source the list will be comprised of.
left_index (int) : (float ) The left most bar (farthest back historical bar) which the cooresponding source value will be taken for.
right_index (int) : (float ) The right most bar closest to the realtime bar which the cooresponding source value will be taken for.
Returns: (float ) An array of size left_index-right_index
range_list(start, stop, step)
Creates an from the start value to the stop value.
Parameters:
start (int) : (float ) The true y values.
stop (int) : (float ) The predicted y values.
step (int) : (int) Positive integer. The spacing between the values. ex: start=1, stop=6, step=2:
Returns: (float ) An array of size stop-start
regression
Fields:
coeffs (array__float)
degrees (array__float)
type_linear (series__string)
type_quadratic (series__string)
type_cubic (series__string)
type_custom (series__string)
_squared_error (series__float)
X (array__float)