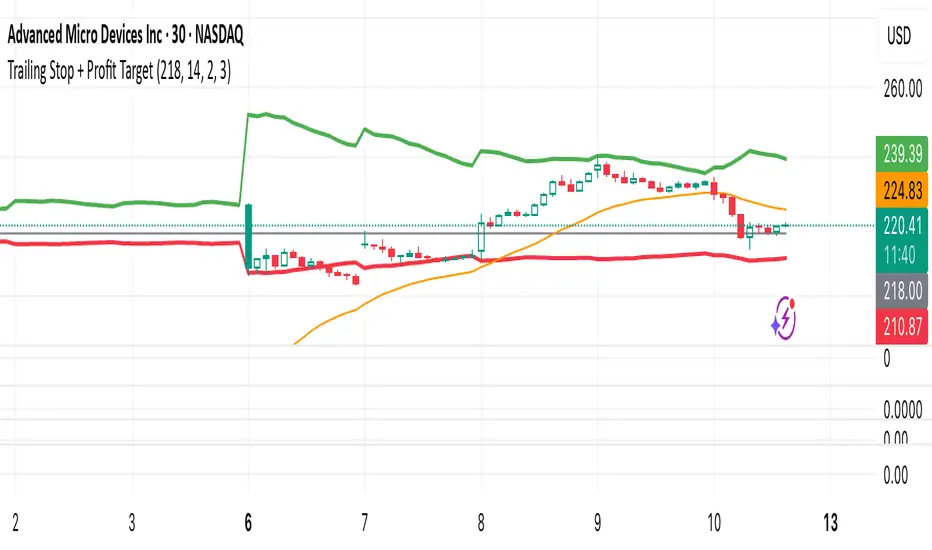
Trailing Stop + Profit TargetTrailing Stop + Exit Confirmation is a manual-entry tool designed to help traders visually manage trades with dynamic trailing stops and profit targets, based on ATR projections with a toggle button to reset calculations in real-time. Contains a “Short” toggle to work for short positions as well, which automatically inverses the PT and SL lines when toggled on.
Primary Calculations: Utilizes a manually adjustable entry price (default: $5 — ideal for options traders) that (when adjusted and recalculated) populates the chart with an adaptive ATR-based trailing stop line, dynamic profit target line, and optional 21-day EMA for directional context.
Below the Entry Price is a fully functional, manual reset toggle to reset all parameters mid-session to assess risk-reward based on entry price, risk tolerance, etc. followed by the “Short” toggle.
Primary Directions/Functions:
Enter your trade price in the “Manual Entry Price” field.
The script will begin plotting a dynamic trailing stop and profit target based on current market conditions.
Use the reset toggle to clear all calculations and start a new position at any time.
Customizable Settings:
ATR Length and Multiplier
Risk/Reward Profit Target Multiplier
Toggle to show/hide trailing stop, target, and EMA lines
Options Trading Use Case:
This tool is especially useful for options traders looking to manage premium-based entries (e.g., $5.00) on intraday or swing trades. The dynamic stop and target lines provide clear visual cues for scaling out or exiting based on price action, while allowing for tighter or looser risk depending on volatility (ATR).
This tool does not auto-detect entries or backtest positions. It is intended to complement your entry signals, not generate them. I've written an Options Momentum Signal indicator you can find right here which functions well in tandem with this tool.
Made for traders who execute trades manually and want typical preset guidelines for profit and stop loss signals but lets you recalculate them by simply clicking a button, especially if any major news or downturn causes a big change in market conditions so you can make adjustments in real time.
اتجاه حجم التداول للأسعار
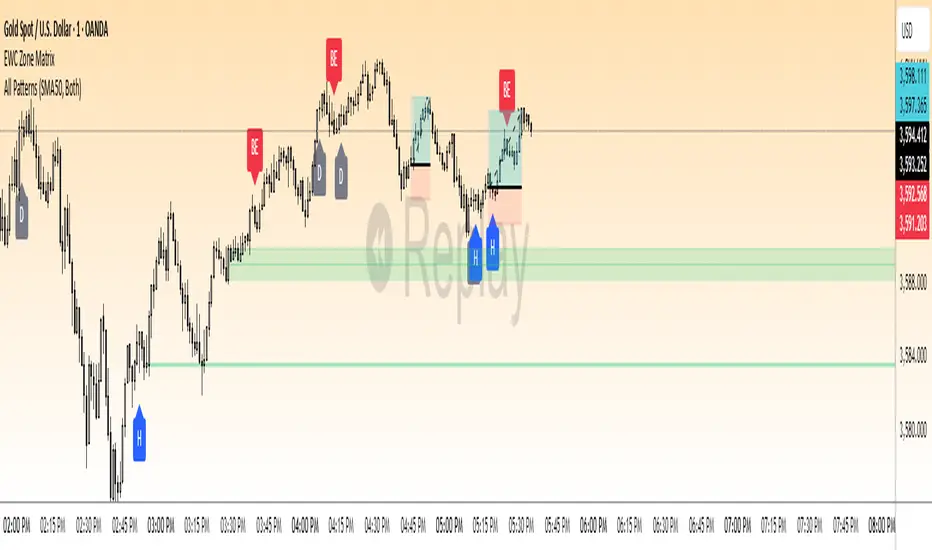
Wyckoff Effort vs. Result📌 Wyckoff Effort vs. Result (E/R) – Visualizing Supply & Demand Imbalance with Volume Confirmation
📖 Overview
The Wyckoff Effort vs. Result (E/R) indicator is designed to help traders interpret market behavior through the lens of volume vs. price movement — a foundational concept in Richard Wyckoff’s methodology.
This tool aims to highlight moments where the “effort” (volume) is not in proportion to the “result” (price movement) — giving insight into potential accumulation or distribution events.
By detecting high-volume candles and classifying them based on their price direction, the indicator visualizes zones where smart money might be active .
⚙️ How It Works
1. Effort Accumulation (High Volume Down Bar):
• When a candle closes lower than it opens (down bar) and has above-average volume , it’s marked as potential absorption of selling pressure (effort to push down met by buying).
• These candles are colored red and the open level is plotted, acting as a potential support or re-test zone.
2. Effort Distribution (High Volume Up Bar):
• When a candle closes higher than it opens (up bar) and has above-average volume , it’s marked as potential distribution (effort to push up absorbed by sellers).
• These candles are colored green and the open level is plotted , acting as a potential resistance or rejection zone.
3. Average Volume Calculation:
• The script calculates a simple moving average (SMA) of volume over a user-defined lookback period.
• If current volume exceeds the average multiplied by a set threshold, it’s treated as a high-effort bar .
🧪 Inputs
Input Description
Average Volume Lookback - Number of bars used to calculate the volume average
High Volume Multiplier. - Multiplier to define what qualifies as “high volume”
🖥️ Visual Output
• 🔴 Red candles = High volume on a down bar → possible accumulation
• 🟢 Green candles = High volume on an up bar → possible distribution
• 📉 Horizontal lines at bar open price mark the potential zones where effort occurred
These zones can serve as:
• Areas of support/resistance
• Trap zones where smart money absorbs liquidity
• Entry/exit filters when combined with price action
🧠 How to Use
• Use in combination with price structure, support/resistance, and volume profile tools
• Watch how price reacts when it revisits the plotted lines
• Look for effort bars that fail to lead to continuation, signaling potential reversal
• Can be used in scalping, swing trading, or Wyckoff-style phase analysis
🔒 Technical Notes
• ✅ Does not repaint
• ✅ Built with Pine Script v6
• ✅ Lightweight and customizable
• ❌ Does not generate buy/sell signals — it provides context, not predictions

Cnagda Pure Price ActionCnagda Pure Price Action (CPPA) indicator is a pure price action-based system designed to provide traders with real-time, dynamic analysis of the market. It automatically identifies key candles, support and resistance zones, and potential buy/sell signals by combining price, volume, and multiple popular trend indicators.
How Price Action & Volume Analysis Works
Silver Zone – Logic, Reason, and Trade Planning
Logic & Visualization:
The Silver Zone is created when the closing price is the lowest in the chosen window and volume is the highest in that window.
Visually, a large silver-colored box/rectangle appears on the chart.
Thick horizontal lines (top and bottom) are drawn at the high and low of that candle/bar, extending to the right.
Reasoning:
This combination typically occurs at strong “accumulation” or support areas:
Sellers push the price down to the lowest point, but aggressive buyers step in with high volume, absorbing supply.
Indicates potential exhaustion of selling and likely shift in market control to buyers.
How to Plan Trades Using Silver Zone:
Watch if price returns to the Silver Zone in the future: It often acts as powerful support.
Bullish entries (buys) can be planned when price tests or slightly pierces this zone, especially if new buy signals occur (like yellow/green candle labels).
Place your stop-loss below the bottom line of the Silver Zone.
Target: Look for the nearest resistance or opposing zone, or use indicator’s bullish label as confirmation.
Extra Tip:
Multiple touches of the Silver Zone reinforce its importance, but if price closes deeply below it with high volume, that’s a caution signal—support may be breaking.
Black Zone – Logic, Reason, and Trade Planning (as CPPA):
Logic & Visualization:
The Black Zone is created when the closing price is the highest in the chosen window and volume is the lowest in that window.
Visually, a large black-colored box/rectangle appears on the chart, along with thick horizontal lines at the top (high) and bottom (low) of the candle, extending to the right.
Reasoning:
This combination signals a strong “distribution” or resistance area:
Buyers push the price up to a local high, but low volume means there is not much follow-through or conviction in the move.
Often marks exhaustion where uptrend may pause or reverse, as sellers can soon step in.
How to Plan Trades Using Black Zone:
If price revisits the Black Zone in the future, it often acts as major resistance.
Bearish entries (sells) are considered when price is near, testing, or slightly above the Black Zone—especially if new sell signals appear (like blue/red candle labels).
Place your stop-loss just above the top line of the Black Zone.
Target: Nearest support zone (such as a Silver Zone) or next indicator’s bearish label.
Extra Tip:
Multiple touches of the Black Zone make it stronger, but if price closes far above with rising volume, be cautious—resistance might be breaking.
Support Line – Logic, Reason, and Trade Planning (as Cppa):
Logic & Visualization:
The Support Line is a dynamically drawn dashed line (usually blue) that marks key price levels where the market has previously shown significant buying interest.
The line is generated whenever a candle forms a high price with high volume (orange logic).
The script checks for historical pivot lows, past support zones, and even higher timeframe (HTF) supports, and then extends a blue dashed line from that price level to the right, labeling it (sometimes as “Prev Support Orange, HTF”).
Reasoning:
This line helps you visually identify where demand has been strong enough to hold price from falling further—essentially a floor in the market used by professional traders.
If price approaches or re-tests this line, there’s a good chance buyers will defend it again.
How to Plan Trades Using Support Line:
Watch for price to approach the Support Line during down moves. If you see a bullish candlestick pattern, buy labels (yellow/green), or other indicators aligning, this can be a high-probability entry zone.
Great for planning stop-loss for long trades: place stops just below this line.
Target: Next resistance zone, Black Zone, or the top of the last swing.
Extra Tip:
Multiple confirmations (support line + Silver Zone + bullish label) provide powerful entry signals.
If price closes strongly below the Support Line with volume, be cautious—support may be breaking, and a trend reversal or deeper correction could follow.
Resistance Line – Logic, Reason, and Trade Planning (from CPPA):
Logic & Visualization:
The Resistance Line is a dynamically drawn dashed line (usually purple or red) that identifies price levels where the market has previously faced significant selling pressure.
This line is created when a candle reaches a high price combined with high volume (orange logic), or from a historical pivot high/resistance,
The script also tracks higher timeframe (HTF) resistance lines, labeled as “Prev Resistance Orange, HTF,” and extends these dashed lines to the right across the chart.
Reasoning:
Resistance Lines are visual markers of “supply zones,” where buyers previously failed, and sellers took control.
If the price returns to this line later, sellers may get active again to defend this level, halting the uptrend.
How to Plan Trades Using Resistance Line:
Watch for price to approach the Resistance Line during up moves. If you see bearish candlestick patterns, sell labels (blue/red), or bearish indicator confirmation, this becomes a strong shorting opportunity.
Perfect for placing stop-loss in short trades—put your stop just above the Resistance Line.
Target: Next support zone (Silver Zone) or bottom of the last swing.
If the price breaks above with high volume, avoid shorting—resistance may be failing.
Extra Tip:
Multiple resistances (Resistance Line + Black Zone + bearish label) make short signals stronger.
Choppy movement around this line often signals indecision; wait for a clear rejection before entering trades.
Bullish / Bearish Label – Logic, Reason, and Trade Planning:
Logic & Visualization:
The indicator constantly calculates a "Bull Score" and a "Bear Score" based on several factors:
Trend direction from price slope
Confirmation by popular indicators (RSI, ADX, SAR, CMF, OBV, CCI, Bollinger Bands, TWAP)
Adaptive scoring (higher score for each bullish/bearish condition met)
If Bull Score > Bear Score, the chart displays a green "BULLISH" label (usually below the bar).
If Bear Score > Bull Score, the chart displays a red "BEARISH" label (usually above the bar).
If neither dominates, a "NEUTRAL" label appears.
Reasoning:
The labels summarize complex price action and indicator analysis into a simple, actionable sentiment cue:
Bullish: Majority of conditions indicate buying strength; trend is up.
Bearish: Majority signals show selling pressure; trend is down.
How to Use in Trade Planning:
Use the Bullish label as confirmation to enter or hold long (buy) positions, especially if near support/Silver Zone.
Use the Bearish label to enter/hold short (sell) positions, especially if near resistance/Black Zone.
For best results, combine with candle color, volume analysis, or other labels (yellow/green for buys, blue/red for sells).
Avoid trading against these labels unless you have strong confluence from zones/support levels.
Yellow Label (Buy Signal) – Logic, Reason & Trade Planning:
Logic & Visualization:
The yellow label appears below a candle (label.style_label_up, yloc.belowbar) and marks a potential buy signal.
Script conditions:
The candle must be a “yellow candle” (which means it’s at the local lowest close, not a high, with normal volume).
Volume is decreasing for 2 consecutive candles (current volume < previous volume, previous volume < second previous).
When these conditions are met, a yellow label is plotted below the candle.
Reasoning:
This scenario often marks the end of selling pressure and start of possible accumulation—buyers may be stepping in as sellers exhaust.
Decreasing volume during a local price low means selling is slowing, possibly hinting at a reversal.
How to Trade Using Yellow Label:
Entry: Consider buying at/just above the yellow-labeled candle’s close.
Stop-loss: A bit below the candle’s low (or Silver Zone line, if present).
Target: Next resistance level, Black Zone, or chart’s bullish label.
Extra Tip:
If the yellow label is found at/near a Silver Zone or Support Line, and trend is “Bullish,” the setup gets even stronger.
Avoid trading if overall indicator shows “Bearish.”
Green Label (Buy with Increasing Volume) – Logic, Reason & Trade Planning:
Logic & Visualization:
The green label is plotted below a candle (label.style_label_up, yloc.belowbar) and marks a strong buy signal.
Script conditions:
The candle must be a “yellow candle” (at the local lowest close, normal volume).
Volume is increasing for 2 consecutive candles (current volume > previous volume, previous volume > second previous).
When these conditions are met, a green label is plotted below the candle.
Reasoning:
This scenario signals that buyers are stepping in aggressively at a local price low—the end of a downtrend with strong, rising activity.
Increasing volume at a price low is a classic sign of accumulation, where institutions or large players may be buying.
How to Trade Using Green Label:
Entry: Consider buying at/just above the green-labeled candle’s close for a momentum-based reversal.
Stop-loss: Slightly below the candle’s low, or the Silver Zone/support line if present.
Target: Nearest resistance zone/Black Zone, indicator’s bullish label, or next swing high.
Extra Tip:
If the green label is near other supports (Silver Zone, Support Line), the setup is extra strong.
Use confirmation from Bullish labels or trend signals for best results.
Green label setups are suitable for quick, high momentum trades due to increasing volume
Blue Label (Sell Signal on Decreasing Volume) – Logic, Reason & Trade Planning:
Logic & Visualization:
The blue label is plotted above a candle (label.style_label_down, yloc.abovebar) as a potential sell signal.
Script conditions:
The candle is a “blue candle” (local highest close, but not also lowest, and volume is neither highest nor lowest).
Volume is decreasing over 2 consecutive candles (current volume < previous, previous < two ago).
When these match, a blue label appears above the candle.
Reasoning:
This typically signals buyer exhaustion at a local high: price has gone up, but volume is dropping, suggesting big players may not be buying any more at these levels.
The trend is losing strength, and a reversal or pullback is likely.
How to Trade Using Blue Label:
Entry: Look to sell at/just below the candle with the blue label.
Stop-loss: Just above the candle’s high (or above the Black Zone/resistance if present).
Target: Nearest support, Silver Zone, or a swing low.
Extra Tip:
Blue label signals are stronger if they appear near Black Zones or Resistance Lines, or when the general market label is "Bearish."
As with buy setups, always check for confirmation from trend or volume before trading aggressively.
Here’s a summary of all key chart labels, zones, and trading logic of your Price Action script:
Silver Zone: Powerful support zone. Created at lowest close + highest volume. Best for buy entries near its lines.
Black Zone: Strong resistance zone. Created at highest close + lowest volume. Ideal for short trades near its levels.
Support Line: Blue dashed line at historical demand; buyers defend here. Look for bullish setups when price approaches.
Resistance Line: Purple/red dashed line at supply; sellers defend here. Great for bearish setups when price nears.
Bullish/Bearish Labels: Summarize trend direction using price action + multiple indicator confirmations. Plan buys, holds on bullish; sells, shorts on bearish.
Yellow Label: Buy signal on decreasing volume and local price low. Entry above candle, stop below, target next resistance.
Green Label: Strong buy on increasing volume at a price low. Entry for momentum trade, stop below, target next zone.
Blue Label: Sell signal on dropping volume and local price high. Entry below candle, stop above, target next support.
Best Practices:
Always combine zone/label signals for higher probability trades.
Use stop-loss near zones/lines for risk management.
Prefer trading in the trend direction (bullish/bearish label agrees with your entry).
if Any Question, Suggestion Feel free to ask
Disclaimer:
All information provided by this indicator is for educational and analysis purposes only, and should not be considered financial advice.

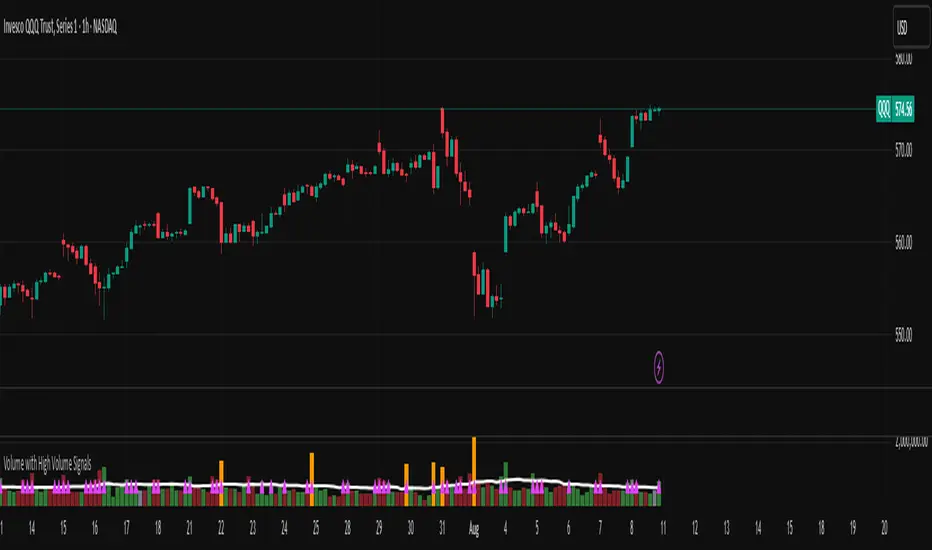
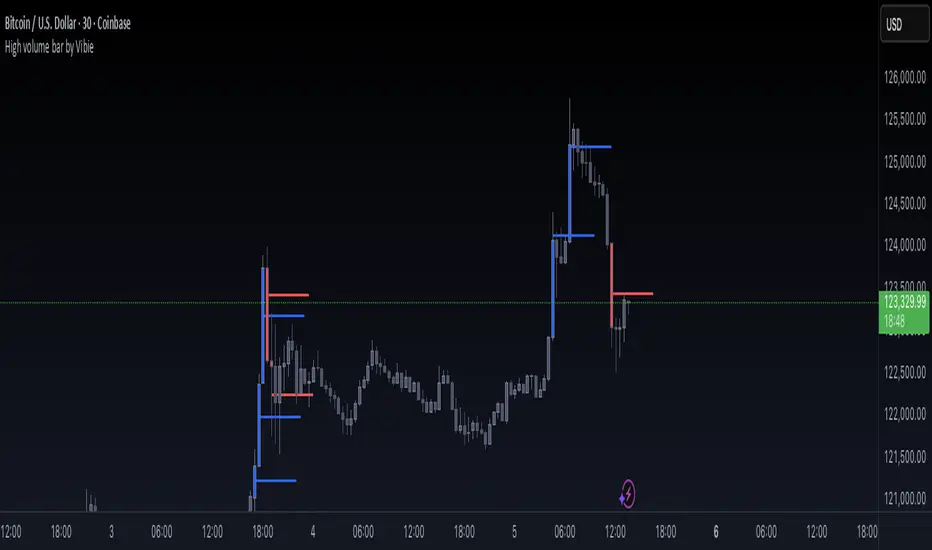
High volume bar by VibieHigh Volume Bar with Extended vPOC (Aggregation Enabled)
🧠 Concept
This indicator is designed to detect institutional activity and large traders by using statistical volume analysis and identifying key intrabar liquidity levels.
It applies Z-Score volume analysis to highlight unusually high volume candles and marks the Volume Point of Control (vPOC) inside each detected bar — the price level where the most volume was transacted.
⸻
⚙️ How It Works
1. Z-Score Volume Analysis
• The indicator calculates how far current volume deviates from its historical average using standard deviations (Z-Score).
• When the Z-Score exceeds the user-defined threshold, the candle is flagged as a High Volume Bar (HVB).
2. Multi-Exchange Aggregation
• Volumes from Binance, Bybit, and Coinbase can be aggregated into a composite volume metric.
• This provides a broader and more accurate market perspective, minimizing anomalies from individual exchanges.
3. Candle Coloring
• Bullish HVB → entire candle (body + wicks) is colored blue.
• Bearish HVB → entire candle is colored red.
• This makes large volume events immediately visible on the chart.
4. vPOC Detection
• The script examines a lower timeframe (e.g., 1 minute) within the HVB to find the price level with the highest traded volume.
• A horizontal line is drawn at that price and can be extended for multiple bars, marking a short-term liquidity zone that often acts as support or resistance.
⸻
🧭 How to Use
• vPOC levels frequently act as liquidity magnets and are often retested after the HVB appears.
• Bullish HVB + vPOC below current price = potential long entry zone.
• Bearish HVB + vPOC above price = potential short entry zone.
• Useful for identifying institutional absorption, stop runs, or hidden accumulation/distribution.
⸻
🌟 Why It’s Original and Useful
• Combines statistical volume analysis (Z-Score) with intrabar volume profiling.
• Aggregates multiple exchanges for broader accuracy.
• Offers precise liquidity levels that classic indicators don’t provide.
• Especially valuable for advanced traders looking for institutional footprints.
HUNT_line [Dr.Forexy]HUNT_line Indicator
📊 **Category:** Price Action & Market Structure
⏰ **Recommended Timeframe:** 5-minute and higher
🎯 **Purpose:** Advanced market structure visualization for professional traders
⸻
⚡ **Key Features:**
• Break of Structure (BOS) and Change of Character (CHOCH) detection
• Internal & Swing Market Structure analysis
• Order Blocks identification with smart filtering
• Fair Value Gaps (FVG) visualization
• Premium/Discount Zones
• Multi-timeframe support
• Real-time structure alerts
⸻
🛠 **How to Use:**
1. Apply on 5M or higher timeframes for best results
2. Monitor BOS/CHOCH for trend direction changes
3. Use Order Blocks as potential support/resistance areas
4. Watch for FVG fills as price inefficiency zones
5. Combine multiple confluences for higher probability setups
⸻
⚠️ **Risk Disclaimer:**
This indicator is for educational purposes only.
Not financial advice. Always conduct your own research.
⸻
🔹 **Credits:**
Inspired by LuxAlgo's "Smart Money Concepts" with custom improvements

CNagda-MomentumX - Institutional FlowMomentumX is designed to empower traders with a deeper understanding of market movements by focusing on Institutional Flow and advanced market structure analytics. The core goal is to identify and visualize where major market participants are operating, and to translate these complex footprints into clear, actionable trading signals — all in real time.
Real-time institutional activity mapping
Actionable entry and exit signals based on live market structure
Intuitive dashboard and dynamic chart visuals
Fully customizable modules for trend, liquidity, and order blocks
Core Logic Design
At the heart of MomentumX lies a robust algorithmic engine built to capture and surface institutional trading behavior. By leveraging advanced mathematical models, the indicator calculates institutional volume ratios and price momentum to pinpoint aggressive moves from large participants.
Institutional Volume & Price Momentum:
Utilizes custom volume indicators and price change analysis to detect strong buying or selling pressure, filtering out retail noise.
Liquidity Grab Detection & Activity Zones:
The script identifies liquidity grabs by monitoring abrupt price sweeps at major support/resistance levels—often where institutions trigger stop hunts or reversals. All critical activity zones are automatically color-coded on the chart for instant recognition.
Dashboard Visualization:
A fully dynamic dashboard table overlays live scores for accumulation, distribution, strength, and weakness—giving traders a real-time scan of market health.
Trendline & Order Block Architecture:
The logic auto-detects pivot highs/lows to draw smart trendlines, while the order block system highlights key reversal areas and breaker zones—making market structure clear and actionable.
MomentumX is packed with high-performance modules, each engineered to simplify complex market behavior and enhance decision-making for traders:
Institutional Flow Signals:
Instantly identifies spots where institutional players drive momentum, using unique volume and price activity analytics.
Bullish/Bearish Liquidity Grab Detection:
Marks abrupt price moves that signal stop hunts or reversals, letting traders anticipate snap-backs or trend shifts.
Trendline Auto-Detection:
Smartly draws trendlines based on significant swing highs and lows, automatically adjusting as price evolves.
Order Block System (Rejection/Breaker):
Spots and highlights key reversal zones with order block rectangles, confirming rejections or breakouts at strategic levels.
Dashboard and Bar Coloring:
A clean dashboard overlay presents live market scores, while dynamic bar coloring makes trend, strength, and high-activity periods instantly visible.
User Input Toggles for Each Module:
Every major feature is fully customizable—enable or disable modules to match individual trading setups or preferences.
Scripting/Development
MomentumX’s scripting process is modular, enabling clarity, scalability, and fast optimization throughout development:
Initialization & Inputs:
Start by defining all user input options, module toggles, color settings, and calculation parameters—ensuring maximum flexibility early on.
Core Calculation Functions:
Script advanced institutional volume and price momentum algorithms. Build out swing length logic, market state filters, and activity scoring methods.
Detection Engines:
Develop and integrate engines for liquidity grabs, automated trendline detection, and order block identification—each with dedicated functions for speed and precision.
Visual Overlays & Plotting:
Implement powerful plotting logic for colored bars, score dashboards, trendlines, reversal zones, and liquidity markers—making every data point clear and actionable on the chart.
Testing Handlers:
Add diagnostic panels and debug outputs to refine calculations and assure accuracy in every market environment.
Sample Trade Setups (Usage)
Cnagda MomentumX delivers clarity for multiple trading styles by providing timely, actionable setups grounded in institutional behavior and market structure. Here’s how traders can leverage the indicator for confident decision-making:
Liquidity Grab Reversal
Enter trades around detected liquidity grabs when price sweeps major support/resistance and the dashboard signals a momentum shift.
Example: Wait for a bullish/Bearish grab near market lows/high, with institutional flow turning positive/negative—enter long/short for potential mean reversion.
Order Block Breakout
Trade breakouts when price cleanly rejects or flips key order block zones highlighted on the chart.
Example: Short at a marked breaker block after a rejection signal, confirmed by a downward institutional activity spike.
Trendline Continuation
Ride established market moves by entering on trendline confirmations plotted by the auto-detect system.
Example: Go long after a trendline retest, confirmed by a green bar color and dashboard strength score.
Dashboard Confirmation
Combine dashboard metrics (strength, accumulation, distribution) with bar color overlays for multi-factor entries.
Example: Enter trades only when all market signals align in real time for maximum probability.
For Short Entry check -- Weakness : For Long Entry Check - Strength With Other Indications
MomentumX is not just another indicator – it’s your edge for reading the market like an insider. By transparently mapping institutional flow, uncovering hidden liquidity zones, and color-coding every major structure shift, MomentumX transforms complexity into actionable clarity. Whether you’re scalping, swing trading, or investing, you’ll gain a decisive, real-time advantage on every chart.
Embrace smarter decisions, adapt to changing market conditions instantly, and join a new generation of technically empowered traders.
Customize, observe, and let the market reveal opportunities in a way you’ve never experienced before.
Happy Trading

DEVEL Volume Intention 0.0.2Indicator that detects the price intention based on the volume of the last 20 candles. Highlighting a candle if the volume is significantly greater than the average and plotting a rectangle if so.

Flat Breakout Detector🔹 English Description
Flat Breakout Detector is an indicator designed to highlight when the market shifts from flat, sideways trading into active movement.
Originality: Unlike standard trend or volatility tools, this script focuses on detecting abnormal volatility expansions compared to previous candles. Since around 80% of the time the market stays in flat ranges, the real opportunities often appear when price leaves consolidation. The indicator identifies these volatility anomalies, which may signal the start of a trend or a breakout.
What it does: The script measures the relative distance of price extremes from a moving average and applies a Z-score transformation. This helps traders spot volatility spikes that stand out from the prior market behavior. In simple terms: when volatility expands unusually, the indicator highlights it as a potential breakout moment.
How to use:
Ideal for traders working with consolidation/breakout patterns.
Works best as a scanner/alert system: when a signal appears, open the chart, analyze the setup, and decide whether it fits your trading strategy.
Not every signal means entry — sometimes volatility expansion happens inside the flat.
If the setup matches your strategy, place limit orders or enter at market; if not, ignore the signal and wait for the next one.
⚠️ Disclaimer: This is not a buy/sell signal generator. It only highlights moments of volatility expansion and possible breakouts. Always combine it with your own technical and volume analysis before making trading decisions.

Maple Liquidity Hunter📌 Description for Maple Liquidity Hunter
Maple Liquidity Hunter – AI-Enhanced Volume Liquidity Detector
Maple Liquidity Hunter is an advanced volume-based indicator designed to uncover hidden liquidity zones in the market.
By dynamically analyzing price–volume interactions, it automatically highlights momentum shifts with adaptive color coding.
✨ Key Features
AI-inspired volume/price analysis model
Detects liquidity surges and potential absorption points
Auto-coloring of volume bars for quick visual recognition
Optional volume moving average filter for trend context
⚠️ Disclaimer: This tool is for educational and research purposes only. It does not guarantee future results. Always test thoroughly before live trading.

Multipower Entry SecretMultipower Entry Secret indicator is designed to be the ultimate trading companion for traders of all skill levels—especially those who struggle with decision-making due to unclear or overwhelming signals. Unlike conventional trading systems cluttered with too many lines and confusing alerts, this indicator provides a clear, adaptive, and actionable guide for market entries and exits.
Key Points:
Clear Buy/Sell/Wait Signals:
The script dynamically analyzes price action, candle patterns, volume, trend strength, and higher time frame context. This means it gives you “Buy,” “Sell,” or “Wait” signals based on real, meaningful market information—filtering out the noise and weak trades.
Multi-Timeframe Adaptive Analysis:
It synchronizes signals between higher and current timeframes, ensuring you get the most reliable direction—reducing the risk of getting caught in fake moves or sudden reversals.
Automatic Support, Resistance & Liquidity Zones:
Key levels like support, resistance, and liquidity zones are auto-detected and displayed directly on the chart, helping you make precise decisions without manual drawing.
Real-Time Dashboard:
All relevant information, such as trend strength, market intent, volume sentiment, and the reason behind each signal, is neatly summarized in a dashboard—making monitoring effortless and intuitive.
Customizable & Beginner-Friendly:
Whether you’re a newcomer wanting straightforward guidance or a professional needing advanced customization, the indicator offers flexible options to adjust analysis depth, timeframes, sensitivity, and more.
Visual & Clutter-Free:
The design ensures that your chart remains clean and readable, showing only the most important information. This minimizes mental overload and allows for instant decision-making.
Who Will Benefit?
Beginners who want to learn trading logic, avoid common traps, and see the exact reason behind every signal.
Advanced traders who require adaptive multi-timeframe analytics, fast execution, and stress-free monitoring.
Anyone who wants to save screen time, reduce analysis paralysis, and have more confidence in every trade they take.
1. No Indicator Clutter
Intent:
Many traders get confused by charts filled with too many indicators and signals. This often leads to hesitation, missed trades, or taking random, risky trades.
In this Indicator:
You get a clean and clutter-free chart. Only the most important buy/sell/wait signals and relevant support/resistance/liquidity levels are shown. These update automatically, removing the “overload” and keeping your focus sharp, so your decision-making is faster and stress-free.
2. Exact Entry Guide
Intent:
Traders often struggle with entry timing, leading to FOMO (fear of missing out) or getting trapped in sudden market reversals.
In this Indicator:
The system uses powerful adaptive logic to filter out weak signals and only highlight the strongest market moves. This not only prevents you from entering late or on noise, but also helps avoid losses from false breakouts or whipsaws. You get actionable suggestions—when to enter, when to hold back—so your entries are high-conviction and disciplined.
3. HTF+LTF Logic: Multitimeframe Sync Analysis
Intent:
Most losing trades happen when you act only on the short-term chart, ignoring the bigger market trend.
In this Indicator:
Signals are based on both the current chart timeframe (LTF) and a higher (HTF, like hourly/daily) timeframe. The indicator synchronizes trend direction, momentum, and structure across both levels, quickly adapting to show you when both are aligned. This filtering results in “only trade with the bigger trend”—dramatically increasing your win rate and market confidence.
4. Auto Support/Resistance & Liquidity Zones
Intent:
Drawing support/resistance and liquidity zones manually is time-consuming and error-prone, especially for beginners.
In this Indicator:
The system automatically identifies and plots the most crucial support/resistance levels and liquidity zones on your chart. This is based on adaptive, real-time price and volume analysis. These zones highlight where major institutional activity, trap setups, or real breakouts/reversals are most likely, removing guesswork and giving you a clear reference for entries, exits, and stop placements.
5. Clear Action/Direction
Intent:
Traders need certainty—what does the market want right now? Most indicators are vague.
In this Indicator:
Your dashboard always displays in plain words (like “BUY”, “SELL”, or “WAIT”) what action makes sense in the current market phase. Whether it’s a bull trap, volume spike, wick reversal, or exhaustion—it’s interpreted and explained clearly. No more confusion—just direct, real-time advice.
6. For Everyone (Beginner to Pro)
Intent:
Most advanced indicators are overwhelming for new traders; simple ones lack depth for professionals.
In this Indicator:
It is simple enough for a beginner—just add it to the chart and instantly see what action to consider. At the same time, it includes advanced adaptive analysis, multi-timeframe logic, and customizable settings so professional traders can fine-tune it for their strategies.
7. Ideal Usage and User Benefits
Instant Decision Support:
Whenever you’re unsure about a trade, just look at the indicator’s suggestion for clarity.
Entry Learning:
Beginners get real-time “practice” by not only seeing signals, but also the reason behind them—improving your chart reading and market understanding.
Screen Time & Stress Reduction:
Clear, relevant information only; no noise, less fatigue, faster decisions.
Makes Trading Confident & Simple:
The smart dashboard splits actionable levels (HTF, LTF, action) so you never miss a move, avoid traps, and stay aligned with high-probability trades.
8. Advanced Input Settings (Smart Customization)
Explained with Examples:
Enable Wick Analysis:
Finds candles with strong upper/lower wicks (signs of rejection/buying/selling force), alerting you to hidden reversals and protecting from FOMO entries.
Enable Absorption:
Detects when heavy order flow from one side is “absorbed” by the other (shows where institutional buyers/sellers are likely active, helps spot fake breakouts).
Enable Unusual Breakout:
Highlights real breakouts—large volatility plus high volume—so you catch genuine moves and avoid random spikes.
Enable Range/Expansion:
Smartly flags sudden range expansions—when the market goes from quiet to volatile—so you can act at the start of real trends.
Trend Bar Lookback:
Adjusts how many bars/candles are used in trend calculations. Short (fast trades, more signals), long (more reliability, fewer whipsaws).
Bull/Bear Bars for Strong Trend Min:
Sets how many candles in a row must support a trend before calling it “strong”—prevents flipping signals, keeps you disciplined.
Volume MA Length:
Lets you adjust how many bars back volume is averaged—fine-tune for your asset and trading style for best volume signals.
Swing Lookback Bars:
Set how many bars to use for swing high/low detection—short (quick swing levels), long (stronger support/resistance).
HTF (Bias Window):
Decide which higher timeframe the indicator should use for big-picture market mood. Adjustable for any style (scalp, swing, position).
Adaptive Lookback (HTF):
Choose how much HTF history is used for detecting major extremes/zones. Quick adjust for more/less sensitivity.
Show Support/Resistance, Liquidity Zones, Trendlines:
Toggle them on/off instantly per your needs—keeps your chart relevant and tailored.
9. Live Dashboard Sections Explained
Intent HTF:
Shows if the bigger timeframe currently has a Bullish, Bearish, or Neutral (“Chop”) intent, based on strict volume/price body calculations. Instant clarity—no more guessing on trend bias.
HTF Bias:
Clear message about which side (buy/sell/sideways) controls the market on the higher timeframe, so you always trade with the “big money.”
Chart Action:
The central action for the current bar—Whether to Buy, Sell, or Wait—calculated from all indicator logic, not just one rule.
TrendScore Long/Short:
See how many candles in your chosen window were bullish or bearish, at a glance. Instantly gauge market momentum.
Reason (WHY):
Every time a signal appears, the “reason” cell tells you the primary logic (breakout, wick, strong trend, etc.) behind it. Full transparency and learning—never trade blindly.
Strong Trend:
Shows if the market is currently in a powerful trend or not—helping you avoid choppy, risky entries.
HTF Vol/Body:
Displays current higher timeframe volume and candle body %—helping spot when big players are active for higher probability trades.
Volume Sentiment:
A real-time analysis of market psychology (strong bullish/bearish, neutral)—making your decision-making much more confident.
10. Smart and User-Friendly Design
Multi-timeframe Adaptive:
All calculations can now be drawn from your choice of higher or current timeframe, ensuring signals are filtered by larger market context.
Flexible Table Position:
You can set the live dashboard/summary anywhere on the chart for best visibility.
Refined Zone Visualization:
Liquidity and order blocks are visually highlighted, auto-tuning for your settings and always cleaning up to stay clutter-free.
Multi-Lingual & Beginner Accessible:
With Hindi and simple English support, descriptions and settings are accessible for a wide audience—anyone can start using powerful trading logic with zero language barrier.
Efficient Labels & Clear Reasoning:
Signal labels and reasons are shown/removed dynamically so your chart stays informative, not messy.
Every detail of this indicator is designed to make trading both simpler and smarter—helping you avoid the common pitfalls, learn real price action, stay in sync with the market’s true mood, and act with discipline for higher consistency and confidence.
This indicator makes professional-grade market analysis accessible to everyone. It’s your trusted assistant for making smarter, faster, and more profitable trading decisions—providing not just signals, but also the “why” behind every action. With auto-adaptive logic, clear visuals, and strong focus on real trading needs, it lets you focus on capturing the moves that matter—every single time.

VPT-style Close-to-Close Indicator📈Cumulative momentum (close-to-close × rel. volume) | MA & Donchian optional | ⚡ Alerts
Key Features:
- Tracks cumulative price momentum using close-to-close changes weighted by relative volume.
- Optional smoothed line (SMA/EMA) to identify trend direction.
- Optional Donchian channels to detect potential breakouts and breakdowns.
- Includes alerts for:
- Moving average crosses (bullish/bearish)
- Local maxima/minima in cumulative momentum
- Donchian upper/lower channel breakouts
- Customizable inputs: smoothing length, channel lengths, scaling factor, and visibility toggles.
- Visual cues: line colors indicate momentum direction (green = up, red = down).
- Use Case: Quickly spot momentum shifts, trend direction, and breakout opportunities with clear alerts and visual cues.

Custom Buy/Sell Pattern BuilderAre you tired of using trading indicators that only let you follow fixed, pre-designed rules? Do you wish you could build your own “Buy” or “Sell” signals, experiment with your own ideas, or see instantly if your unique pattern works—without learning coding or hiring a developer?
The Custom Buy/Sell Pattern Builder is designed for YOU.
This TradingView indicator lets ANY trader—even a complete beginner—define exactly what kind of price and volume conditions should create a BUY or SELL label on any chart, in any market, at any timeframe.
You don’t need to know programming. You don’t need to know the definition of a hammer, doji, volume spike, or Engulfing pattern.
With a few clicks and easy dropdown choices, you can:
Make your own rules for buying or selling
Choose how many candles your pattern should look at
Decide if you want the biggest body, the lowest volume, the biggest movement, or any combination you can imagine
The result?
You’ll see clear “BUY” or “SELL” labels automatically show up on your chart whenever the exact rule YOU built matches current price action.
No more guessing. No more forced strategies. Just pure control and visual feedback!
Why Is This Powerful?
Traditional indicators (like MACD, RSI, or even classic candlestick scanners) work the same for everyone—and only as their inventors defined.
But every trader, and every market, is unique.
What if you could say:
“Show me a ‘SELL’ every time the newest candle is bigger than the one before, but with LESS volume, while the bar before that had an even smaller body—but more volume than all others?”
With this tool, it’s EASY!
You simply pick which candle you want to compare (most recent, previous, etc), what to compare (body or volume—body means the candle’s “thickness”, from open to close), choose “greater than”, “less than”, or “equal to”, and set a multiplier if you want (like “half as much”, “twice as big”, etc).
After this, if any bar on the chart fits all your rules, it will mark it as a BUY or SELL, depending on your selection.
This means—
Beginners can start experimenting with their intuition or small ideas, without tech hurdles
Experienced traders can visualize and fine-tune any possible logic, before they commit to backtesting or automating a real strategy
Every “what if” or “I wonder” setup is just 2–3 clicks away
How Does It Work? Simple Steps
1. Choose Your Signal Type
“Buy” or “Sell”
This tells the indicator whether to mark the qualifying bars with a green “BUY” or red “SELL” label
2. Pick How Many Candles To Use
“Pattern Candle Count” input (2, 3, or 4)
Example: If you use 4, the pattern will be applied to the most recent 4 candles at every step
3. Define Your Pattern With Inputs
For each candle (from newest “0” to oldest “3”), you can set:
Body Condition (example: “is this candle’s body bigger/smaller/equal to another?”)
Pick which candle to compare against
Pick “>”, “<”, “>=”, “<=”, or “=”
Set a multiplier if needed (like “0.5” to mean “half as big as” or “2” for “twice as big as”)
Volume Condition (exact same choices, but based on trading volume—not the candle’s price body)
For example:
“Candle0 Body > Candle2 Body”
means “the latest candle’s real-body (open–close) is bigger than the one two bars ago.”
“Candle1 Volume <= Candle2 Volume”
means “the previous candle’s volume is less than or equal to the volume of the bar two periods ago.”
You can leave a comparison blank if you don’t want to use it for a particular candle.
What Happens After You Set Your Rules?
Every bar on your chart is checked for your logic:
If ALL body AND volume conditions are true (for each candle you specified),
AND
The signal side (“Buy” or “Sell”) matches your dropdown,
Then a green “BUY” or red “SELL” label will show right on the bar, so you can visually spot exactly where your logic works!
Practical Example:
Suppose you want an entry setup that is:
“Sell whenever the newest candle’s body is bigger than two bars ago, body before that is bigger than three bars ago, AND the newest candle’s volume is less than or equal to two bars ago, AND the candle three bars ago’s volume is less than or equal to half the candle two bars ago’s volume.”
You’d set:
Pattern Candle Count: 4
Side: Sell
Candle0 Body Ref#: 2, Op: >, Mult: 1
Candle1 Body Ref#: 3, Op: >, Mult: 1
Candle0 Vol Ref#: 2, Op: <=, Mult: 1
Candle3 Vol Ref#: 2, Op: <=, Mult: 0.5
And the script will find all “SELL” bars on your chart matching these conditions.
Inputs Section: What Does Each Setting Do?
Let’s break down each input in the indicator’s Settings one by one, so even if you’re new, you’ll understand exactly how to use it!
1. Pattern Candle Count (2–4)
What is it?
This sets how many candles in a row you want your rule to look at.
Example:
“4” means your rules are based on the most recent candle and the 3 before it.
“2” means you are only comparing the current and previous candles.
Tip:
Beginners often use 4 to spot stronger patterns, but you can experiment!
2. Signal Side
What is it?
Choose “Buy” or “Sell”. The word you pick here decides which colored label (green for Buy, red for Sell) appears if your pattern matches.
Example:
Want to spot where “Sell” is likely? Pick “Sell”.
Change to “Buy” if you want bullish signals instead.
3. Body & Volume Comparison Settings (per Candle)
For each candle (#0 is newest/current, #3 is oldest in your pattern window):
Body Comparison
Candle# Body Ref#
Choose which other candle you want to compare this one’s body to.
“0” = newest, “1” = previous, “2” = two bars ago, “3” = three bars ago
Candle# Body Op (Operator; >, <, >=, <=, =)
How do you want to compare?
“>” means “greater than” (is bigger than)
“<” means “less than” (is smaller than)
“=” means “equal to”
Candle# Body Mult (Multiplier)
If you want relative comparisons. For example, with Mult=1:
“Candle0 body > Candle2 body x 1” means just “0 is larger than 2.”
“Candle0 body > Candle2 body x 2” means “0 is more than double 2.”
Volume Comparison
Candle# Vol Ref# / Op / Mult
Exact same logic as body, but works on the “Volume” of each candle (how much was traded during that bar).
How to Set Up a Rule (Step by Step Example)
Say you want to mark a Sell every time:
The most recent candle’s real body is BIGGER than the candle 2 bars ago;
The previous candle’s body is also BIGGER than the candle 3 bars ago;
The current candle’s volume is LESS than or equal to the volume of candle 2;
The previous candle’s volume is LESS than or equal to candle 2’s volume;
The candle 3 bars ago’s volume is LESS than or equal to HALF candle 2’s volume.
You’d set:
Pattern Candle Count: 4
Side: "Sell"
Candle0 Body Ref#: 2, Op: “>”, Mult: 1
Candle1 Body Ref#: 3, Op: “>”, Mult: 1
Candle0 Vol Ref#: 2, Op: “<=”, Mult: 1
Candle1 Vol Ref#: 2, Op: “<=”, Mult: 1
Candle3 Vol Ref#: 2, Op: “<=”, Mult: 0.5
All other comparisons (operators) can be left blank if you don’t want to use them!
When these rules are met, a bright red “SELL” label will appear right above the bar matching all your conditions.
Practical Tips & FAQ for Beginners
What does “body” mean?
It’s the “true range” of the candle: the difference between open and close. This ignores wicks for simple setups.
What does “volume” mean?
This is the total trading activity during that candle/bar. Many traders believe that patterns with different volume “meaning” (such as low-volume up bars, or high-volume down bars) signal a meaningful change.
What if nothing shows on chart?
It just means your current rules are rarely or never matched! Try making your comparisons simpler (maybe just 2-body and 2-volume conditions to start).
You can always hit “Reset Settings” to go back to default.
Can I use this for both buying and selling?
YES! You can detect both bullish (Buy) and bearish (Sell) custom conditions; just switch “Signal Side.”
Do I need to know coding?
Not at all! Everything is in simple input panels.
Creative Use Cases, Example Recipes & Troubleshooting
Creative Ways to Use
Spotting Reversals
Example:
Buy when: the newest candle body is LARGER than the previous 3 bars, but ALL volumes are lower than their neighbors.
Why? Sometimes, a big candle with surprisingly low volume after a sequence of small bars can signal a reversal.
Finding Exhaustion Moves
Example:
Sell when: the current bar body is twice as big as two bars ago, but volume is half.
Why? A very big candle with very little volume compared to similar bars may show the move is “running out of steam.”
Custom “Breakout + Confirmation” Patterns
Example:
Buy when:
Candle 0’s body is greater than Candle 2’s by at least 1.5x,
Candle 0’s volume is greater than Candle 1 and Candle 2,
Candle 1’s volume is less than Candle 0.
Why? This could catch strong breakouts but filter out noisy moves.
Multi-bar Bias/Squeeze Filter
Use “Pattern Candle Count: 4”
Set all 4 volume conditions to “<” and each reference to the previous candle.
Now, a BUY or SELL only marks when each bar is “dryer”/less active than the last — a classic squeeze or low-volatility buildup.
Troubleshooting Guide
“I don’t see any Buy/Sell label; is something broken?”
Most likely, your rules are too strict or rare! Try using only two comparisons and leave other “Op” inputs blank as a test.
Double-check you have enough candles on the chart: you need at least as many bars as your pattern count.
“Why does a label appear but not where I expect?”
Remember, the script checks your rules for every NEW candle. The candle “0” is always the most recent, then “1” is one bar back, etc.
Check the color and type chosen: “Signal Side” must be “Buy” for green, “Sell” for red.
“What if I want a more complex pattern?”
Stack conditions! You can demand the body/volume of each candle in your window meet a different rule or all follow the same rule in sequence.
Mini Glossary — For Newcomers
Candle/Bar: Each bar on the chart, shows price movement during a fixed time (e.g., one minute, one hour, one day).
Body: The colored (or filled) part of the candle — the open-to-close price range.
Volume: How much of the asset was actually traded that candle/bar.
Reference Index: When you pick “2” as a reference, it means “the candle two bars ago in the pattern window.”
Operator (“Op”): The math symbol used to compare (>, <, =, etc).
Signal Side: Whether you want to highlight bullish (“Buy”) or bearish (“Sell”) bars.
Tips for Getting More Value
Start Simple—try just one or two conditions at first. See what lights up. Slowly add more logic as you get comfortable.
Watch the chart live as you change settings. The labels update instantly—this makes strategy design fast and visual!
Try flipping your ideas: If a certain pattern doesn’t work for buys, try reversing the direction for possible “sell” setups.
Remember: There is NO wrong idea. This indicator is only limited by your creativity—it’s a “strategy playground.”
Example Quick-Start Recipes
Classic Sell:
4 candles, side = Sell
Candle0 Body > Candle2; Candle1 Body > Candle3
Candle0 Vol <= Candle2; Candle1 Vol <= Candle2; Candle3 Vol <= Candle2 × 0.5
Simple Buy After Pause:
3 candles, side = Buy
Candle0 Body > Candle1; Candle0 Vol > Candle1
All other Ops blank
Low-Volume Pullback for Entry:
4 candles, side = Buy
Candle0 Body > Candle2
Candle0 Vol < Candle1; Candle1 Vol < Candle2; Candle2 Vol < Candle3
Final Words
Think of this as your “pattern lab.” No code, no guesswork—just experiment, see what the market actually gives, and design your own visual rulebook.
If you’re stuck, reset the script to defaults—it’s always safe to start again!
If you want more ready-made “recipes” for different strategies/styles, just ask and I’ll send some more setups for you.
Happy building—and may your edge always be YOUR edge!

EWC Precision Blocks📌 EWC Precision Blocks
🔎 Overview
EWC Precision Blocks is a professional market analysis tool designed to highlight high-probability trading zones on the chart. Instead of relying on lagging signals, this indicator maps out Alpha Zones (bullish) and Beta Zones (bearish), allowing traders to identify potential market reaction areas with clarity.
The algorithm is built to adapt across Scalp, Swing, and Position trading modes, making it flexible for short-term intraday traders as well as long-term investors.
⚡ Key Features
Multi-Mode Detection – Switch between Scalp, Swing, or Position modes depending on your trading style.
EWC Alpha Zone (Bullish Detection) – Highlights areas where the market may find strong upward momentum.
EWC Beta Zone (Bearish Detection) – Highlights areas where the market may face downward pressure.
Zone Break Tracking – Visualizes when a zone has been invalidated or broken.
Body-Based Detection – Option to base calculations on candle bodies instead of wicks for precision.
Zone Flips – Displays polarity shifts when zones transition from supportive to resistive behavior (and vice versa).
Custom Styling – Full control of zone and break colors for clear chart visualization.
🎯 How to Use
Select Your Mode
Scalp → Designed for fast intraday moves.
Swing → Medium-term setups, ideal for session trading.
Position → Long-term outlook, suitable for investors.
Watch the Alpha Zones
Highlighted bullish areas can serve as potential support or accumulation zones.
Watch the Beta Zones
Highlighted bearish areas may act as resistance or distribution zones.
Monitor Breaks & Flips
Alpha Breaks → Bullish zones failing.
Beta Breaks → Bearish zones failing.
Zone Flips → Polarity changes, often powerful signals.
🛠 Inputs & Customization
EWC Mode → Choose Scalp, Swing, or Position.
Show Last Alpha Zone → Set how many bullish zones to display.
Show Last Beta Zone → Set how many bearish zones to display.
Body-Based Detection → Toggle candle body vs. wick calculation.
EWC Alpha Zone / Beta Zone Styling → Customize zone colors.
Alpha Break / Beta Break Colors → Adjust break visuals.
Show Zone Flips → Enable/disable historical polarity labels.
Status Bar → Display inputs directly in the chart status line.
📈 Best Practices
Works across all timeframes and markets (forex, crypto, indices, stocks).
Combine with your existing strategy for confirmation.
Use in alignment with higher timeframe structure for maximum accuracy.
⚠ Disclaimer
EWC Precision Blocks is a market visualization tool provided for educational purposes only. It does not provide financial advice, signals, or guaranteed results. Always do your own research and manage risk responsibly.
🔹 About EWC
EWC (EastWave Capital) is dedicated to developing professional-grade trading tools and strategies for traders across forex, crypto, commodities, and indices. With over a decade of combined market experience, our mission is to empower traders with precision, clarity, and confidence in their decision-making.
EWC Precision Blocks is one of our flagship tools, reflecting our commitment to innovation, transparency, and trader-focused solutions.
📌 Published by Usama Manzoor — Founder of EastWave Capital (EWC)
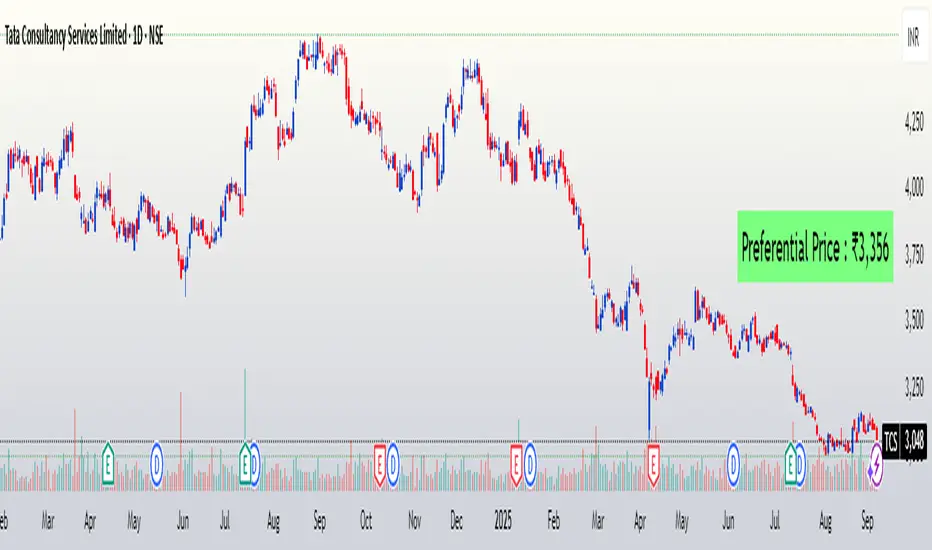
FuTech : Preferential Price📌 First Ever Indicator : FuTech : Preferential Price
💡 What if you could instantly know the Preferential Price — as if the company announced a preferential issue in today’s meeting surprisingly?
Normally, you’d be stuck with tedious valuation spreadsheets and SEBI formula checks 🧮📑…
✨ But not anymore — this tool does the hard work for you!
With just one click, it auto-calculates the Preferential Issue Floor Price under SEBI ICDR Regulations, 2018 - Regulation 164 (as amended), directly from your chart symbol.
✅ How it works ?
📅 Relevant Date = 30 days prior to either:
• Today’s date (default mode)
• Or your chosen EGM date (user input)
📊 For the Relevant Date, the indicator automatically computes:
• VWAP (90 trading days preceding Relevant Date)
• VWAP (10 trading days preceding Relevant Date)
🔎 As per SEBI Reg.164, the higher of these two VWAPs is selected as the Minimum Issue Price (Preferential Price).
💰 Price is neatly formatted in Indian style (e.g. ₹1,00,000).
✅ Key Features:
⚡ Auto-calculates from chart symbol — no manual entry.
🎛️ Option to input EGM date for accurate floor price compliance.
🎨 Fully customizable: text color, size, background, position.
🪄 Clean display → shows only the final Preferential Price (Reg.164).
📌 Usage:
This indicator is built for analysts, fund managers, and corporate professionals dealing with Preferential Allotment pricing compliance.
It ensures quick visibility of the floor price under SEBI ICDR rules, directly on your chart.
⚠️ Disclaimer:
📌 The calculated Preferential Price is an approximation based on SEBI ICDR Reg.164 methodology.
📊 Actual price determined by the company / merchant banker may vary slightly (±5) due to rounding, data source differences, or timing adjustments.
📅 Ensure to verify with official exchange data and SEBI filings before relying on these numbers.
📝 This tool is meant for analytical and educational purposes only, not a substitute for regulatory or professional advice.
Volume Profile AnalysisThe Volume Profile Dashboard is a professional-grade analysis tool built for TradingView. It focuses on displaying a comprehensive volume profile breakdown within a dashboard format directly on the chart. The purpose of this tool is to help traders quickly assess buy versus sell volume dynamics, momentum, and sentiment in order to support informed trading decisions.
Instead of plotting simple bars, this indicator uses a detailed table and visual progress bar to summarize live and historical market activity. By condensing key metrics into a structured format, traders can analyse market behaviour without manually calculating or switching between multiple indicators.
________________________________________
How the Script Works
1. Data Gathering
The script uses lower-timeframe price and volume data to calculate buy volume, sell volume, and total traded volume for the current and previous candles.
2. Volume Allocation
Buy and sell volumes are estimated by looking at the candle’s range (high to low) and how the closing price aligns within that range. The closer the close is to the high, the stronger the buying pressure. The closer the close is to the low, the stronger the selling pressure.
3. Delta and Momentum
o Delta measures the difference between buy and sell volume.
o Volume momentum compares the current candle’s activity to the previous one, showing if interest is rising or fading.
4. Point of Control (POC)
An average of high, low, and close is calculated to give an approximate “point of control” level—an area of balance where buyers and sellers previously agreed on price.
5. Dashboard Visualization
All these calculations are displayed inside a clean dashboard table with separate rows for the current candle, previous candle, and a summary row. Icons, colors, and progress bars make it visually intuitive.
6. On-Chart Progress Indicator
A dynamic horizontal progress bar is plotted on the chart above price, showing the balance between buy and sell volume for the latest activity.
7. Alerts
Built-in alerts trigger when strong buying or selling pressure is detected or when there is a significant spike in total traded volume.
________________________________________
How This Tool Can Be Used
• Intraday Trading: Quickly gauge whether buyers or sellers are in control of the market at any moment.
• Swing Trading: Compare momentum shifts between candles to identify early trend reversals.
• Risk Management: Use delta and sentiment signals to confirm whether to hold or reduce exposure.
• Confirmation: Align the volume profile dashboard with other indicators (such as RSI, MACD, or trendlines) for stronger trading conviction.
________________________________________
Using Mixed Indicators for Decisions
This dashboard alone provides volume insights, but better decisions come when it is combined with other tools:
• Pairing it with an RSI can show whether heavy buying is happening in overbought conditions.
• Combining with a SuperTrend or moving averages can confirm if volume momentum aligns with the price trend.
• Overlaying support/resistance levels can identify whether strong buy/sell signals occur at critical levels.
Mixed indicators prevent relying on one signal alone, reducing false trades.
________________________________________
Importance of This Tool
• Clarity: Condenses complex volume data into a simple, visual format.
• Speed: Traders can react faster with pre-calculated buy/sell percentages.
• Precision: Highlights hidden imbalances that are not obvious from candles alone.
• Professional-grade dashboard: Offers an institutional-style view of market behavior directly within TradingView.
________________________________________
Parameters in the Dashboard Table
• Period: Shows whether the row is for the current or previous candle, along with trend arrows.
• Price Range: The high–low range of the candle.
• Total Volume: The sum of buy and sell activity.
• Buy Volume / Sell Volume: Separated distribution of transactions leaning bullish or bearish.
• Delta: The net difference between buy and sell volumes, highlighting pressure imbalance.
• Buy % / Sell %: The percentage contribution of each side to total volume.
• POC: An average reference level where market consensus was strongest.
• Progress: A graphical bar showing buy vs sell dominance.
• Signal: Simplified output like Strong Buy, Buy, Strong Sell, Sell, Neutral.
• Summary Row: Compares changes between the current and previous candles and gives overall market sentiment.
________________________________________
Stock Market Disclaimer
This tool is for educational and informational purposes only. It does not constitute financial advice, investment advice, or trading recommendations. The stock market and cryptocurrency markets involve high risk. Traders and investors should do their own research and consult licensed financial advisors before making investment decisions. Past performance is not indicative of future results.
________________________________________
Misuse Disclaimer
This script has been developed as per TradingView’s rules and is intended for responsible trading analysis only. Any misuse, redistribution, or modification outside of TradingView’s policies is discouraged. The author and platform are not responsible for financial losses, misinterpretation of signals, or misuse of the code.
________________________________________
Disclaimer
Training & Educational Only — This material and the indicator are provided for educational purposes only. Nothing here is investment advice or a solicitation to buy or sell financial instruments. Past simulated or historical performance does not predict future results. Always perform full back testing and risk management, and consider seeking advice from a qualified financial professional before trading with real capital.
________________________________________

Volume Heat ZoneVolume Zones Indicator
This Pine Script creates a volume-based zone analysis tool for TradingView.
Function:
Divides the price range (high to low) into 20 levels over a 100-candle lookback period
Measures volume activity at each price level
Draws boxes at levels with above-average volume (1.5x threshold)
Key Settings:
Lookback Period (100): Number of candles analyzed
Price Levels (20): Price range subdivisions
Volume Threshold (1.5): Minimum volume multiplier for zones
Candle Offset (1): Excludes current candle from analysis
Projection Bars (10): Extends boxes 10 bars into the future
How it works:
The indicator identifies price levels where significant trading volume occurred historically, highlighting potential support/resistance zones. Boxes are redrawn on each confirmed candle, showing dynamic volume concentration areas that traders can use for entry/exit decisions.

Smart Money Precision Structure [BullByte]Smart Money Precision Structure
Advanced Market Structure Analysis Using Institutional Order Flow Concepts
---
OVERVIEW
Smart Money Precision Structure (SMPS) is a comprehensive market analysis indicator that combines six analytical frameworks to identify high-probability market structure patterns. The indicator uses multi-dimensional scoring algorithms to evaluate market conditions through institutional order flow concepts, providing traders with professional-grade market analysis.
---
PURPOSE AND ORIGINALITY
Why This Indicator Was Developed
• Addresses the gap between retail and institutional analysis methods
• Consolidates multiple analysis techniques that professionals use separately
• Automates complex market structure evaluation into actionable insights
• Eliminates the need for multiple indicators by providing comprehensive analysis
What Makes SMPS Original
• Six-Layer Confluence System - Unique combination of market regime, structure, volume flow, momentum, price action, and adaptive filtering
• Institutional Pattern Recognition - Identifies smart money accumulation and distribution patterns
• Adaptive Intelligence - Parameters automatically adjust based on detected market conditions
• Real-Time Market Scoring - Proprietary algorithm rates market quality from 0-100%
• Structure Break Detection - Advanced pivot analysis identifies trend reversals early
---
HOW IT WORKS - TECHNICAL METHODOLOGY
1. Market Regime Analysis Engine
The indicator evaluates five core market dimensions:
• Volatility Score - Measures current volatility against 50-period historical baseline
• Trend Score - Analyzes alignment between 8, 21, and 50-period EMAs
• Momentum Score - Combines RSI divergence with MACD signal alignment
• Structure Score - Evaluates pivot point formation clarity
• Efficiency Score - Calculates directional movement efficiency ratio
These scores combine to classify markets into five regimes:
• TRENDING - Strong directional movement with aligned indicators
• RANGING - Sideways movement with mixed directional signals
• VOLATILE - Elevated volatility with unpredictable price swings
• QUIET - Low volatility consolidation periods
• TRANSITIONAL - Market shifting between different regimes
2. Market Structure Analysis
Advanced pivot point analysis identifies:
• Higher Highs and Higher Lows for bullish structure
• Lower Highs and Lower Lows for bearish structure
• Structure breaks when established patterns fail
• Dynamic support and resistance from recent pivot points
• Key level proximity detection using ATR-based buffers
3. Volume Flow Decoding
Institutional activity detection through:
• Volume surge identification when volume exceeds 2x average
• Buy versus sell pressure analysis using price-volume correlation
• Flow strength measurement through directional volume consistency
• Divergence detection between volume and price movements
• Institutional threshold alerts when unusual volume patterns emerge
4. Multi-Period Momentum Synthesis
Weighted momentum calculation across four timeframes:
• 1-period momentum weighted at 40%
• 3-period momentum weighted at 30%
• 5-period momentum weighted at 20%
• 8-period momentum weighted at 10%
Result smoothed with 6-period EMA for noise reduction.
5. Price Action Quality Assessment
Each bar evaluated for:
• Range quality relative to 20-period average
• Body-to-range ratio for directional conviction
• Wick analysis for rejection pattern identification
• Pattern recognition including engulfing and hammer formations
• Sequential price movement analysis
6. Adaptive Parameter System
Parameters automatically adjust based on detected regime:
• Trending markets reduce sensitivity and confirmation requirements
• Volatile markets increase filtering and require additional confirmations
• Ranging markets maintain neutral settings
• Transitional markets use moderate adjustments
---
COMPLETE SETTINGS GUIDE
Section 1: Core Analysis Settings
Analysis Sensitivity (0.3-2.0)
• Default: 1.0
• Lower values require stronger price movements
• Higher values detect more subtle patterns
• Scalpers use 0.8-1.2, swing traders use 1.5-2.0
Noise Reduction Level (2-7)
• Default: 4
• Controls filtering of false patterns
• Higher values reduce pattern frequency
• Increase in volatile markets
Minimum Move % (0.05-0.50)
• Default: 0.15%
• Sets minimum price movement threshold
• Adjust based on instrument volatility
• Forex: 0.05-0.10%, Stocks: 0.15-0.25%, Crypto: 0.20-0.50%
High Confirmation Mode
• Default: True (Enabled)
• Requires all technical conditions to align
• Reduces frequency but increases reliability
• Disable for more aggressive pattern detection
Section 2: Market Regime Detection
Enable Regime Analysis
• Default: True (Enabled)
• Activates market environment evaluation
• Essential for adaptive features
• Keep enabled for best results
Regime Analysis Period (20-100)
• Default: 50 bars
• Determines regime calculation lookback
• Shorter for responsive, longer for stable
• Scalping: 20-30, Swing: 75-100
Minimum Market Clarity (0.2-0.8)
• Default: 0.4
• Quality threshold for pattern generation
• Higher values require clearer conditions
• Lower for more patterns, higher for quality
Adaptive Parameter Adjustment
• Default: True (Enabled)
• Enables automatic parameter optimization
• Adjusts based on market regime
• Highly recommended to keep enabled
Section 3: Market Structure Analysis
Enable Structure Validation
• Default: True (Enabled)
• Validates patterns against support/resistance
• Confirms trend structure alignment
• Essential for reliability
Structure Analysis Period (15-50)
• Default: 30 bars
• Period for structure pattern analysis
• Affects support/resistance calculation
• Match to your trading timeframe
Minimum Structure Alignment (0.3-0.8)
• Default: 0.5
• Required structure score for valid patterns
• Higher values need stronger structure
• Balance with desired frequency
Section 4: Analysis Configuration
Minimum Strength Level (3-5)
• Default: 4
• Minimum confirmations for pattern display
• 5 = Maximum reliability, 3 = More patterns
• Beginners should use 4-5
Required Technical Confirmations (4-6)
• Default: 5
• Number of aligned technical factors
• Higher = fewer but better patterns
• Works with High Confirmation Mode
Pattern Separation (3-20 bars)
• Default: 8 bars
• Minimum bars between patterns
• Prevents clustering and overtrading
• Increase for cleaner charts
Section 5: Technical Filters
Momentum Validation
• Default: True (Enabled)
• Requires momentum alignment
• Filters counter-trend patterns
• Essential for trend following
Volume Confluence Analysis
• Default: True (Enabled)
• Requires volume confirmation
• Identifies institutional participation
• Critical for reliability
Trend Direction Filter
• Default: True (Enabled)
• Only shows patterns with trend
• Reduces counter-trend signals
• Disable for reversal hunting
Section 6: Volume Flow Analysis
Institutional Activity Threshold (1.2-3.5)
• Default: 2.0
• Multiplier for unusual volume detection
• Lower finds more institutional activity
• Stock: 2.0-2.5, Forex: 1.5-2.0, Crypto: 2.5-3.5
Volume Surge Multiplier (1.8-4.5)
• Default: 2.5
• Defines significant volume increases
• Adjust per instrument characteristics
• Higher for stocks, lower for forex
Volume Flow Period (12-35)
• Default: 18 bars
• Smoothing for volume analysis
• Shorter = responsive, longer = smooth
• Match to timeframe used
Section 7: Analysis Frequency Control
Maximum Analysis Points Per Hour (1-5)
• Default: 3
• Limits pattern frequency
• Prevents overtrading
• Scalpers: 4-5, Swing traders: 1-2
Section 8: Target Level Configuration
Target Calculation Method
• Default: Market Adaptive
• Three modes available:
- Fixed: Uses set point distances
- Dynamic: ATR-based calculations
- Market Adaptive: Structure-based levels
Minimum Target/Risk Ratio (1.0-3.0)
• Default: 1.5
• Minimum acceptable reward vs risk
• Higher filters lower probability setups
• Professional standard: 1.5-2.0
Fixed Mode Settings:
• Fixed Target Distance: 50 points default
• Fixed Invalidation Distance: 30 points default
• Use for consistent instruments
Dynamic Mode Settings:
• Dynamic Target Multiplier: 1.8x ATR default
• Dynamic Invalidation Multiplier: 1.0x ATR default
• Adapts to volatility automatically
Market Adaptive Settings:
• Use Structure Levels: True (default)
• Structure Level Buffer: 0.1% default
• Places levels at actual support/resistance
Section 9: Visual Display Settings
Color Theme Options
• Professional (Teal/Red)
- Bullish: Teal (#26a69a)
- Bearish: Red (#ef5350)
- Neutral: Gray (#78909c)
- Best for: Traditional traders, clean appearance
• Dark (Neon Green/Pink)
- Bullish: Neon Green (#00ff88)
- Bearish: Hot Pink (#ff0044)
- Neutral: Dark Gray (#333333)
- Best for: Dark theme users, high contrast
• Light (Green/Red Classic)
- Bullish: Green (#4caf50)
- Bearish: Red (#f44336)
- Neutral: Light Gray (#9e9e9e)
- Best for: Light backgrounds, traditional colors
• Vibrant (Cyan/Magenta)
- Bullish: Cyan (#00ffff)
- Bearish: Magenta (#ff00ff)
- Neutral: Medium Gray (#888888)
- Best for: High visibility, modern appearance
Dashboard Position
• Options: Top Left, Top Right, Bottom Left, Bottom Right, Middle Left, Middle Right
• Default: Top Right
• Choose based on chart layout preference
Dashboard Size
• Full: Complete information display (desktop)
• Mobile: Compact view for small screens
• Default: Full
Analysis Display Style
• Arrows : Simple directional markers
• Labels : Detailed text information
• Zones : Colored areas showing pattern regions
• Default: Labels (most informative)
Display Options:
• Display Analysis Strength: Shows star rating
• Display Target Levels: Shows target/invalidation lines
• Display Market Regime: Shows regime in pattern labels
---
HOW TO USE SMPS - DETAILED GUIDE
Understanding the Dashboard
Top Row - Header
• SMPS Dashboard title
• VALUE column: Current readings
• STATUS column: Condition assessments
Market Regime Row
• Shows: TRENDING, RANGING, VOLATILE, QUIET, or TRANSITIONAL
• Color coding: Green = Favorable, Red = Caution
• Status: FAVORABLE or CAUTION trading conditions
Market Score Row
• Percentage from 0-100%
• Above 60% = Strong conditions
• 40-60% = Moderate conditions
• Below 40% = Weak conditions
Structure Row
• Direction: BULLISH, BEARISH, or NEUTRAL
• Status: INTACT or BREAK
• Orange BREAK indicates structure failure
Volume Flow Row
• Direction: BUYING or SELLING
• Intensity: STRONG or WEAK
• Color indicates dominant pressure
Momentum Row
• Numerical momentum value
• Positive = Upward pressure
• Negative = Downward pressure
Volume Status Row
• INST = Institutional activity detected
• HIGH = Above average volume
• NORM = Normal volume levels
Adaptive Mode Row
• ACTIVE = Parameters adjusting
• STATIC = Fixed parameters
• Shows required confirmations
Analysis Level Row
• Minimum strength level setting
• Pattern separation in bars
Market State Row
• Current analysis: BULLISH, BEARISH, NEUTRAL
• Shows analysis price level when active
T:R Ratio Row
• Current target to risk ratio
• GOOD = Meets minimum requirement
• LOW = Below minimum threshold
Strength Row
• BULL or BEAR dominance
• Numerical strength value 0-100
Price Row
• Current price
• Percentage change
Last Analysis Row
• Previous pattern direction
• Bars since last pattern
Reading Pattern Signals
Bullish Structure Pattern
• Upward triangle or "Bullish Structure" label
• Star rating shows strength (★★★★★ = strongest)
• Green line = potential target level
• Red dashed line = invalidation level
• Appears below price bars
Bearish Structure Pattern
• Downward triangle or "Bearish Structure" label
• Star rating indicates reliability
• Green line = potential target level
• Red dashed line = invalidation level
• Appears above price bars
Pattern Strength Interpretation
• ★★★★★ = 6 confirmations (exceptional)
• ★★★★☆ = 5 confirmations (strong)
• ★★★☆☆ = 4 confirmations (moderate)
• ★★☆☆☆ = 3 confirmations (minimum)
• Below minimum = filtered out
Visual Elements on Chart
Lines and Levels:
• Gray Line = 21 EMA trend reference
• Green Stepline = Dynamic support level
• Red Stepline = Dynamic resistance level
• Green Solid Line = Active target level
• Red Dashed Line = Active invalidation level
Pattern Markers:
• Triangles = Arrow display mode
• Text Labels = Label display mode
• Colored Boxes = Zone display mode
Target Completion Labels:
• "Target" = Price reached target level
• "Invalid" = Pattern invalidated by price
---
RECOMMENDED USAGE BY TIMEFRAME
1-Minute Charts (Scalping)
• Sensitivity: 0.8-1.2
• Noise Reduction: 3-4
• Pattern Separation: 3-5 bars
• High Confirmation: Optional
• Best for: Quick intraday moves
5-Minute Charts (Precision Intraday)
• Sensitivity: 1.0 (default)
• Noise Reduction: 4 (default)
• Pattern Separation: 8 bars
• High Confirmation: Enabled
• Best for: Day trading
15-Minute Charts (Short Swing)
• Sensitivity: 1.0-1.5
• Noise Reduction: 4-5
• Pattern Separation: 10-12 bars
• High Confirmation: Enabled
• Best for: Intraday swings
30-Minute to 1-Hour (Position Trading)
• Sensitivity: 1.5-2.0
• Noise Reduction: 5-7
• Pattern Separation: 15-20 bars
• Regime Period: 75-100
• Best for: Multi-day positions
Daily Charts (Swing Trading)
• Sensitivity: 1.8-2.0
• Noise Reduction: 6-7
• Pattern Separation: 20 bars
• All filters enabled
• Best for: Long-term analysis
---
MARKET-SPECIFIC SETTINGS
Forex Pairs
• Minimum Move: 0.05-0.10%
• Institutional Threshold: 1.5-2.0
• Volume Surge: 1.8-2.2
• Target Mode: Dynamic or Market Adaptive
Stock Indices (ES, NQ, YM)
• Minimum Move: 0.10-0.15%
• Institutional Threshold: 2.0-2.5
• Volume Surge: 2.5-3.0
• Target Mode: Market Adaptive
Individual Stocks
• Minimum Move: 0.15-0.25%
• Institutional Threshold: 2.0-2.5
• Volume Surge: 2.5-3.5
• Target Mode: Dynamic
Cryptocurrency
• Minimum Move: 0.20-0.50%
• Institutional Threshold: 2.5-3.5
• Volume Surge: 3.0-4.5
• Target Mode: Dynamic
• Increase noise reduction
---
PRACTICAL APPLICATION EXAMPLES
Example 1: Strong Trending Market
Dashboard Reading:
• Market Regime: TRENDING
• Market Score: 75%
• Structure: BULLISH, INTACT
• Volume Flow: BUYING, STRONG
• Momentum: +0.45
Interpretation:
• Strong uptrend environment
• Institutional buying present
• Look for bullish patterns as continuation
• Higher probability of success
• Consider using lower sensitivity
Example 2: Range-Bound Conditions
Dashboard Reading:
• Market Regime: RANGING
• Market Score: 35%
• Structure: NEUTRAL
• Volume Flow: SELLING, WEAK
• Momentum: -0.05
Interpretation:
• No clear direction
• Low opportunity environment
• Patterns are less reliable
• Consider waiting for regime change
• Or switch to a range-trading approach
Example 3: Structure Break Alert
Dashboard Reading:
• Previous: BULLISH structure
• Current: Structure BREAK
• Volume: INST flag active
• Momentum: Shifting negative
Interpretation:
• Trend reversal potentially beginning
• Institutional participation detected
• Watch for bearish pattern confirmation
• Adjust bias accordingly
• Increase caution on long positions
Example 4: Volatile Market
Dashboard Reading:
• Market Regime: VOLATILE
• Market Score: 45%
• Adaptive Mode: ACTIVE
• Confirmations: Increased to 6
Interpretation:
• Choppy conditions
• Parameters auto-adjusted
• Fewer but higher quality patterns
• Wider stops may be needed
• Consider reducing position size
Below are a few chart examples of the Smart Money Precision Structure (SMPS) indicator in action.
• Example 1 – Bullish Structure Detection on SOLUSD 5m
• Example 2 – Bearish Structure Detected with Strong Confluence on SOLUSD 5m
---
TROUBLESHOOTING GUIDE
No Patterns Appearing
Check these settings:
• High Confirmation Mode may be too restrictive
• Minimum Strength Level may be too high
• Market Clarity threshold may be too high
• Regime filter may be blocking patterns
• Try increasing sensitivity
Too Many Patterns
Adjust these settings:
• Enable High Confirmation Mode
• Increase Minimum Strength Level to 5
• Increase Pattern Separation
• Reduce Sensitivity below 1.0
• Enable all technical filters
Dashboard Shows "CAUTION"
This indicates:
• Market conditions are unfavorable
• Regime is RANGING or QUIET
• Market score is low
• Consider waiting for better conditions
• Or adjust expectations accordingly
Patterns Not Reaching Targets
Consider:
• Market may be choppy
• Volatility may have changed
• Try Dynamic target mode
• Reduce target/risk ratio requirement
• Check if regime is VOLATILE
---
ALERTS CONFIGURATION
Alert Message Format
Alerts include:
• Pattern type (Bullish/Bearish)
• Strength rating
• Market regime
• Analysis price level
• Target and invalidation levels
• Strength percentage
• Target/Risk ratio
• Educational disclaimer
Setting Up Alerts
• Click Alert button on TradingView
• Select SMPS indicator
• Choose alert frequency
• Customize message if desired
• Alerts fire on pattern detection
---
DATA WINDOW INFORMATION
The Data Window displays:
• Market Regime Score (0-100)
• Market Structure Bias (-1 to +1)
• Bullish Strength (0-100)
• Bearish Strength (0-100)
• Bull Target/Risk Ratio
• Bear Target/Risk Ratio
• Relative Volume
• Momentum Value
• Volume Flow Strength
• Bull Confirmations Count
• Bear Confirmations Count
---
BEST PRACTICES AND TIPS
For Beginners
• Start with default settings
• Use High Confirmation Mode
• Focus on TRENDING regime only
• Paper trade first
• Learn one timeframe thoroughly
For Intermediate Users
• Experiment with sensitivity settings
• Try different target modes
• Use multiple timeframes
• Combine with price action analysis
• Track pattern success rate
For Advanced Users
• Customize per instrument
• Create setting templates
• Use regime information for bias
• Combine with other indicators
• Develop systematic rules
---
IMPORTANT DISCLAIMERS
• This indicator is for educational and informational purposes only
• Not financial advice or a trading system
• Past performance does not guarantee future results
• Trading involves substantial risk of loss
• Always use appropriate risk management
• Verify patterns with additional analysis
• The author is not a registered investment advisor
• No liability accepted for trading losses
---
VERSION NOTES
Version 1.0.0 - Initial Release
• Six-layer confluence system
• Adaptive parameter technology
• Institutional volume detection
• Market regime classification
• Structure break identification
• Real-time dashboard
• Multiple display modes
• Comprehensive settings
## My Final Thoughts
Smart Money Precision Structure represents an advanced approach to market analysis, bringing institutional-grade techniques to retail traders through intelligent automation and multi-dimensional evaluation. By combining six analytical frameworks with adaptive parameter adjustment, SMPS provides comprehensive market intelligence that single indicators cannot achieve.
The indicator serves as an educational tool for understanding how professional traders analyze markets, while providing practical pattern detection for those seeking to improve their technical analysis. Remember that all trading involves risk, and this tool should be used as part of a complete analysis approach, not as a standalone trading system.
- BullByte

VWMA MACD Trend Grinder Buy/Sell SignalsDescription:
This indicator combines a VWMA-based MACD with volume and trend filters to reduce false buy and sell signals.
It is designed to give more reliable entry and exit points in trending markets while avoiding low-volume noise.
Features:
1. VWMA MACD:
- MACD is calculated using Volume-Weighted Moving Averages (VWMA) instead of standard EMAs.
- Histogram shows the difference between MACD and its signal line.
2. Volume Filter:
- Signals are only triggered when current volume exceeds a multiple of its moving average.
- Reduces false signals in low-volume periods.
3. Trend Filter:
- Only triggers buy signals when price is above a long-term VWMA (uptrend).
- Only triggers sell signals when price is below the long-term VWMA (downtrend).
- Helps avoid counter-trend trades.
4. Plots:
- MACD (blue), Signal (orange), Histogram (green/red)
- Trend VWMA (purple)
- Buy and Sell arrows in the indicator pane (green/red)
5. Alerts:
- Configurable alerts for buy and sell signals filtered by volume and trend.
Inputs:
- Fast Length: VWMA period for the fast MACD line (default 12)
- Slow Length: VWMA period for the slow MACD line (default 26)
- Signal Length: EMA period for the MACD signal line (default 9)
- Volume MA Length: Length for volume moving average filter (default 20)
- Volume Threshold Multiplier: Multiplier for volume filter (default 1.2)
- Trend VWMA Length: Period for long-term trend VWMA (default 50)
- Price Source: Close, HL2, HLC3, OHLC4
Usage:
- Use as a confirmation tool along with other analysis techniques.
- Buy when the green triangle appears (MACD crossover, above trend VWMA, sufficient volume).
- Sell when the red triangle appears (MACD crossunder, below trend VWMA, sufficient volume).
- Trend VWMA helps visually confirm the market trend.
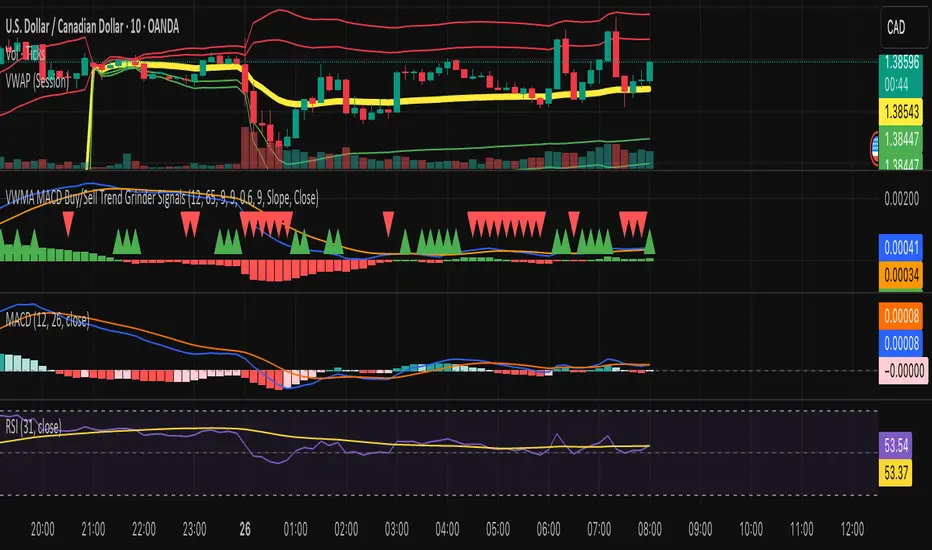
Svl - Trading SystemPrice can tell lies but volume cannot, so keeping this in mind I have created this indicator in which you see sell order block and buy order block on the basis of price action + volume through which we execute our trade
First of all, let us know its core concepts and logic, which will help you in taking the right decisions in it.
core concept of the " Svl - Trading System " TradingView indicator is based on professional price action, volume, and swing structure. This indicator smartly gives real-time insights of important price turning points, reversal zones, and trend continuation. Its deep explanation is given below.
Edit - default swing length -5 , change according your nature , tested With 7 For 5 minute timeframe
Core Concept:
1. Swing Structure Detection
The indicator automatically detects swing highs (HH/LH) and swing lows (HL/LL) on the chart.
HH: Higher High
HL: Higher Low
LH: Lower High
LL: Lower Low
These swings are the backbone of price action – signaling a change in trend, a bounce, reversal or trend continuation.
2. Order Block (OB) Mapping
Buy Order Block (Buy OB): When the indicator detects the HL/LL swing, we declare Buy OB, the lowest point of the swing.
Sell Order Block (Sell OB): On HH/LH swing, the highest point of our swing is called Sell OB.
Order Blocks are those important zones of price where historically price has reacted strongly – where major clusters of buyers/sellers are located in the market.
3. Volume Analysis (Optional Dashboard/Barcolor)
The candle color depends on the volume ranking on the chart (most high/low, normal, pressure blue shade).
Highest/lowest volume candles are a special highlight, which helps to spot liquidity spikes, exhaustion, or big orders.
4. Live Dashboard
There is an automated dashboard in the top-right of the chart, which shows this in real-time:
Last swing type (HH/HL/LH/LL)
Reversal price (last swing level)
Swing direction (Bull/Bear/Neutral)
Volume, Buy OB, Sell OB, etc.
This helps the trader understand the market situation at a glance.
5. Smart Plotting/Labels
Buy/Sell are plotted as distinct lines on the OB chart.
The Labels option gives clear visual swing points.
All calculations are fast and automated – the user does not need to mark manually.
This indicator is an advanced, fully-automated price action tool that combines
trend, reversal, volume, liquidity and zone detection in one smart system,
makes entry/exit decisions objective and error-free,
and provides complete trading confidence with a live monitor/dashboard.
All of its functions/properties such as: swing detect, OB plot, volume color, dashboard follow best practice for professional chart analysis!

Institutional Interest DisplayIndicator Overview:
This dashboard helps evaluate stocks quickly based on Market Cap, 52-week positioning, and liquidity metrics. It combines price strength with volume demand signals for breakout or institutional interest.
Logic Implemented:
1. Market Cap Classification:
- Market Cap = close × shares_outstanding (built-in value if available)
- Large-cap: ≥ ₹20,000 Cr
- Mid-cap: ₹5,000 – 20,000 Cr
- Small-cap: < ₹5,000 Cr
2. 52-Week Range (% from High/Low):
- 52W High = ta.highest(high, 252)
- 52W Low = ta.lowest(low, 252)
- % from 52W High = (Close ÷ 52W High – 1) × 100
- % from 52W Low = (Close ÷ 52W Low – 1) × 100
- CANSLIM logic → Prefer stocks near highs, avoid near lows
3. Average Daily Volume (ADV):
- ADV = ta.sma(volume, 50)
- Chosen 50D (more reliable than 20/30D, smooths anomalies)
4. Breakout Volume Confirmation:
- Volume Signal = Current Volume ÷ ADV
- Breakout Threshold = >1.5 × ADV
- Helps detect demand-driven price breakouts
5. % Change in Volume vs ADV:
- %Chg = ((Current Vol ÷ ADV) – 1) × 100
- Indicates abnormal activity vs typical trading
6. Up/Down Volume Ratio (U/D Ratio):
- Defined as: (Sum of volume on up days ÷ Sum of volume on down days)
- 50-day window
- U/D > 1 = net buying pressure
- U/D > 1.2 = stronger institutional demand
7. Up Days with Volume ≥ 1.5 × ADV:
- Counts number of up days (Close > Previous Close) in last 50 days where Volume ≥ 1.5 × ADV
8. Average Turnover:
- AvgTurnover = Avg Volume × Price
- Thresholds:
- Large-cap ≥ 1000M
- Mid-cap ≥ 200M
- Small-cap ≥ 50M
Table Layout:
- 4 Columns:
- Col 1 → Category, Market Cap, % from 52W Low, % from 52W High
- Col 2 → Values for above
- Col 3 → Avg Volume, Vol Today, %Chg Vol, U/D Ratio
- Col 4 → Values for above + Up Days >1.5 × ADV, Avg Turnover
Color Coding:
- Value cells have distinct background colors
- Labels = black text, grey background
- Green highlights signify thresholds met

Trend Display Table (with Change Alerts)📌 Indicator: Trend Display Table (with Change Alerts)
This indicator helps identify trend direction based on a 15-minute 20 SMA compared against a 10 EMA applied to that SMA.
Trend Logic:
Bullish → 20 SMA crosses above 10 EMA (on SMA values)
Bearish → 20 SMA crosses below 10 EMA (on SMA values)
Neutral → No crossover (trend continues from previous state)
Display:
A compact trend table appears on the chart (top-right), showing the current trend with customizable colors, font size, and background.
Alerts:
Alerts are triggered only when the trend changes (from Bullish → Bearish or Bearish → Bullish).
This prevents repeated alerts on every bar.
✅ Useful for:
Confirming higher timeframe trend bias
Filtering trades in choppy markets
Getting notified instantly when the trend flips

High Tick Volume Alert (Classic Style)This indicator has the classic appearance of the volume indicator for tick volume. It notifies you according to your individual settings when there is increased volume on price.

Volume with High Volume SignalsIndicator Description for Promotional Post (in English)
Unlock Market Insights with the "Volume with High Volume Signals" Indicator!
Are you ready to take your trading to the next level? The Volume with High Volume Signals indicator is your ultimate tool for spotting critical market movements driven by volume surges. Designed for traders who want clarity and precision, this Pine Script indicator combines powerful volume analysis with customizable features to help you stay ahead of the game.
Why Choose This Indicator?
Dynamic Volume Visualization: Watch volume bars come to life with customizable coloring. Choose to color bars based on candle direction (green for bullish, red for bearish) or use a neutral gray for a clean look.
High Volume Detection: Instantly spot significant volume spikes with our advanced highlighting feature. When volume exceeds twice the Simple Moving Average (SMA), bars are highlighted in a bold, customizable color (default: yellow) to signal potential breakout or reversal opportunities.
Dual Moving Averages: Track volume trends with both Simple Moving Average (SMA) and Exponential Moving Average (EMA). Fully customizable periods, colors, and line thickness let you tailor the indicator to your trading style.
Visual Alerts for Key Moments: When volume surges above both SMA and EMA, a vibrant fuchsia triangle appears above the bar, giving you an immediate visual cue for high-impact market activity.
User-Friendly Customization: Adjust every aspect of the indicator—toggle SMA/EMA visibility, set periods, choose colors, and fine-tune line thickness to match your preferences.
Perfect For:
Day traders looking for high-volume breakouts.
Swing traders identifying trend reversals.
Any trader who wants to harness volume as a leading indicator.
Why It’s a Must-Have:
Volume is the heartbeat of the market, and this indicator transforms raw data into actionable insights. Whether you're scalping, swing trading, or analyzing long-term trends, the Volume with High Volume Signals indicator empowers you to make informed decisions with confidence.
Get Started Today!
Add the Volume with High Volume Signals indicator to your TradingView arsenal and start decoding market moves like a pro. Don’t miss out on the edge that top traders rely on—grab this indicator now and elevate your trading strategy!