Pro Ecometrics [by @Amu_Arsalan] ✔ Intro
As a day trader, this is one of my main strategies to trade with, I have been developing this strategy last 6 months. this strategy helps me make great trades more confident. I wish this could help you make great trades as well
✔ OVERVIEW
This is a combination of linear regression for trend analysis and auto plot channel and divergences for 9 oscillators and indicators in 5 different candle range lookback.
✔ CONCEPTS
As a trader, you probably know how to trade with channels and trend lines, but we need more confirmation before we dive into a trade, Divergences are one of the most accurate and reliable confirmations for this purpose. So I combine these as a strategy. when I see a confluence in divergence signal and trend line (regression), it has a great chance to see a reversal.
✔ Divergences
Show both Bearish and Bullish Divergences fully detailed for normal and hidden divergences it plots a label with indicator names and its values that make this divergence occur. it could calculate divergences for 9 oscillators and indicators for 5 lookback periods.
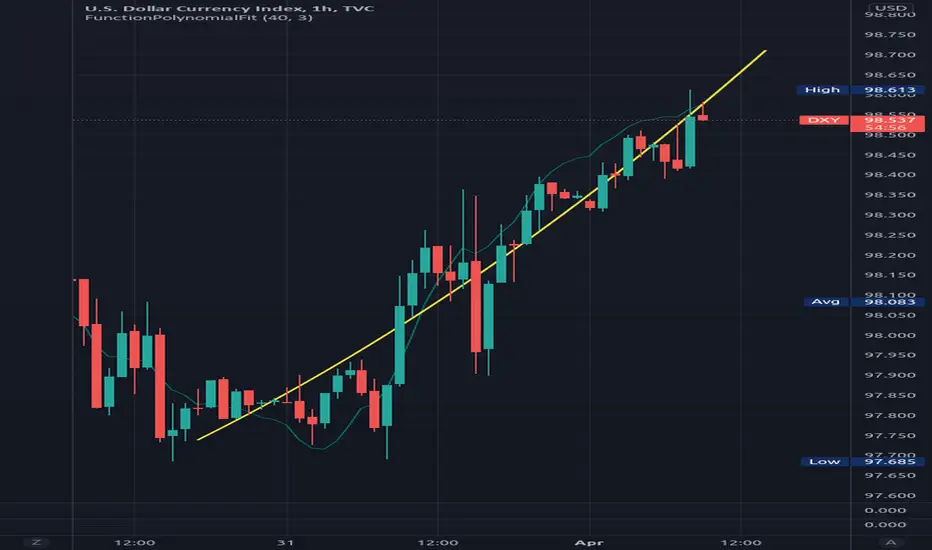
✔ Trend Line
It has editable settings such as lookback period, source, and even color changing. by default, it makes a linear regression for the past 100 candles.
Regression

FunctionPolynomialFitLibrary "FunctionPolynomialFit"
Performs Polynomial Regression fit to data.
In statistics, polynomial regression is a form of regression analysis in which
the relationship between the independent variable x and the dependent variable
y is modelled as an nth degree polynomial in x.
reference:
en.wikipedia.org
www.bragitoff.com
gauss_elimination(A, m, n) Perform Gauss-Elimination and returns the Upper triangular matrix and solution of equations.
Parameters:
A : float matrix, data samples.
m : int, defval=na, number of rows.
n : int, defval=na, number of columns.
Returns: float array with coefficients.
polyfit(X, Y, degree) Fits a polynomial of a degree to (x, y) points.
Parameters:
X : float array, data sample x point.
Y : float array, data sample y point.
degree : int, defval=2, degree of the polynomial.
Returns: float array with coefficients.
note:
p(x) = p * x**deg + ... + p
interpolate(coeffs, x) interpolate the y position at the provided x.
Parameters:
coeffs : float array, coefficients of the polynomial.
x : float, position x to estimate y.
Returns: float.
Smart Reg channel [monpotejulien]This indicator calculates an adaptative regression channel over a specified period or interval.
Resources:
rosettacode.org
en.wikipedia.org

StrengthA mathematically elegant, native & modern way how to measure velocity/ strength/ momentum. As you can see it looks like MACD, but !suddenly! has N times shorter code (disregard the functions), and only 1 parameter instead of 3. OMG HOW DID HE DO IT?!?
MACD: "Let's take one filter (1 parameter), than another filter (2 parameters), then let's take dem difference, then let's place another filter over the difference (3rd parameter + introduction of a nested calculation), and let's write a whole book about it, make thousands of multi-hours YouTube videos about it, and let's never mention about the amount of uncertainty being introduced by multiple parameters & introduction of the nested calculation."
Strength: "let's get real, let's drop a weighted linear regression & usual linear regression over the data of the same length, take dem slopes, then make the difference over these slopes, all good. And then share it with people w/o putting an ® sign".
Fyi, regressions were introduced centuries ago, maybe decades idk, the point is long time ago, and computational power enough to calculate what I'm saying is slightly more than required for macd.
Rationale.
Linearly weighted linear regression has steeper slope (W) than the usual linear regression slope (S) due to the fact that the recent datapoints got more weight. This alone is enough of a metric to measure velocity. But still I've recalled macd and decided to make smth like it cuz I knew it'll might make you happy. I realized that S can be used instead of smoothing the W, thus eliminating the nested calculation and keeping entropy & info loss in place. And see, what we get is natural, simple, makes sense and brings flex. I also wanna remind you that by applying regression we maximize the info gain by using all the data in the window, instead of taking difference between the first and the last datapoints.
This script is dedicated to my friend Fabien. Man, you were the light in the darkness in that company. You'll get your alien green Lambo if you'll really want it, no doubts on my side bout that.
Good hunting

Сatching knivesThis strategy is based on the regression line and volume
The Linear Regression Channel is a three-line technical indicator that displays the high, low and midpoint of the current trend.
How does it work in strategy?
If there is a deviation by a given percentage, the entry occurs
//LOGIC ENTRY
-Length-сhannel length
-Deviation-deviation of the boundaries, the higher , the rarer the entries
-% low for regression-deviation directly from the boundaries, the higher the number, the less frequent the entries
-Required % down bar-additional condition for entry (the candle on which the entry takes place from the logic must necessarily fall by a given percentage)
-Volume-the volume, which must be larger by the number of times you specify ( you can set the volume lower, but for better entries, you need to set the deviation percentages higher!)
//EXIT SETTING
Take profit and stop loss when a certain percentage is reached
//SETTINGS NEXT ENTRY AND GRID
Allow signal lower than,% - the next entry into a trade from logic occurs only when a decrease by a certain percentage
Allow grid,% - when the price drops by the percentage specified in the settings, the entry will take place, but only on the next bar.
//DATA RANGE
-Testing results for any period of time
//
Default settings for infrequent but relatively accurate entries for TF 1 hour.
It costs pyramiding 5 and take profit 5%. Choose the flavors of your choice!
Good luck!

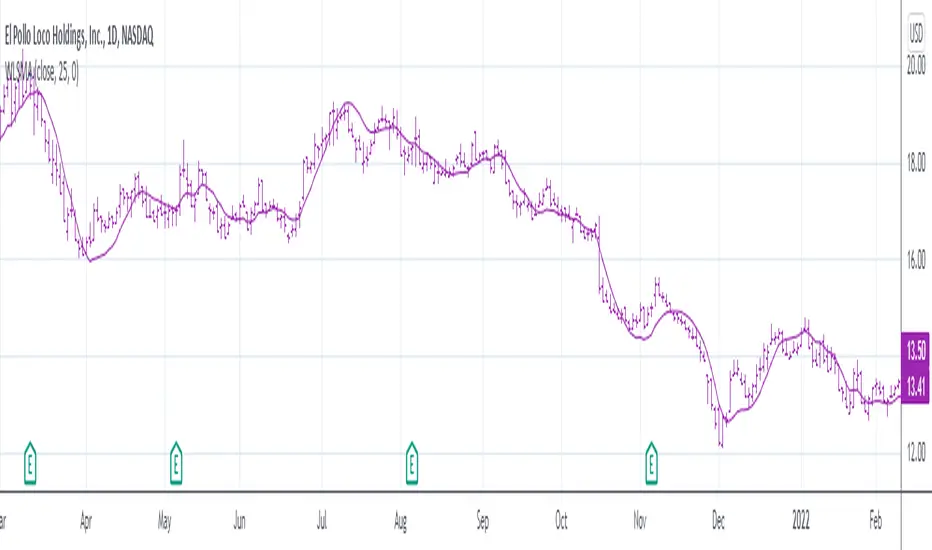
Weighted Least Squares Moving AverageLinearly Weighted Ordinary Least Squares Moving Regression
aka Weighted Least Squares Moving Average -> WLSMA
^^ called it this way just to for... damn, forgot the word
Totally pwns LSMA for some purposes here's why (just look up):
- 'realistically' the same smoothness;
- less lag;
- less overshoot;
- more or less same computationally intensive.
"Pretty cool, huh?", Bucky Roberts©, thenewboston
Now, would you please (just look down) and see the comparison of impulse & step responses:
Impulse responses
Step responses
Ain't it beautiful?
"Motivation behind the concept & rationale", by gorx1
Many been trippin' applying stats methods that require normally distributed data to time series, hence all these B*ll**** Bands and stuff don't really work as it should, while people blame themselves and buy snake oil seminars bout trading psychology, instead of using proper tools. Price... Neither population nor the samples are neither normally nor log-normally distributed. So we can't use all the stuff if we wanna get better results. I'm not talking bout passing each rolling window to a stat test in order to get the proper descriptor, that's the whole different story.
Instead we can leverage the fact that our data is time-series hence we can apply linear weighting, basically we extract another info component from the data and use it to get better results. Volume, range weighting don't make much sense (saying that based on both common sense and test results). Tick count per bar, that would be nice tho... this is the way to measure "intensity". But we don't have it on TV unfortunately.
Anyways, I'm both unhappy that no1 dropped it before me during all these years so I gotta do it myself, and happy that I can give smth cool to every1
Here is it, for you.
P.S.: the script contains standalone functions to calculate linearly weighted variance, linearly weighted standard deviation, linearly weighted covariance and linearly weighted correlation.
Good hunting
Linear Regression Channel - Auto Volume BasedBased on oryginal TV indicator BUT with a little twist. ;)
I really like the regression channel - but the problem is that the length needs to be always manually adjusted.
In this script I try to solve this issue.
This is modified version on TV indicator - Linear Regression Channel.
The main difference is that now you don't get static length - it is automatically adjuested to the recent price action (determined by highest volume in last 300 bars).

Linear Regression Relative Strength[image/x/iZvwDWEY/
Relative Strength indicator comparing the current symbol to SPY (or any other benchmark). It may help to pick the right assets to complement the portfolio build around core ETFs such as SPY.
The general idea is to show if the current symbol outperforms or underperforms the benchmark (SPY by default) when bought some certain time ago. Relative performance is displayed as percent and is calculated for three different time ranges - short (1 mo by default), mid (1 quarter), and long (half a year). To smooth the volatility, the script uses linear regression to estimate the trend and takes the start and the end points of the linear regression line to compute the relative strength.
It is important to remember that the script shows the gain relative to SPY (or other selected benchmark), not the asset's gain. Therefore, it may indicate that the asset is profitable, but it still may lose value if SPY is in downtrend.
Therefore, it is crucial to check other indicators before making a decision. In the example above, standard linear regression for one quarter is used to indicate the direction of the trend.

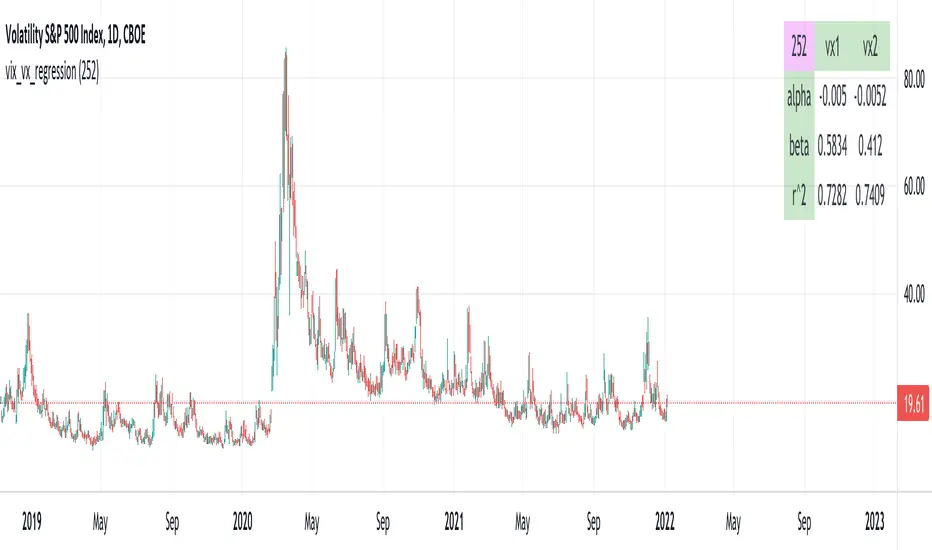
vix_vx_regressionAn example of the linear regression library, showing the regression of VX futures on the VIX. The beta might help you weight VX futures when hedging SPX vega exposure. A VX future has point multiplier of 1000, whereas SPX options have a point multiplier of 100. Suppose the front month VX future has a beta of 0.6 and the front month SPX straddle has a vega of 8.5. Using these approximations, the VX future will underhedge the SPX straddle, since (0.6 * 1000) < (8.5 * 100). The position will have about 2.5 ($250) vega. Use the R^2 (coefficient of determination) to check how well the model fits the relationship between VX and VIX. The further from one this value, the less useful the model.
(Note that the mini, VXM futures also have a 100 point multiplier).
regressLibrary "regress"
produces the slope (beta), y-intercept (alpha) and coefficient of determination for a linear regression
regress(x, y, len) regress: computes alpha, beta, and r^2 for a linear regression of y on x
Parameters:
x : the explaining (independent) variable
y : the dependent variable
len : use the most recent "len" values of x and y
Returns: : alpha is the x-intercept, beta is the slope, an r2 is the coefficient of determination
Note: the chart does not show anything, use the return values to compute model values in your own application, if you wish.

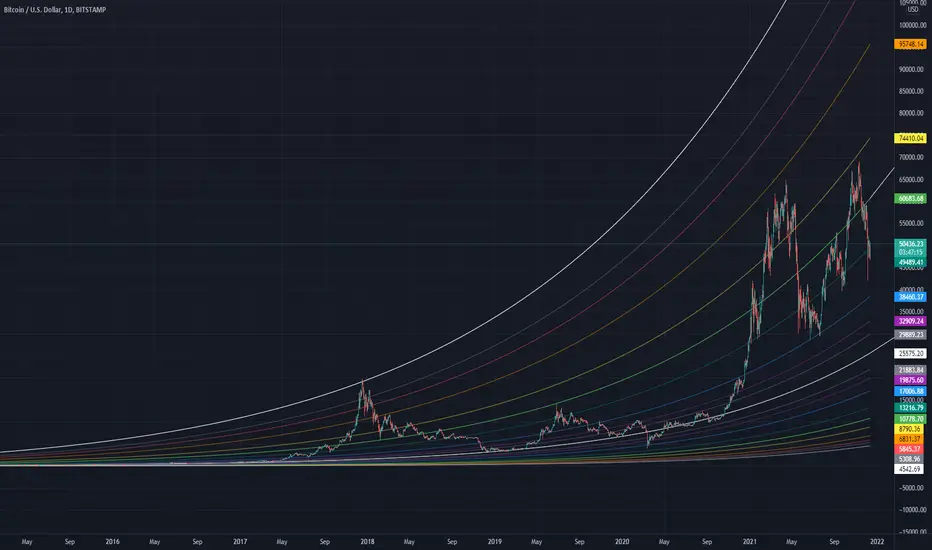
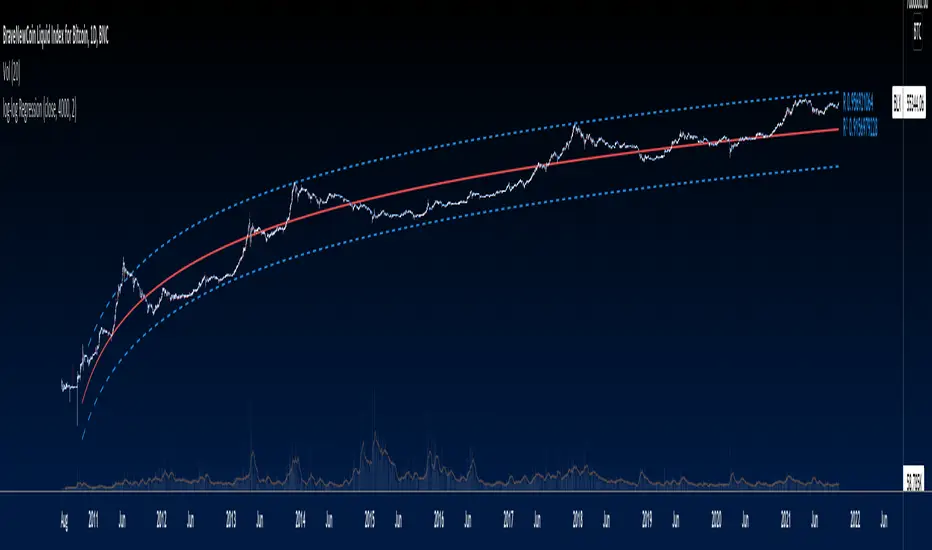
Universal logarithmic growth curves, with support and resistanceLogarithmic regression is used to model data where growth or decay accelerates rapidly at first and then slows over time. This model is for the long term series data (such as 10 years time span).
The user can consider entering the market when the price below 25% or 5% confidence and consider take profit when the price goes above 75% or 95% confidence line.
This script is:
- Designed to be usable in all tickers. (not only for bitcoin now!)
- Logarithmic regression and shows support-resistance level
- Shape of lines are all linear adjustable
- Height difference of levels and zones are customizable
- Support and resistance levels are highlighted
Input panel:
- Steps of drawing: Won't change it unless there are display problems.
- Resistance, support, other level color: self-explanatory.
- Stdev multipliers: A constant variable to adjust regression boundaries.
- Fib level N: Base on the relative position of top line and base line. If you don't want all fib levels, you might set all fib levels = 0.5.
- Linear lift up: vertically lift up the whole set of lines. By linear multiplication.
- Curvature constant: It is the base value of the exponential transform before converting it back to the chart and plotting it. A bigger base value will make a more upward curvy line.
FAQ:
Q: How to use it?
A: Click "Fx" in your chart then search this script to get it into your chart. Then right click the price axis, then select "Logarithmic" scale to show the curves probably.
Q: Why release this script?
A: - This script is intended to to fix the current issues of bitcoins growth curve script, and to provide a better version of the logarithmic curve, which is not only for bitcoin , but for all kinds of tickers.
- In the public library there is a hardcoded logarithmic growth curve by @quantadelic . But unfortunately that curve was hardcoded by his manual inputs, which makes the curve stop updating its value since 2019 the date he publish that code. Many users of that script love using it but they realize it was stop updating, many users out there based on @quantadelic version of "bitcoin logarithmic growth curves" and they tried their best to update the coordinates with their own hardcode input values. Eventually, a lot of redundant hardcoded "Bitcoin growth curve" scripts was born in the public library. Which is not a good thing.
Q: What about looking at the regression result with a log scale price axis?
A: You can use this script that I published in a year ago. This script display the result in a log scale price axis.

Logarithmic Trend ChannelThis indicator automatically draws a regression channel plotted on logarithmic scale from the first quotation.
This model is useful for the long term series data (such as 10 or 20 years time span).
The Pearson correlation measures the strength of the linear relationship between two variables. It has a value between to 1, with a value of 0 meaning no correlation, and + 1 meaning a total positive correlation.
Logarithmic price scales are a type of scale used on a chart, plotted such that two equivalent price changes are represented by the same vertical changes on the scale.
They differ from linear price scales because they display percentage points and not dollar price increases for a stock.
Technical issues
*The user have to pan over the chart from the beginning to the end of the study range (such as 10 years of bars) so the pine script could generate those lines on the chart.
*If on the chart the number of bar is less than the lookback period, it won't generate any lines as well.

KURD_TRADE Bitcoin Fibonacci Log Regressionthis indicatore show fibonacci logarithmic regression for BITCOIN and we can analyse the crypto market with it.
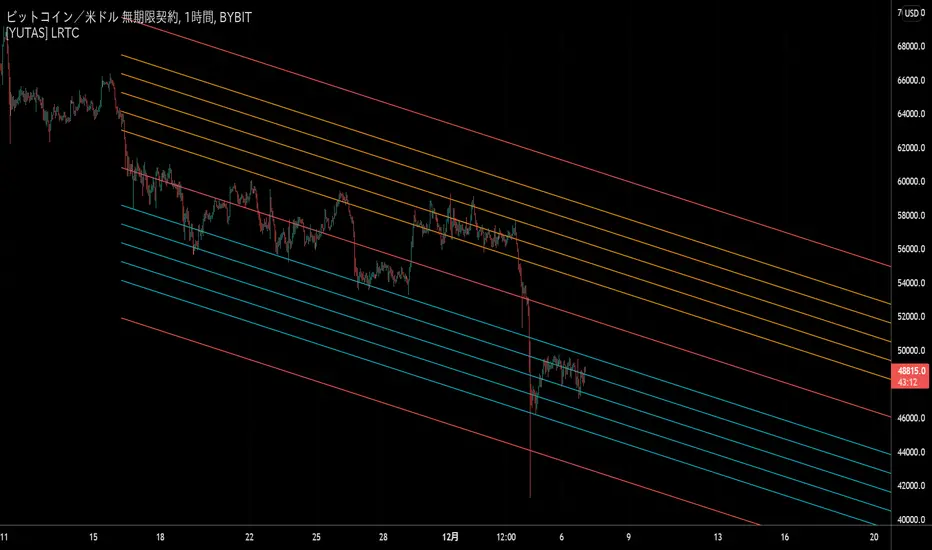
[YUTAS] Linear Regression Trend Channel
・Indicator for linear regression channel.
・Multiple deviations can be displayed.
・The color changes by reading the angle of the center line according to the direction of the market.
Rising market → blue
Down market → Red
----------------------------------------------
・線形回帰チャネルのインジケーター。
・偏差を複数表示可能。
・相場の向きに合わせてセンターラインの角度を読み取り色が変わります。
上げ相場 → 青
下げ相場 → 赤
[cache_that_pass] 1m 15m Function - Weighted Standard DeviationTradingview Community,
As I progress through my journey, I have come to the realization that it is time to give back. This script isn't a life changer, but it has the building blocks for a motivated individual to optimize the parameters and have a production script ready to go.
Credit for the indicator is due to @rumpypumpydumpy
I adapted this indicator to a strategy for crypto markets. 15 minute time frame has worked best for me.
It is a standard deviation script that has 3 important user configured parameters. These 3 things are what the end user should tweak for optimum returns. They are....
1) Lookback Length - I have had luck with it set to 20, but any value from 1-1000 it will accept.
2) stopPer - Stop Loss percentage of each trade
3) takePer - Take Profit percentage of each trade
2 and 3 above are where you will see significant changes in returns by altering them and trying different percentages. An experienced pinescript programmer can take this and build on it even more. If you do, I ask that you please share the script with the community in an open-source fashion.
It also already accounts for the commission percentage of 0.075% that Binance.US uses for people who pay fees with BNB.
How it works...
It calculates a weighted standard deviation of the price for the lookback period set (so 20 candles is default). It recalculates each time a new candle is printed. It trades when price lows crossunder the bottom of that deviation channel, and sells when price highs crossover the top of that deviation channel. It works best in mid to long term sideways channels / Wyckoff accumulation periods.

Ripple (XRP) Model PriceAn article titled Bitcoin Stock-to-Flow Model was published in March 2019 by "PlanB" with mathematical model used to calculate Bitcoin model price during the time. We know that Ripple has a strong correlation with Bitcoin. But does this correlation have a definite rule?
In this study, we examine the relationship between bitcoin's stock-to-flow ratio and the ripple(XRP) price.
The Halving and the stock-to-flow ratio
Stock-to-flow is defined as a relationship between production and current stock that is out there.
SF = stock / flow
The term "halving" as it relates to Bitcoin has to do with how many Bitcoin tokens are found in a newly created block. Back in 2009, when Bitcoin launched, each block contained 50 BTC, but this amount was set to be reduced by 50% every 210,000 blocks (about 4 years). Today, there have been three halving events, and a block now only contains 6.25 BTC. When the next halving occurs, a block will only contain 3.125 BTC. Halving events will continue until the reward for minors reaches 0 BTC.
With each halving, the stock-to-flow ratio increased and Bitcoin experienced a huge bull market that absolutely crushed its previous all-time high. But what exactly does this affect the price of Ripple?
Price Model
I have used Bitcoin's stock-to-flow ratio and Ripple's price data from April 1, 2014 to November 3, 2021 (Daily Close-Price) as the statistical population.
Then I used linear regression to determine the relationship between the natural logarithm of the Ripple price and the natural logarithm of the Bitcoin's stock-to-flow (BSF).
You can see the results in the image below:
Basic Equation : ln(Model Price) = 3.2977 * ln(BSF) - 12.13
The high R-Squared value (R2 = 0.83) indicates a large positive linear association.
Then I "winsorized" the statistical data to limit extreme values to reduce the effect of possibly spurious outliers (This process affected less than 4.5% of the total price data).
ln(Model Price) = 3.3297 * ln(BSF) - 12.214
If we raise the both sides of the equation to the power of e, we will have:
============================================
Final Equation:
■ Model Price = Exp(- 12.214) * BSF ^ 3.3297
Where BSF is Bitcoin's stock-to-flow
============================================
If we put current Bitcoin's stock-to-flow value (54.2) into this equation we get value of 2.95USD. This is the price which is indicated by the model.
There is a power law relationship between the market price and Bitcoin's stock-to-flow (BSF). Power laws are interesting because they reveal an underlying regularity in the properties of seemingly random complex systems.
I plotted XRP model price (black) over time on the chart.
Estimating the range of price movements
I also used several bands to estimate the range of price movements and used the residual standard deviation to determine the equation for those bands.
Residual STDEV = 0.82188
ln(First-Upper-Band) = 3.3297 * ln(BSF) - 12.214 + Residual STDEV =>
ln(First-Upper-Band) = 3.3297 * ln(BSF) – 11.392 =>
■ First-Upper-Band = Exp(-11.392) * BSF ^ 3.3297
In the same way:
■ First-Lower-Band = Exp(-13.036) * BSF ^ 3.3297
I also used twice the residual standard deviation to define two extra bands:
■ Second-Upper-Band = Exp(-10.570) * BSF ^ 3.3297
■ Second-Lower-Band = Exp(-13.858) * BSF ^ 3.3297
These bands can be used to determine overbought and oversold levels.
Estimating of the future price movements
Because we know that every four years the stock-to-flow ratio, or current circulation relative to new supply, doubles, this metric can be plotted into the future.
At the time of the next halving event, Bitcoins will be produced at a rate of 450 BTC / day. There will be around 19,900,000 coins in circulation by August 2025
It is estimated that during first year of Bitcoin (2009) Satoshi Nakamoto (Bitcoin creator) mined around 1 million Bitcoins and did not move them until today. It can be debated if those coins might be lost or Satoshi is just waiting still to sell them but the fact is that they are not moving at all ever since. We simply decrease stock amount for 1 million BTC so stock to flow value would be:
BSF = (19,900,000 – 1.000.000) / (450 * 365) =115.07
Thus, Bitcoin's stock-to-flow will increase to around 115 until AUG 2025. If we put this number in the equation:
Model Price = Exp(- 12.214) * 114 ^ 3.3297 = 36.06$
Ripple has a fixed supply rate. In AUG 2025, the total number of coins in circulation will be about 56,000,000,000. According to the equation, Ripple's market cap will reach $2 trillion.
Note that these studies have been conducted only to better understand price movements and are not a financial advice.

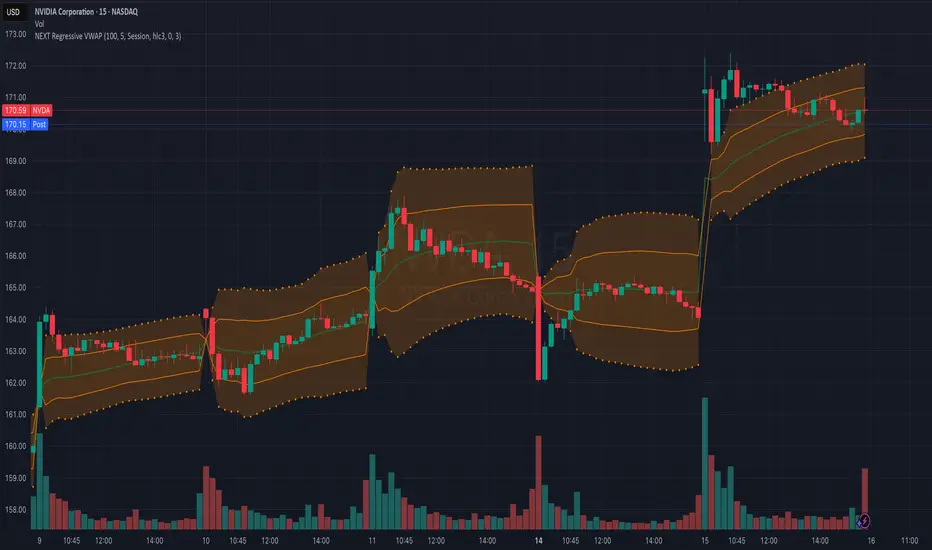
NEXT Regressive VWAPOverview:
This version of the Volume-Weighted Average Price (VWAP) indicator features an extended algorithm, which, in addition to volume and price, also incorporates regression analysis. The result is a more responsive, often leading VWAP slope with a degree of statistical predictability built in. Just like with the original VWAP, NEXT Regressive VWAP offers two optional Standard Deviation bands that parallel it. These can be set to any deviation level, with the default being 1 and -1, indicating one standard deviation above and one below Regressive VWAP, respectively.
Below is a screenshot comparing NEXT Regressive VWAP (green) to the original VWAP (blue) on CME_MINI:ES1! M3 chart.
Application and Strategy Ideas:
Price above NEXT Regressive VWAP is interpreted to have a bullish bias, and below, bearish. You can use TradingView's native Set Alert functionality to be notified, in real-time, when price crosses Regressive VWAP, and/or any of its standard deviation bands. Another popular "probability play" strategy is to scalp price when it crosses under the upper band (short) and crosses over the lower band (long). The screenshot below visualizes such a strategy on NASDAQ:QQQ M1 chart:
Input Parameters:
There are 3 groups of input.
Regression Settings
Length - controls the length of time (in bars) for regression analysis with higher values yielding smoother, more responsive values.
Regression Weighting - controls the degree of regression analysis incorporated into VWAP, with 5 being average, 0-4 less, 6-10 more. The higher the value, the more responsive the Regressive VWAP curve.
VWAP Settings
Anchor Period - controls the origin of VWAP calculations, start of session being the default.
Source - data used for calculating the VWAP, typically HLC/3, but can be used with other price formats and data sources as well.
Offset - shifting of the VWAP line forward (+) or backward (-).
Standard Deviation Bands Settings
Calculate Bands - checking this will add 2 bands, each equidistant (by the amount of Multiplier) from the NEXT Regressive VWAP line.
Bands Multiplier - standard deviation multiplier, with 1 being the default
Signals and Alerts:
Here is how to set price (close) crossing NEXT Regressive VWAP alerts: open a chart, attach NEXT Regressive VWAP, and right-click on chart -> Add Alert. Condition: Symbol e.g. ES (close) >> Crossing >> Regressive VWAP >> VWAP >> Once Per Bar Close.
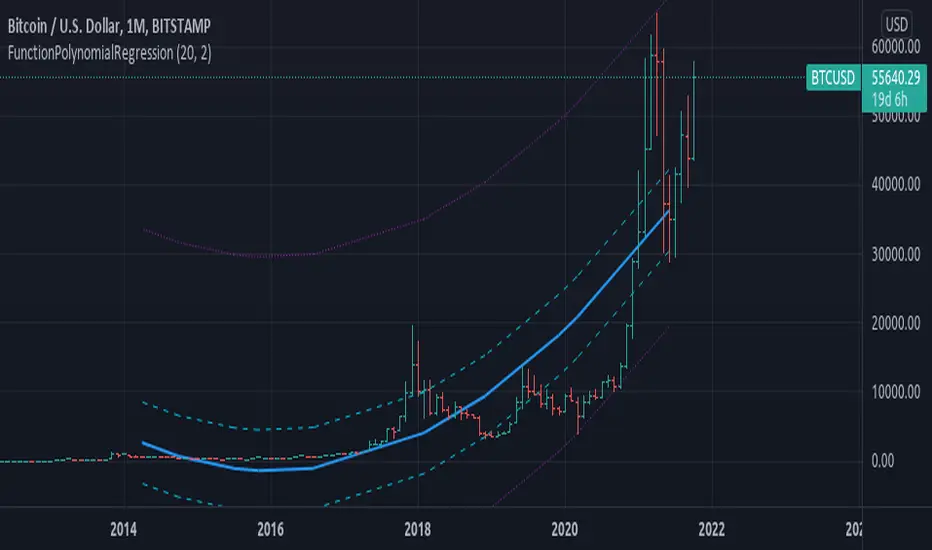
Polynomial Regression Style Examplejust a example on how to edit line style on the output of the polynomial regression library..

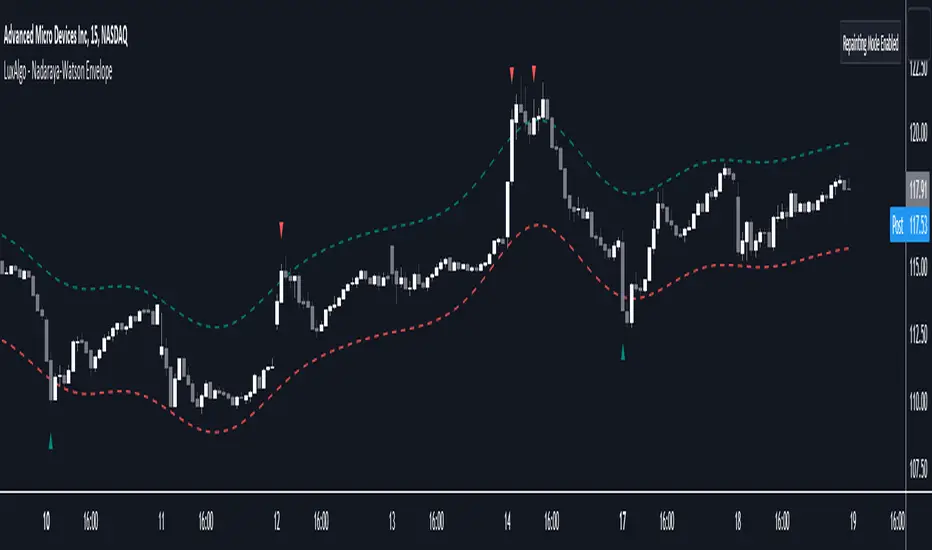
Nadaraya-Watson Envelope [LuxAlgo]This indicator builds upon the previously posted Nadaraya-Watson smoothers. Here we have created an envelope indicator based on Kernel Smoothing with integrated alerts from crosses between the price and envelope extremities. Unlike the Nadaraya-Watson estimator, this indicator follows a contrarian methodology.
Please note that by default this indicator can be subject to repainting. Users can use a non-repainting smoothing method available from the settings. The triangle labels are designed so that the indicator remains useful in real-time applications.
🔶 USAGE
🔹 Non Repainting
This tool can outline extremes made by the prices. This is achieved by estimating the underlying trend in the price, then calculating the mean absolute deviations from it, the obtained result is added/subtracted to the estimated underlying trend.
The non-repainting method estimates the underlying trend in price using an "endpoint Nadaraya-Watson estimator", and would return similar results to more classical band indicators.
🔹 Repainting
The repainting method makes use of the Nadaraya-Watson estimator to estimate the underlying trend in the price. The construction of the band extremities is the same as in the non-repainting method.
We can expect the price to reverse when crossing one of the envelope extremities. Crosses between the price and the envelopes extremities are indicated with triangles on the chart.
For real-time applications, triangles are always displayed when a cross occurs and remain displayed at the location it first appeared even if the cross is no longer visible after a recalculation of the envelope.
By popular demand, we have integrated alerts for this indicator from the crosses between the price and the envelope extremities. However, we do not recommend this precise method to be used alone or for solely real-time applications. We do not have data supporting the performance of this tool over more classical bands/envelope/channels indicators.
🔶 SETTINGS
Bandwidth: Controls the degree of smoothness of the envelopes, with higher values returning smoother results.
Mult: Controls the envelope width.
Source: Input source of the indicator.
Repainting Smoothing: Determine if a repainting or non-repainting method should be used for the calculation of the indicator.
🔶 RELATED SCRIPTS
For more information on the Nadaraya-Watson estimator see:
FunctionPolynomialRegressionLibrary "FunctionPolynomialRegression"
TODO:
polyreg(sample_x, sample_y) Method to return a polynomial regression channel using (X,Y) sample points.
Parameters:
sample_x : float array, sample data X points.
sample_y : float array, sample data Y points.
Returns: tuple with:
_predictions: Array with adjusted Y values.
_max_dev: Max deviation from the mean.
_min_dev: Min deviation from the mean.
_stdev/_sizeX: Average deviation from the mean.
draw(sample_x, sample_y, extend, mid_color, mid_style, mid_width, std_color, std_style, std_width, max_color, max_style, max_width) Method for drawing the Polynomial Regression into chart.
Parameters:
sample_x : float array, sample point X value.
sample_y : float array, sample point Y value.
extend : string, default=extend.none, extend lines.
mid_color : color, default=color.blue, middle line color.
mid_style : string, default=line.style_solid, middle line style.
mid_width : int, default=2, middle line width.
std_color : color, default=color.aqua, standard deviation line color.
std_style : string, default=line.style_dashed, standard deviation line style.
std_width : int, default=1, standard deviation line width.
max_color : color, default=color.purple, max range line color.
max_style : string, default=line.style_dotted, max line style.
max_width : int, default=1, max line width.
Returns: line array.
log-log Regression From ArraysCalculates a log-log regression from arrays. Due to line limits, for sets greater than the limit, only every nth value is plotted in order to cover the entire set.
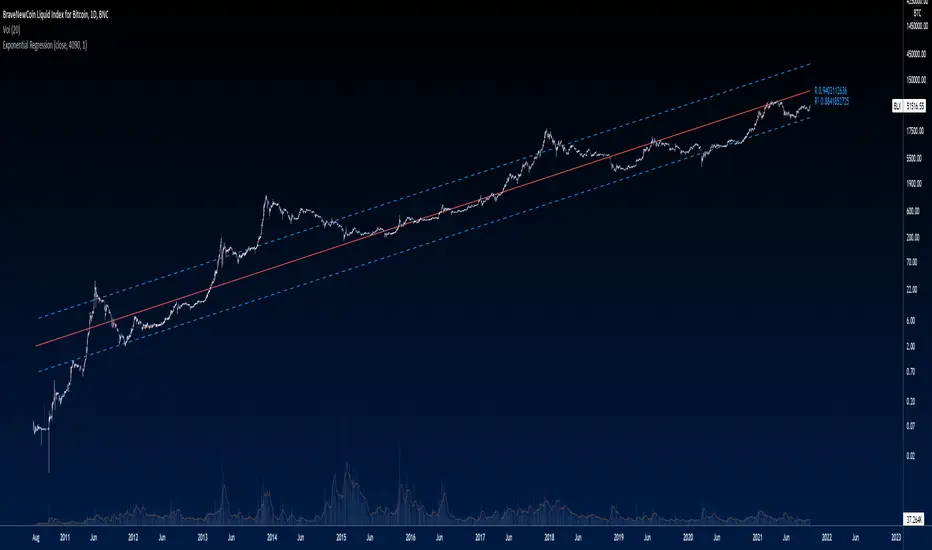
Exponential Regression From ArraysCalculates an exponential regression from arrays. Due to line limits, for sets greater than the limit, only every nth value is plotted in order to cover the entire set.
Nadaraya-Watson Smoothers [LuxAlgo]The following tool smoothes the price data using various methods derived from the Nadaraya-Watson estimator, a simple Kernel regression method. This method makes use of the Gaussian kernel as a weighting function.
Users have the option to use a non-repainting as well as a repainting method, see the USAGE section for more information.
🔶 USAGE
🔹 Non Repainting
When Repainting Smoothing is disabled the returned indicator acts similarly to a regular causal moving average. This result could be described as an "endpoint Nadaraya-Watson estimator".
Unlike a regular moving average whose degree of smoothness is commonly determined by the length of its calculation window, the degree of smoothness of the proposed indicator is determined by the bandwidth setting, with a higher value returning smoother results.
In the above chart, a bandwidth value of 50 is used. An increasing value of the smoother is indicative of an uptrend, while a decreasing value is indicative of a downtrend.
🔹 Repainting
Non-causal smoothing methods have found low support from technical analysts because they tend to repaint. Yet, they can provide powerful insights such as estimating underlying trends in the price as well as seeing how far prices deviate from them. They can also make drawing certain patterns easier and can help see underlying structures in the price more clearly.
Using higher bandwidth values allows for estimating longer-term trends in the price.
Triangular labels highlight points where the direction of the estimator change. This allows for the identification of tops and bottoms in the underlying trend which can be compared to the actual price tops and bottoms.
Note that multiple labels can appear in real time, highlighting real-time changes in the estimator's direction. The most recent label on a series of labels is the first to appear. This can eventually be useful for the real-time predictive application of the estimator. However, it is not a usage we particularly recommend.
🔶 DETAILS
The Nadaraya-Watson estimator can be described as a series of weighted averages using a specific normalized kernel as a weighting function. For each point of the estimator at time t , the peak of the kernel is located at time t , as such the highest weights are attributed to values neighboring the price located at time t .
A lower bandwidth value would contribute toward a more important weighting of the price at a precise point and would as such less smooth results. In the case where our bandwidth is so small that the resulting kernel is just an impulse, we would get the raw price back.
However, when the bandwidth is sufficiently large, prices would be weighted similarly, thus resulting in a result closer to the price mean.
It can be interesting to note that due to the nature of the estimator and its weighting procedure, real-time results would not deviate drastically for points in the estimator near the center of the calculation window.
🔶 SETTINGS
Bandwidth : controls the bandwidth of the Gaussian kernel, with higher values returning smoother results.
Src : Input source of the kernel regression.
Repainting Smoothing : Determine if the smoothing method should repaint or not. If disabled the "endpoint Nadaraya-Watson estimator" is returned.
