RSI with 3 Separate Smoothing AveragesRSI has 3 moving averages, to help trade better
RSI period can be adjusted
Moving average has multiple selections (SMA, EMA, HMA)
moving average cross over can be used as signal for trades
Trade at your own risk
مؤشر القوى النسبية

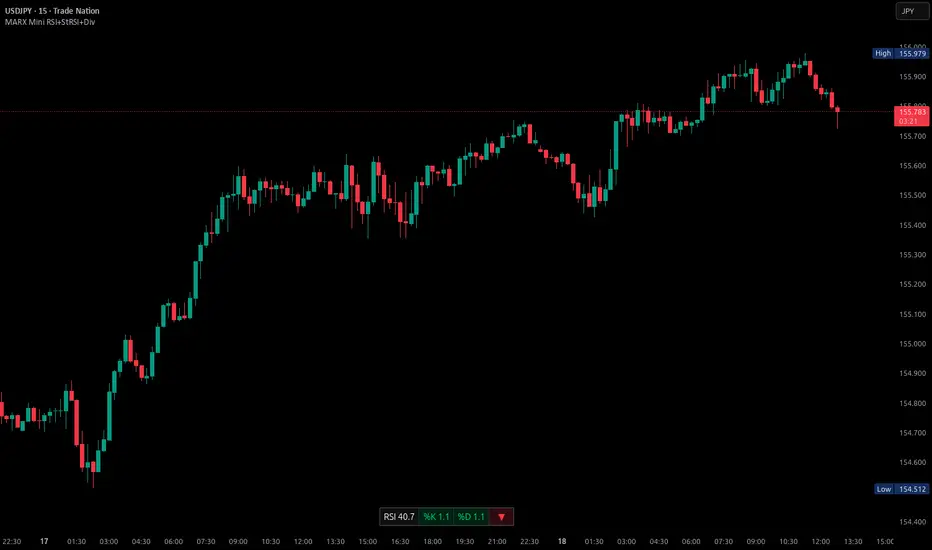
Mini RSI+STOCH-RSI+RSI-DIVERGENCE @Marx_CapitalMini version of RSI + STOCHASTIC-RSI with RSI-Divergence detection - all in one, adjustable small table overlayed on your chart. The table box gives RSI and Stoch-RSI values and signals detected RSI divergences.
Uncheck 'Update only on bar close' in indicator settings if the box does not appear right away.
RSI Distribution [Kodexius]RSI Distribution is a statistics driven visualization companion for the classic RSI oscillator. In addition to plotting RSI itself, it continuously builds a rolling sample of recent RSI values and projects their distribution as a forward drawn histogram, so you can see where RSI has spent most of its time over the selected lookback window.
The indicator is designed to add context to oscillator readings. Instead of only treating RSI as a single point estimate that is either “high” or “low”, you can evaluate the current RSI level relative to its own recent history. This makes it easier to recognize when the market is operating inside a familiar regime, and when RSI is pushing into rarer tail conditions that tend to appear during momentum bursts, exhaustion, or volatility expansion.
To complement the histogram, the script can optionally overlay a Gaussian curve fitted to the sample mean and standard deviation. It also runs a Jarque Bera normality check, based on skewness and excess kurtosis, and surfaces the result both visually and in a compact dashboard. On the oscillator panel itself, RSI is presented with a clean gradient line and standard overbought and oversold references, with fills that become more visible when RSI meaningfully extends beyond key thresholds.
🔹 Features
1. Distribution Histogram of Recent RSI Values
The script stores the last N RSI values in an internal sample and uses that rolling window to compute a frequency distribution across a user selected number of bins. The histogram is drawn into the future by a configurable width in bars, which keeps it readable and prevents it from colliding with the active RSI plot. The result is a compact visual summary of where RSI clusters most often, whether it is spending more time near the center, or shifting toward higher or lower regimes.
2. Gaussian Overlay for Shape Intuition
If enabled, a fitted bell curve is drawn on top of the histogram using the sample mean and standard deviation. This overlay is not intended as a direct trading signal. Its purpose is to provide a fast visual comparator between the empirical RSI distribution and a theoretical normal shape. When the histogram diverges strongly from the curve, you can quickly spot skew, heavy tails, or regime changes that often occur when market structure or volatility conditions shift.
3. Jarque Bera Normality Check With Clear PASS/FAIL Feedback
The script computes skewness and excess kurtosis from the RSI sample, then forms the Jarque Bera statistic and compares it to a fixed 95% critical value. When the distribution is closer to normal under this test, the status is marked as PASS, otherwise it is marked as FAIL. This result is displayed in the dashboard and can also influence the histogram styling, giving immediate feedback about whether the recent RSI behavior resembles a bell shaped distribution or a more distorted, regime driven profile.
Jarque Bera is a goodness of fit test that evaluates whether a dataset looks consistent with a normal distribution by checking two shape properties: skewness (asymmetry) and kurtosis (tail heaviness, expressed here as excess kurtosis where a perfect normal has 0). Under the null hypothesis of normality, skewness should be near 0 and excess kurtosis should be near 0. The test combines deviations in both into a single statistic, which is then compared to a chi square threshold. A PASS in this script means the sample does not show strong evidence against normality at the chosen threshold, while a FAIL means the sample is meaningfully skewed, heavy tailed, or both. In practical trading terms, a FAIL often suggests RSI is behaving in a regime where extremes and asymmetry are more common, which is typical during strong trends, volatility expansions, or one sided market pressure. It is still a statistical diagnostic, not a prediction tool, and results can vary with lookback length and market conditions.
4. Integrated Stats Dashboard
A compact table in the top right summarizes key distribution moments and the normality result: Mean, StdDev, Skewness, Kurtosis, and the JB statistic with PASS/FAIL text. Skewness is color coded by sign to quickly distinguish right skew (more time at higher RSI) versus left skew (more time at lower RSI), which can be helpful when diagnosing trend bias and momentum persistence.
5. RSI Visual Quality and Context Zones
RSI is plotted with a gradient color scheme and standard overbought and oversold reference lines. The overbought and oversold areas are filled with a smart gradient so visual emphasis increases when RSI meaningfully extends beyond the 70 and 30 regions, improving readability without overwhelming the panel.
🔹 Calculations
This section summarizes the main calculations and transformations used internally.
1. RSI Series
RSI is computed from the selected source and length using the standard RSI function:
rsi_val = ta.rsi(rsi_src, rsi_len)
2. Rolling Sample Collection
A float array stores recent RSI values. Each bar appends the newest RSI, and if the array exceeds the configured lookback, the oldest value is removed. Conceptually:
rsi_history.push(rsi_val)
if rsi_history.size() > lookback
rsi_history.shift()
This maintains a fixed size window that represents the most recent RSI behavior.
3. Mean, Variance, and Standard Deviation
The script computes the sample mean across the array. Variance is computed as sample variance using (n - 1) in the denominator, and standard deviation is the square root of that variance. These values serve both the dashboard display and the Gaussian overlay parameters.
4. Skewness and Excess Kurtosis
Skewness is calculated from the standardized third central moment with a small sample correction. Kurtosis is computed as excess kurtosis (kurtosis minus 3), so the normal baseline is 0. These two metrics summarize asymmetry and tail heaviness, which are the core ingredients for the Jarque Bera statistic.
5. Jarque Bera Statistic and Decision Rule
Using skewness S and excess kurtosis K, the Jarque Bera statistic is computed as:
JB = (n / 6.0) * (S^2 + 0.25 * K^2)
Normality is flagged using a fixed critical value:
is_normal = JB < 5.991
This produces a simple PASS/FAIL classification suitable for fast chart interpretation.
6. Histogram Binning and Scaling
The RSI domain is treated as 0 to 100 and divided into a configurable number of bins. Bin size is:
bin_size = 100.0 / bins
Each RSI sample maps to a bin index via floor(rsi / bin_size), with clamping to ensure the index stays within valid bounds. The script counts occurrences per bin, tracks the maximum frequency, and normalizes each bar height by freq/max_freq so the histogram remains visually stable and comparable as the window updates.
7. Gaussian Curve Overlay (Optional)
The Gaussian overlay uses the normal probability density function with mu as the sample mean and sigma as the sample standard deviation:
normal_pdf(x) = (1 / (sigma * sqrt(2*pi))) * exp(-0.5 * ((x - mu)/sigma)^2)
For drawing, the script samples x across the histogram width, evaluates the PDF, and normalizes it relative to its peak so the curve fits within the same visual height scale as the histogram.

Ai Kavach by Pooja v16✅ Fakeout Kavach by Pooja — Smart Fake Breakout Protector
Fakeout Kavach is designed to help traders understand when a breakout is strong and when it is likely to be a trap.
It works as a confirmation and filtering system, giving you a clear view of market strength, momentum, volume pressure, and potential reversal signs — without providing buy/sell recommendations.
This is a support tool for traders who want cleaner entries, fewer trap trades, and better clarity in fast-moving markets.This tool adds an intelligent multi-layer confirmation system on your chart so you can quickly understand:
✔ When the breakout is real
✔ When the market has strength
✔ When momentum is fading
✔ And when you should simply avoid the move
It doesn’t give buy/sell calls.
Instead, it helps you decide “Should I trust this move or not?”
⭐ Core Features (Explained in Simple Language)
🔹 1. Fake Breakout Filter (RSI + MA Logic)
Fakeouts often happen when price shows strength but momentum does not.
This module checks:
RSI strength
RSI–MA crossover behaviour
Momentum direction
Push/rejection zones
📌 Benefit:
Quickly see if the breakout has real strength behind it or it’s just a trap candle.
🔹 2. Trend Strength Filter (ADX Protection)
Most traders lose money in sideways markets.
ADX Filter helps you understand whether the market actually has trend strength or not.
📌 Benefit:
Avoid taking trades when the market is weak, choppy, or directionless.
Only focus on moves backed by strength.
🔹 3. SB/SS Smart Confirmation
SB (Strong Break) and SS (Strong Slide) confirmations highlight alignment between:
Momentum
Trend
Strength
RSI structure
📌 Benefit:
Cleaner entries, fewer false triggers, and more confidence in the move you take.
🔹 4. Divergence Detection (RSI Based)
Catches early signs of:
Bullish reversal
Bearish reversal
Exhaustion at highs/lows
📌 Benefit:
Helps you avoid entering at the worst possible points and improves exit timing.
🔹 5. VAD Module (Volume + ATR + Delta Pressure)
Fake moves usually have weak volume or no volatility.
This module checks:
Volume strength
Volatility (ATR)
Buying/selling pressure (Delta)
📌 Benefit:
Helps you understand whether the breakout is backed by real buyer/seller pressure.
🔹 6. Session Protection
Opening candles can be noisy and unpredictable.
Session block lets you avoid signals during high volatility windows.
📌 Benefit:
No more taking wrong entries during the rush at market open.
🔹 7. Fully Modular – Use Only What YOU Need
Every feature has its own ON/OFF switch.
You can create your perfect setup by enabling only what you prefer.
📌 Benefit:
Suitable for scalpers, intraday traders, swing traders, and even beginners.
🎨 Customization Power — Fully Modular Design
✔ Every section of Fakeout Kavach has its own ON/OFF toggle:
✔ Turn RSI visuals on/off
✔ Enable or disable MA & fills
✔ Activate or hide divergences
✔ Use or ignore ADX trend filter
✔ Show or hide SB/SS signals
✔ Enable or disable session block
✔ Choose label style, shapes, colors, sizes
✔ Keep chart clean or run full analysis mode
✔ You decide what appears.
✔ You control the complexity.
✔ One indicator fits all types of traders.
🌍 Works Across All Markets
✔ Stocks
✔ Crypto
✔ Forex
✔ Commodities
✔ Indices
All timeframes from scalping to swing trading.
⭐ What This Indicator Helps You With
Avoiding trap candles
✔ Understanding when a move is strong or weak
✔ Filtering bad breakouts
✔ Confirming market structure with momentum
✔ Spotting reversal signs early
✔ Building confidence in your entries
✔ Staying out of sideways/no-volume zones
🛠 Support
For indicator-related questions, clarification, or feature suggestions, you can contact the creator through TradingView’s comment section or direct message.
⚠ Disclaimer (TradingView Policy Safe)
This indicator does not provide buy/sell signals, does not predict market movements, and does not guarantee results or profitability.
It is a technical analysis tool intended to assist traders in making their own trading decisions.
Always use proper risk management and follow your own trading plan.

AI Intraday Astra by Pooja v27📘 AI Intraday Astra v27
Invite-Only Intraday Indicator for Option Traders
🔍 What this indicator does (Purpose)
AI Intraday Astra v27 is a rule-based intraday signal-filtering indicator designed to reduce false breakouts, repeated entries, and low-energy trades commonly faced by option traders.
Unlike traditional indicators that generate frequent signals, this script focuses on signal validation and rejection, producing trades only when multiple market conditions align on the same confirmed candle.
⭐ What makes this indicator ORIGINAL
This script is not a simple combination of indicators.
It uses a state-based decision architecture, where signals are allowed only after passing multiple sequential checks and internal reset rules.
Key originality points:
Independent BUY and SELL engines (no shared oscillator state)
State tracking to control signal eligibility
Reset-based logic after every signal
Multi-layer filtering instead of single-condition triggers
This design differentiates it from standard RSI, EMA, or Supertrend-based scripts.
⚙️ Core Features (Explained Clearly)
🔹 Auto BUY / SELL Signals (Confirmed Only)
Signals trigger only after candle close and only when all filters align.
No intrabar repainting or blinking signals.
🔹 Dual RSI Engine (Buy & Sell Separation)
Separate RSI + RSI-MA logic for Buy and Sell
Minimum RSI-MA distance filter
Directional slope validation
Signal gap control
➡️ Prevents mixed or weak momentum signals.
🔹 ADX + ATR Volatility Filter
ADX confirms directional strength
ATR confirms sufficient intraday volatility
➡️ Blocks signals during sideways or low-energy markets.
🔹 EMA + VWAP Trend Alignment
BUY only above EMA & VWAP
SELL only below EMA & VWAP
➡️ Avoids counter-trend option entries.
🔹 Trendline-Based Structure Filter
Dynamic trendlines derived from swing highs/lows
Optional slope modes (ATR / Stdev / Linear Regression)
Signals allowed only near relevant structure
➡️ Prevents chasing overextended prices.
🔹 Pivot Points (Support & Resistance Context)
Traditional pivot levels
Multi-timeframe calculation
Optional price labels
➡️ Used for context, not direct signal generation.
🔹 Reset & Anti-Overtrading Logic
After a signal:
Price must break and re-accept across EMA
Minimum bars enforced between same-side signals
➡️ Controls over-trading in strong trends.
🔹 Session Filter
Optional disabling of signals during selected intraday time windows
(e.g. noisy market open).
🧠 About “AI”
This script does not use machine learning or prediction models.
“AI” refers to a rule-based decision system that evaluates multiple market conditions together and allows a signal only when all rules remain valid until candle close.
🔔 Alerts
BUY / SELL alerts on confirmed signals only
Webhook-compatible
No repaint behavior
👤 Who this is for
Intraday option traders
Traders who prefer quality over quantity
Rule-based and confirmation-driven setups
🔒 Why Invite-Only
The script contains internal state management, reset logic, and independent signal engines that go beyond standard indicator combinations.
Source access is restricted to protect this implementation.
⚠️ Disclaimer
This indicator is for educational and analytical purposes only.
It does not provide financial advice or profit guarantees.
Users are responsible for their own risk management.


MSP Setup Scanner Bullish BearishIdentify High-Probability Trading Setups at a Glance
This indicator combines multiple technical factors into a single, easy-to-read score that helps you quickly identify bullish and bearish opportunities across any market.
What It Analyzes:
- Trend Direction: EMA 20/50/200 alignment and price position
- Momentum: RSI overbought/oversold levels with trend confirmation
- MACD: Crossovers and histogram direction
- Volume: Above-average volume for move confirmation
- Breakouts: New highs/lows detection
Mobile-Ready Design:
- Clean, compact table display optimized for mobile TradingView
- Color-coded bias indicator (Strong Bullish to Strong Bearish)
- Works perfectly on all screen sizes
Score System:
+40 to +100: Strong bullish setup
+1 to +39: Bullish bias
0: Neutral
-1 to -39: Bearish bias
-40 to -100: Strong bearish setup
Features:
- On-chart signals (Up Arrow Buy / Down Arrow Sell)
- Customizable alert conditions
- Works on all timeframes and instruments
- Lightweight and fast-loading
Best Used For:
- Swing trading confirmation
- Intraday momentum plays
- Screening watchlists for A+ setups
- Multi-timeframe confluence analysis
Not financial advice. Always use proper risk management.

WTI Scalp Signals @RADUVEGAWTI Scalp Signals Pro V1.3
Description:
Overview This indicator is a specialized mean-reversion tool designed specifically for the high volatility of the Crude Oil (WTI) market. It combines momentum exhaustion (using a fast RSI) with classic Price Action patterns to identify high-probability scalping opportunities.
Unlike standard indicators that use generic settings, this script has been tuned to react to the "whipsaw" nature of modern energy markets.
Key Features & Logic
Optimized RSI Settings: Uses a 9-period RSI (instead of the standard 14) to catch rapid momentum shifts.
Asymmetric Levels: Tuned with a Sell Threshold at 65 and a Buy Threshold at 25. This asymmetry reflects the market's tendency to drop sharper than it rises (panic selling vs. accumulation).
Pattern Recognition: The script validates RSI signals only when confirmed by specific candlestick patterns:
Bullish/Bearish Engulfing
Hammer / Shooting Star
2-Bar Reversals
Smart Stacking Technology (v1.2): Includes a custom logic to prevent label overlapping. If multiple signals occur on the same bar (e.g., a "Sell" signal + a "Shooting Star"), the labels automatically stack vertically so the chart remains clean and readable.
How to Use
Timeframe: Best used on lower timeframes (1m, 5m, 15m) for scalping sessions.
Sell Signals (Red/Maroon): Look for these during rapid price pumps. The script identifies when price is overextended (RSI > 65) and prints a bearish candle pattern.
Buy Signals (Green): Look for these during sharp sell-offs. The script waits for the RSI to dip below 25 and confirms with a bullish reversal pattern.
Secondary Patterns: Small labels like "SS" (Shooting Star) or "2Bear" serve as additional confirmation of trend weakness.
Settings
RSI Length: Default 9 (Adjustable).
Overbought/Oversold: Default 65/25 (Adjustable).
Pattern Toggles: You can turn on/off specific patterns (Engulfing, Hammers, etc.) to suit your visual preference.
Disclaimer This tool is designed to assist in technical analysis and does not constitute financial advice. Always use proper risk management.
Author: @RADUVEGA

RSI + Volume + Stochastic RSI + ADXRSI + Volume is included
RSI color change if volume sudden rise
Stochastic RSI is included
works for any trade entry or exit
ADX is included
check ADX for momentum
RVI is included

RSI For Loop | PWRSI For Loop – True Dominance Oscillator
RSI For Loop – True Momentum Dominance Through Historical Comparison
The Relative Strength Index (RSI) is excellent at measuring recent price change intensity, but a reading of 70 or 30 has completely different implications depending on the market regime. RSI For Loop removes this ambiguity by transforming RSI into a clean, zero-centered dominance / percentile-rank oscillator that always tells you exactly how strong or weak the current momentum is compared to recent history.
How it works
- Standard RSI is calculated normally (default length 46).
- A simple for-loop compares the current RSI value against the actual RSI value of every previous bar inside the user-defined lookback window (default 1 to 99 bars ≈ one full quarter on daily charts).
- Current RSI higher → +1 point
- Current RSI lower → –1 point
The resulting score ranges from –99 to +99 and is naturally centered around zero:
1. +40 = current momentum beats ~70 % of the last 99 bars (approximation)
2. –60 = current momentum is weaker than ~80 % of the last 99 bars (approximation)
3. Near zero = balanced or ranging market
Additional statistical layers
- A very long rolling median of the score (default 240 periods) serves as a slow, robust dynamic centerline
- Upper and lower 3σ bands are calculated from the standard deviation of the underlying RSI median (default length 60) to highlight truly rare extreme-dominance phases
- Asymmetric trend thresholds (default Long +15 / Short –28) reflect the empirical observation that downside momentum is usually sharper and faster
Origin and development
The core idea of using a for-loop on RSI was originally introduced by @viResearch in his invite-only “RSI For Loop” script.
While studying that concept I realised I needed an even more regime-robust strength gauge that looks back far enough to capture full market cycles (2–4 months). Therefore I completely rewrote the loop to compare against actual historical RSI values instead of fixed levels, added a 240-period median centerline, 3σ extreme bands, asymmetric thresholds, and visual signals. All parameters were extensively tested across dozens of major assets (BTC, ETH, SOL, SUI, BNB, XRP, TRX, DOGE, LINK, PAXG, CVX, HYPE, VIRTUAL + 20+ more cryptos; Magnificent 7 stocks, QQQ, SPX, XAUUSD) with the goal of achieving consistent profitability, high Sortino ratio and low drawdown in simple trend-following setups.
The final defaults represent the most robust compromise found — they keep you in real trends for dozens or hundreds of bars while staying almost silent in choppy, ranging markets.
Important Note
The optimization process is tailored to MY needs and have to be adjusted to you prefered timeframe!
I was mainly looking for an indicator that shows the underlying strength of an asset, the trend componant was only a bonus in my eyes.
How to use it
1. Green triangle below bar → score crosses above +15 → new bullish regime confirmed → enter or add to longs
2. Magenta triangle above bar → score crosses below –28 → exit longs or go cash/short
While score stays clearly positive → bullish bias hold
3. Score touching or breaking the 3σ bands → extreme conviction zone (add to winners or prepare for exhaustion)
Strength
Recommended defaults (My preference)
RSI length 46
Loop range 1–99
Long threshold +15
Short threshold –28
Median length 240
SD length 60
Recommended Universal Settings (Tested for low Max-Drawdown, high Sortino)
RSI length 44
Loop range 1–60
Long threshold +14
Short threshold –10
Median length 180
SD length 28
Works on every asset class, but the current settings are tuned for major liquid markets.
Disclaimer: This is not financial advice. Backtests are based on past results and are not indicative of future performance.

SIDD EMA RSI Supertrend Signal Table🔥 SIDD EMA RSI SuperTrend Multi-Timeframe Signal Table
**SIDD EMA RSI SuperTrend Signal Table** is a **clean, powerful multi-timeframe trend confirmation dashboard** designed for traders who want **clarity, confluence, and speed** — all in one glance.
This indicator **does NOT repaint** and uses **industry-standard trend logic** combining **EMA structure, RSI momentum, and SuperTrend direction** across **6 different timeframes**.
---
## 🧠 Core Logic Behind the Indicator
This script works on **three independent trend engines**, displayed together in a compact table:
### ✅ 1️⃣ EMA Trend (Structure Based)
* Uses **EMA 50 vs EMA 200**
* **Bullish** → EMA 50 above EMA 200
* **Bearish** → EMA 50 below EMA 200
* Captures **primary market structure**
### ✅ 2️⃣ RSI Trend (Momentum Based)
* RSI Length: **14**
* **Bullish** → RSI > **55**
* **Bearish** → RSI ≤ **55**
* Helps confirm **trend strength & momentum**
### ✅ 3️⃣ SuperTrend (Price Action Based)
* ATR Length: **10**
* Factor: **3.0**
* Clearly defines **trend direction & trailing bias**
* Excellent for **entry & exit alignment**
---
## ⏱️ Multi-Timeframe Coverage
The table analyzes trends across **6 configurable timeframes**:
* Intraday → **5m, 15m, 1H**
* Swing → **4H, Daily**
* Positional → **Weekly**
Each timeframe shows:
* 📈 EMA Trend
* 📊 RSI Trend
* 🔁 SuperTrend Direction
Color-coded for instant readability:
* 🟢 Bullish
* 🔴 Bearish
* ⚪ Neutral
---
## 🎯 How to Use This Indicator
✔ **Trend Trading**
Trade only when **EMA + RSI + SuperTrend align** across higher & lower timeframes.
✔ **Intraday Confirmation**
Use higher TF (1H / 4H) bias and take entries on lower TF.
✔ **Avoid Chop & False Signals**
If signals are mixed → market is likely **sideways or risky**.
✔ **Swing & Positional Trades**
Daily + Weekly alignment gives **high-probability setups**.
---
## ⚙️ Customization Options
* Adjustable **timeframes**
* Table **position** (Top/Bottom – Left/Right)
* Table **size** (Extra Small / Small / Normal)
* Custom **colors, borders & text**
* Optimized for **minimal chart clutter**
---
## ⚠️ Disclaimer
This indicator is a **trend confirmation & decision-support tool**.
Always combine with **price action, support/resistance, and proper risk management**.

SCOTTGO - RSI Divergence IndicatorRSI Divergence Indicator
This indicator combines the Relative Strength Index (RSI) with an automatic divergence detection system.
It is designed to help traders spot potential trend changes by:
Color-Coded RSI: The main RSI line dynamically changes color (e.g., green/red) above and below a user-defined threshold (default 50) to highlight strong or weak momentum instantly.
Divergence Signals: It automatically identifies and plots four types of RSI divergences (Regular Bullish, Hidden Bullish, Regular Bearish, and Hidden Bearish) between the price and the oscillator.
Custom Alerts: Includes alerts for all divergence types so you can be notified when a new signal is found.
This tool helps visualize momentum shifts and potential reversals in the market.

0DTE Credit Spreads Indicator0DTE Credit Spreads Indicator
This indicator is designed to assist 0DTE credit spread traders by providing rule-based PCS (Put Credit Spread) and CCS (Call Credit Spread) signals, dynamic risk levels, and an integrated performance summary — all within a single, cohesive tool.
What the indicator does
The script implements a complete intraday framework tailored specifically to same-day expiration credit spreads, combining market structure, volatility context, and trade management logic into one workflow:
Opening Range logic (15-minute)
A defined opening range is used to establish directional bias. Signals are generated only after the range is confirmed, aligning entries with controlled intraday structure rather than momentum chasing.
Optional Early Entry logic
An optional early-entry mechanism evaluates 30-minute RSI extremes during the opening phase only. This is intentionally constrained to the opening window and designed for early premium capture scenarios common in 0DTE trading.
Volatility-aware credit estimation
Expected credit is derived from current volatility conditions to provide realistic assumptions for backtesting, trade visualization, and partial-profit modeling.
Dynamic risk visualization
Each signal automatically plots:
A horizontal stop-loss level
A take-profit level based on user-selected credit percentage
A dynamic diagonal stop line from entry to end-of-day, modeling time-based risk specific to 0DTE positions
Partial profit and contract modeling
The backtest logic supports closing a user-defined number of contracts at the take-profit level, while allowing remaining contracts to run to end-of-day or stop loss. This mirrors real-world 0DTE trade management practices.
Flexible evaluation modes
Trades can be evaluated using either:
Intraday stop-loss crosses, or
End-of-day outcome logic
allowing users to align results with their execution style.
Backtesting and transparency
The indicator includes a live, on-chart backtest table displaying:
PCS and CCS signal counts
Wins, losses, and win rate
Total P/L (points or dollar-based per contract)
Contract and partial-TP configuration
A non-blocking “Recommended context” note indicating whether the script is running on the preferred symbol and timeframe
Signals and visuals will display on any chart. The recommended context is informational only and does not restrict usage.
Chart presentation
Full visual mode with labels, TP/SL levels, and diagonal risk lines
Clean Chart mode with arrow-only signals and a compact summary table
Automatic object management to prevent chart clutter.
Intended use
This indicator is intended as a decision-support and research tool for experienced traders. It does not place trades, does not guarantee profitability, and should be used alongside proper risk management.

Trend Prediction Meter [PointAlgo]The Trend Prediction Meter & Levels is a composite market-bias and volatility visualization tool designed to summarize trend strength, momentum, price positioning, and volatility into a single normalized score.
It provides a structured framework to interpret directional bias and probable price expansion zones during active market conditions.
Concept Overview
Markets often reflect multiple conditions simultaneously—trend direction, momentum strength, price location within a range, and volatility.
This indicator combines these elements into a unified Bullish Score (0–100), displayed as a meter and supported by projected ATR-based levels.
Rather than focusing on a single signal, the script aims to present context about current market conditions.
Bullish Score Composition (0–100)
The meter represents a weighted blend of multiple market factors:
1. Trend Strength (EMA Structure)
Uses a fast and slow EMA to assess directional bias.
The distance between EMAs is normalized into a trend strength score.
Strong separation indicates directional conviction; compression suggests balance.
2. Momentum Strength (RSI Blend)
Combines a short-term and mid-term RSI.
Helps capture both immediate momentum and broader directional stability.
Higher readings indicate sustained bullish pressure, lower readings indicate bearish pressure.
3. Position Within Recent Range
Measures where price is trading relative to its recent high–low range.
Values near the top of the range reflect strength; values near the bottom reflect weakness.
Mid-range positioning indicates equilibrium.
4. Volume Participation
Compares current volume against its recent average.
Acts as a minor confidence modifier rather than a primary driver.
Each component is normalized and combined using fixed weights to produce a final Bullish Score between 0 and 100.
Bias Classification
The Bullish Score is translated into descriptive market states:
Extreme Bullish
Very Bullish
Bullish
Neutral
Bearish
Very Bearish
These labels describe current bias, not future certainty.
Meter Visualization
The meter plot dynamically changes color based on the score range.
A dashed midline at 50 represents balance.
Background shading highlights strong bullish or bearish dominance zones.
Crossovers of the 50-level indicate shifts in directional control.
ATR-Based Projection Levels:
To provide volatility context, the indicator calculates ATR-based upside and downside reference levels:
Two potential expansion levels (TP1 and TP2) are projected above and below price.
The distance of these levels adapts based on current bias strength.
These levels are contextual reference zones, not fixed targets.
Prediction Dashboard
An optional side table summarizes key readings at the most recent bar:
Symbol
Current bias label
Bullish Score
Current price
ATR value
Upside and downside projection levels
Directional comment (Upside favoured / Downside favoured / Balanced)
This dashboard is designed to provide a quick structural overview without requiring manual calculation.
Signals & Alerts
Built-in alerts are available for:
Bullish bias conditions
Bearish bias conditions
Bullish Score crossing above 50
Bullish Score crossing below 50
Alerts are informational and reflect internal state changes only.
Customization:
Users can adjust:
RSI lengths
EMA lengths
Range lookback period
ATR parameters
Display options for the meter and dashboard
This allows adaptation across different instruments and timeframes.
Usage Notes
Best suited for analytical interpretation rather than standalone decision-making.
Designed to complement price action, structure, or other indicators.
Works across multiple markets where volume and volatility data are available.
Disclaimer :
This indicator is intended for educational and analytical purposes only.
It does not provide investment, trading, or financial advice.
All signals and levels should be validated with independent analysis and appropriate risk management.

RSI + STOCH RSI - Marx_CapitalSimple RSI + STOCH RSI indicator in one pane. In addition to the standard 30/70 and 20/80 RSI levels you have three adjustable levels (eg. 0, 50, 100) to indicate STOCH RSI overbought/oversold scenarios.


RSI Divergence LiquidityRSI Divergence Liquidity is an indicator designed to help you catch high-probability BUY reversals by combining two powerful concepts:
OANDA:XAUUSD
Liquidity Sweep / Swing Low: automatically marks swing-low levels and tracks when price sweeps below them and reacts back.
Bullish RSI Divergence: filters noise by comparing RSI at the swing area versus RSI at the retest, favoring reversals with stronger momentum confirmation.
How it works
The script draws Swing Low lines using Pivot Lows. When a new Swing Low forms, the previous one is cut/frozen .
When price retests a Swing Low and the candle conditions are met (bar n bullish, bar n-1 bearish), the script checks:
Whether RSI at n/n-1 is higher than the RSI at the swing (bullish divergence logic)
Whether min RSI at the swing is below a threshold (default < 36) to focus on oversold swing areas
If all conditions pass, the indicator prints an upward triangle right when bar n closes → a potential BUY signal.
How to use
Enter BUY when an up triangle appears at/near the Swing Low (liquidity sweep zone).
Stop Loss idea: below the most recent swing low / below the sweep wick.
Take Profit idea: nearest supply zone, prior high, or fixed RR such as 1:2 / 1:3 depending on your system.
Recommended settings
Best on: M5–H1 (depending on your style), especially effective when price is trending down and performs a clear sweep.
For stricter filtering: lower Max minRSI at Swing (x) to only take signals from deeper RSI lows.
Smaller Pivot Lookback → more swings/signals; larger values → fewer but cleaner swings.
Note: This tool improves probability, not certainty. Combine it with market structure / key levels and proper risk management for best results.

1 CMO200 Signals.Multiple Instrument ScreenerDescription
CMO200 Signals is an overlay indicator that combines a volume-based breakout signal system with multi-timeframe Support/Resistance levels and a 30-symbol screener table.
What it does:
Plots volume-driven BUY/SELL labels on the chart using three lookback presets: 200 / 388 / 500.
Builds higher-timeframe Support & Resistance lines using RSI + CMO conditions and pivot logic (configurable S/R timeframe).
Shows a multi-instrument screener table (up to 30 symbols) with each symbol’s RSI, current BUY/SELL status, last signal price, and trend bias vs MA 200 / MA 111 / MA 89.
Includes alerts for: BUY/SELL (200 lookback) and price crossing above/below MA200.
Inputs: RSI length, lookback settings, Less Ratio filter, S/R timeframe, and symbol enable toggles.
Disclaimer: This script is for educational/informational purposes only and is not financial advice. Always use proper risk management and confirm signals with additional analysis.

Dual Momentum Confluence Oscillator MACD + RSIThis indicator is built around the **simultaneous use of two complementary momentum perspectives**, designed to be read **together**, not in isolation.
### Core purpose
* Highlight moments where **momentum agreement** or **momentum imbalance** becomes visually evident.
* Help distinguish between **healthy movement**, **loss of strength**, and **potential transition phases**.
### Combined reading approach
* One component focuses on **momentum flow and acceleration**, showing how force develops or fades.
* The other evaluates **relative pressure within recent price action**, adding context to whether momentum is stretched or still balanced.
* Signals are meant to be interpreted when **both perspectives are considered at the same time**, reinforcing or filtering each other.
### Practical use
* Particularly useful as a **confirmation layer** for directional strategies.
* Helps avoid decisions based on a single momentum measure by requiring **contextual alignment**.
* Can also support timing refinement in both continuation and pullback scenarios.
### Visual structure
* Everything is displayed in **one compact pane**, allowing quick cross-market scanning without overloading the chart.
* Visual contrast makes changes in momentum state easy to spot at a glance.
### Best conditions
* Most effective in markets with **clear participation and readable momentum shifts**.
* Less informative during flat, low-energy phases.
*For educational and analytical purposes only. Always test across multiple markets and timeframes.*
---
Così è chiaro che **RSI e MACD lavorano insieme**, ma **nessuno può risalire a come**.

Trading Value RSI (NQ Tuned)The Trading Value RSI (NQ Tuned) is an indicator that applies the RSI calculation to trading value, defined as volume × close, rather than just price. It is specifically tuned for Nasdaq 100 futures (NQ), with a default RSI length of 24, overbought level at 75, and oversold level at 25 to filter out false signals from high volatility. The indicator visually colors the RSI line based on overbought (red), oversold (green), or neutral (blue) conditions. A horizontal midline at 50 helps identify potential trend direction changes or confirm ongoing momentum. This tool allows traders to monitor capital flow intensity, giving insight into when strong buying or selling pressure may drive short-term market moves.

SMA34 + Trend Strength Index Band + RSI50 (STRICT CLEAN)Provide Buy and sell signal basis TSI & RSI.
when TSI crosses 0 buy and sell.

Liquidity Sentiment Profile | LUPENIndicator Guide: Liquidity Sentiment Profile (LSP).
What is the LSP?
The Liquidity Sentiment Profile (LSP) is a "Next-Generation" oscillator designed to look beyond simple price action. While standard indicators (like RSI or MACD) primarily focus on where a candle closes, the LSP analyzes the micro-structure of the entire candle—specifically the relationship between the candle's Body, its Wicks (Shadows), and the Volume.
The Core Philosophy:
Wicks tell the truth: A long lower wick indicates that sellers pushed the price down, but buyers aggressively absorbed that liquidity and pushed it back up.
That is hidden bullish strength.
Volume validates intent: A price move with low volume is noise. A price move (or wick rejection) with high volume is a commitment by institutional players.
The LSP calculates a "Sentiment Score" between -100 and +100 based on these factors.
How to Read the Visuals
The Colors (Intensity)
color: Light Green - Bullish Acceleration. Buyers are in control, and momentum is increasing. This is the ideal time to be in a Long trade.
color: Dark Green - Bullish Deceleration. Buyers are still in control (price is likely rising), but the momentum is fading. This is a warning sign to tighten stop-losses or take profits.
color: Light Red - Bearish Acceleration. Sellers are dominating, and panic is increasing. This is the ideal time to be Short.
color: Dark Red - Bearish Deceleration. Sellers are still in control, but the downward pressure is exhausted. Be careful with new short positions.
The Lines & Fills
The Main Line: The actual LSP sentiment value.
The Yellow Signal Line: A smoothed average of the sentiment.
The Core Fill: The colored area between the Main Line and the Signal Line. When this area "glows", the trend is strong. When it dims (Dark), the trend is weak. Bearish Deceleration. Sellers are still in control, but the downward pressure is exhausted. Be careful with new short positions.
The Lines & Fills
The Main Line: The actual LSP sentiment value.
The Yellow Signal Line: A smoothed average of the sentiment.
The Core Fill: The colored area between the Main Line and the Signal Line. When this area "glows" (Neon), the trend is strong. When it dims (Dark), the trend is weak.
How to Use It (Trading Strategies)
Strategy A: The "Power Cross" (Trend Entry)
Use this for entering trends when the market wakes up.
Long Entry: Wait for the LSP line to cross ABOVE the Yellow Signal Line.
Confirmation: The fill color must turn Neon Green.
Short Entry: Wait for the LSP line to cross BELOW the Yellow Signal Line.
Confirmation: The fill color must turn Neon Red.
Strategy B: The "Absorption" Play (Reversals)
This is where the LSP shines. It detects when liquidity is being absorbed before price turns.
Bullish Absorption: The Price makes a Lower Low, but the LSP makes a Higher Low. This happens because the LSP detects the Volume on the Lower Wicks (buyers absorbing selling pressure). This is a high-probability reversal signal.
Bearish Absorption: The Price makes a Higher High, but the LSP makes a Lower High. The volume on the Upper Wicks suggests sellers are absorbing the buy orders.
Strategy C: The "Dimming" Exit (Risk Management)
Don't wait for the price to crash to exit a trade.
If you are in a Long trade (Neon Green) and the color instantly shifts to Dark Green, it means the "fuel" is running out. Consider taking partial profits or moving your Stop Loss to break even.
Standard oscillators (like RSI) often give false signals during strong trends (showing "Overbought" while price keeps going up). The LSP avoids this because it weights Volume and Wicks. If price goes up and volume increases, the LSP stays Neon Green, telling you the move is genuine, not just overextended.

OC Chain_ROC_RSI15-minute indicator that detects a 3-candle “inside” chain where each candle’s open & close remain within the previous candle’s open-close range. Plots horizontal Open/Close levels on candles when ROC(2) moves beyond a configurable ±threshold, and highlights candles when RSI is strong (>55) or weak (< user set level, e.g., 30–32). Adjustable ROC/RSI settings and line extension options.
