Smart Moving Average Dynamics [ChartNation]Smart Moving Average Dynamics (SMAD) — by Chart Nation
What it does:
SMAD maps how far price deviates from a chosen moving average and normalizes that distance into a bounded oscillator (−100…+100). It detects extreme expansions and prints non-repainting dots when the move exits an extreme. Price-level rails are drawn from those events (with optional fade/expiry) to highlight likely reaction zones. The MA line is colored by bias. A slim gauge summarizes the current oscillator percentile; a compact info panel shows TF, Trend, Volume rank, and Volatility rank.
How it works (high-level, closed-source)
Core signal: diff = price – MA(type, length) where MA can be SMA/EMA/RMA/WMA/VWMA.
Normalization (choose one):
Highest Abs (N): scales diff by the highest absolute excursion over N bars (fast, adaptive).
Z-Score: scales by stdev(diff, N) and maps ±σ to ±100 via a user factor.
ATR-Scaled: scales by ATR * k, relating deviation to current volatility.
Percent Rank: ranks the magnitude of |diff| over N bars and reapplies the original sign.
All methods clamp to −100…+100 to keep visuals consistent across assets/TFs.
Extremes & confirmation: Dots print only when an extreme exits ±100 (optionally on bar close) and can be filtered by linger bars and short-term slope flip, reducing one-bar spikes.
Rails: When an extreme confirms, a rail is anchored at the corresponding price swing and can soft-fade and/or expire after X bars.
Trend color: MA color = Up (green) when oscillator > threshold and MA slope > 0; Down (magenta) for the opposite; Neutral otherwise.
Context panels:
Slim Gauge: current oscillator bucket (0–20) with the exact normalized reading.
Info Panel: TF, Trend, and 0–100 percent-ranks of Volume and ATR-based volatility grouped as Low / Medium / High.
SMAD isn’t a collection of plots; it’s a single framework that integrates:
a deviation-from-MA engine,
four interchangeable normalization models (selected per market regime),
a gated extreme detector (linger + slope + confirm-on-close), and
time-aware rails with soft fade/expiry, presented with a minimal gauge and info panel so traders can compare regimes across TFs without recalibrating thresholds.
How to use (examples, not signals)
Mean-revert plays: When price exits an extreme and prints a dot, look for reactions near the new rail. Combine with your S/R and risk model.
Trend continuation: In strong trends the oscillator will spend more time above/below zero; the colored MA helps keep you aligned and avoid fading every push.
Regime switching: Try Percent Rank or ATR-Scaled on choppy/alts; Z-Score on majors; Highest Abs (N) when you want fastest adaptation.
Risk ideas: Rails can be used as partial-take or invalidate levels. Always backtest on your pair/TF.
Key settings
Normalization: Highest Abs / Z-Score / ATR-Scaled / Percent Rank (with N & factors).
Filters: Extreme threshold, linger bars, slope lookback, confirm on close.
Rails: Expire after X bars; soft-fade step.
Panels: Slim gauge (bottom-right), Info panel (middle-right).
Notes & limits
Prints confirm after the extreme exits ±100; nothing repaints retroactively.
Normalization can change sensitivity—choose the one matching your asset’s regime.
Reversal

Percentile Rank Oscillator (Price + VWMA)A statistical oscillator designed to identify potential market turning points using percentile-based price analytics and volume-weighted confirmation.
What is PRO?
Percentile Rank Oscillator measures how extreme current price behavior is relative to its own recent history. It calculates a rolling percentile rank of price midpoints and VWMA deviation (volume-weighted price drift). When price reaches historically rare levels – high or low percentiles – it may signal exhaustion and potential reversal conditions.
How it works
Takes midpoint of each candle ((H+L)/2)
Ranks the current value vs previous N bars using rolling percentile rank
Maps percentile to a normalized oscillator scale (-1..+1 or 0–100)
Optionally evaluates VWMA deviation percentile for volume-confirmed signals
Highlights extreme conditions and confluence zones
Why percentile rank?
Median-based percentiles ignore outliers and read the market statistically – not by fixed thresholds. Instead of guessing “overbought/oversold” values, the indicator adapts to current volatility and structure.
Key features
Rolling percentile rank of price action
Optional VWMA-based percentile confirmation
Adaptive, noise-robust structure
User-selectable thresholds (default 95/5)
Confluence highlighting for price + VWMA extremes
Optional smoothing (RMA)
Visual extreme zone fills for rapid signal recognition
How to use
High percentile values –> statistically extreme upward deviation (potential top)
Low percentile values –> statistically extreme downward deviation (potential bottom)
Price + VWMA confluence strengthens reversal context
Best used as part of a broader trading framework (market structure, order flow, etc.)
Tip: Look for percentile spikes at key HTF levels, after extended moves, or where liquidity sweeps occur. Strong moves into rare percentile territory may precede mean reversion.
Suggested settings
Default length: 100 bars
Thresholds: 95 / 5
Smoothing: 1–3 (optional)
Important note
This tool does not predict direction or guarantee outcomes. It provides statistical context for price extremes to help traders frame probability and timing. Always combine with sound risk management and other tools.

CCI [Hash Adaptive]Adaptive CCI Pro: Professional Technical Analysis Indicator
The Commodity Channel Index is a momentum oscillator developed by Donald Lambert in 1980. CCI measures the relationship between an asset's price and its statistical average, identifying cyclical turns and overbought/oversold conditions. The indicator oscillates around zero, with values above +100 indicating overbought conditions and values below -100 suggesting oversold conditions.
Standard CCI Formula: (Typical Price - Moving Average) / (0.015 × Mean Deviation)
This indicator transforms the traditional CCI into a sophisticated visual analysis tool through several key enhancements:
Implements dual exponential moving average smoothing to eliminate market noise
Preserves signal integrity while reducing false signals
Adaptive smoothing responds to market volatility conditions
Dynamic Color Visualization System
Continuous gradient transitions from red (bearish momentum) to green (bullish momentum)
Real-time color intensity reflects momentum strength
Eliminates discrete color jumps for fluid visual interpretation
Adaptive Intelligence Features
Dynamic overbought/oversold thresholds adapt to market conditions
Reduces false signals during high volatility periods
Maintains sensitivity during low volatility environments
Momentum Vector Analysis
Incorporates velocity calculations for early trend identification
Crossover detection with momentum confirmation
Advanced signal filtering reduces market noise
Extreme Level Analysis
Values above +100: Strong overbought conditions, potential reversal zones
Values below -100: Strong oversold conditions, potential buying opportunities
Zero-line crossovers: Momentum shift confirmation
Optimization Parameters
CCI Period (Default: 14)
Shorter periods (10-12): Increased sensitivity, more signals
Standard periods (14-20): Balanced responsiveness and reliability
Longer periods (21-30): Reduced noise, stronger signal confirmation
Smoothing Factor (Default: 5)
Lower values (1-3): Maximum responsiveness, suitable for scalping
Medium values (4-6): Balanced approach for swing trading
Higher values (7-10): Institutional-grade smoothness for position trading
Signal Sensitivity (Default: 6)
Conservative (7-10): High-probability signals, reduced frequency
Balanced (5-6): Optimal risk-reward ratio
Aggressive (1-4): Maximum signal generation, requires additional confirmation
Strategic Implementation
Oversold reversals in red zones with momentum confirmation
Zero-line breaks with sustained color transitions
Extreme readings followed by momentum divergence
Risk Management
Use extreme levels (+100/-100) for position sizing decisions
Monitor color intensity for momentum strength assessment
Combine with price action analysis for comprehensive market view
Market Context Application
Trending markets: Focus on momentum direction and extreme readings
Range-bound markets: Utilize overbought/oversold levels for mean reversion
Volatile markets: Increase smoothing parameters and signal sensitivity
Professional Advantages
Instantaneous momentum assessment through color visualization
Reduced cognitive load compared to traditional oscillators
Professional presentation suitable for client reporting
Adaptive Technology
Self-adjusting parameters reduce manual optimization requirements
Consistent performance across varying market conditions
Advanced mathematics eliminate common CCI limitations
The Adaptive CCI Pro represents the evolution of momentum analysis, combining Lambert's foundational CCI concept with modern computational techniques to deliver institutional-grade market intelligence through an intuitive visual interface.

OG Signal Indicator - Single Line Plotshapethis signal help to identify strong buy and sell signal as price over bought and over sold. by sigma s lohar
PDB - RSI Buy & Sell Zones + SMA (PrintDemBandz)PDB - RSI Buy & Sell Zones
A clean, upgraded version of the RSI with shaded momentum zones to make entries and exits easier to spot. The background is divided into five color-coded zones so you instantly see when the market is shifting from bullish to bearish momentum.
Shaded Zones Explained:
| Zone | RSI Range | Zone Meaning |
| --------------------------- | --------- | ----------------------------------------------------- |
| Strong Buy (Dark Green) | < 30 | Oversold extreme – high probability bounce zone
| Buy Zone (Light Green) | 30–40 | Early accumulation & potential reversal area
| Neutral (Grey) | 40–60 | No edge zone – stay patient and wait for direction |
| Sell Zone (Light Red) | 60–70 | Market heating up – take profit or prepare to short |
| Strong Sell (Dark Red) | > 70 | Overbought extreme – high probability correction zone |
A dashed midline at 50 helps instantly gauge trend bias (above = bullish, below = bearish).
Use this RSI alone or combine with MACD or MA for stronger confirmations.
Search "PDB" in the indicators section for more free indicators.

HV Spike Strategy (HVP + OR Breakout + Reversal + TP/SL Modes)Here is a script that I tried to make it simple, although it has several parameters, I will try to explain, here we go:
Logic: Open Range Breakout: otherwise knows as First Candle Rule, usually used for the first candle in the opening of a market session, in my strategy there is an option to use it even for Crypto that operate 24/7, how to do that? Simply by detecting Volatility from the HVP (Historical Volatility Percentile). Then the ORB logic kicks in and the first candle with high volatility gives the ranges for the trades. The proper HVP Activation Threshold has to be selected for each currency pair/index/crypto in order to have maximum profit.
Enter a trade: when the price goes 100% above/below the First Candle Rule Range. That way it is filtering fake breakouts. Also if the price reverses back into the range the strategy takes the opposite trade.
Exit a trade: SL/TP By percentage or ATR, selection in the input menu.
My intention is to avoid using lagging indicators or guessing of Price Action, purely Bull/Bear indication by the first candle.
I hope you find this helpful! Wishing all successful Trades!

Statistical Price Deviation Index (MAD/VWMA)SPDI is a statistical oscillator designed to detect potential price reversal zones by measuring how far price deviates from its typical behavior within a defined rolling window.
Instead of using momentum or moving averages like traditional indicators, SPDI applies robust statistics - a rolling median and Mean Absolute Deviation (MAD) - to calculate a normalized measure of price displacement. This normalization keeps the output bounded (from −1 to +1 by default), producing a stable and consistent oscillator that adapts to changing volatility conditions.
The second line in SPDI uses a Volume-Weighted Moving Average (VWMA) instead of a simple price median. This creates a complementary oscillator showing statistically weighted deviations based on traded volume. When both oscillators align in their extremes, strong confluence reversal signals are generated.
How It Works
For each bar, SPDI calculates the median price of the last N bars (default 100).
It then measures how far the current bar’s midpoint deviates from that rolling median.
The Mean Absolute Deviation (MAD) of those distances defines a “normal” range of fluctuation.
The deviation is normalized and compressed via a tanh mapping, keeping the oscillator in fixed boundaries (−1 to +1).
The same logic is applied to the VWMA line to gauge volume-weighted deviations.
How to Use
The blue line (Price MAD) represents pure price deviation.
The green line (VWMA Disp) shows the volume-weighted deviation.
Overbought (red) zones indicate statistically extreme upward deviation -> potential short-term overextension.
Oversold (green) zones indicate statistically extreme downward deviation -> potential rebound area.
Confluence signals (both lines hitting the same extreme) often mark strong reversal points.
Settings Tips
Lookback length controls how much historical data defines “normal” behavior. Larger = smoother, smaller = more sensitive.
Smoothing (RMA length) can reduce noise without changing the overall statistical logic.
Output scale can be set to either −1..+1 or 0..100, depending on your visual preference.
Alerts and color fills are fully customizable in the Style tab.
Summary:
SPDI transforms raw price and volume data into a statistically bounded deviation index. When both Price MAD and VWMA Disp reach joint extremes, it highlights probable market turning points - offering traders a clean, data-driven way to spot potential reversals ahead of time.

RSI Reversal + BB RSIReversal Alerts
SELL Reversal (reversalSELL)
Triggers when:
RSI touches or crosses above the upper BB, and
The current candle is bearish (close < open).
→ Plots a small red circle above the candle
→ Fires alert named “reversalSELL”
BUY Reversal (reversalBUY)
Triggers when:
RSI touches or crosses below the lower BB, and
The current candle is bullish (close > open).
→ Plots a small green circle below the candle
→ Fires alert named “reversalBUY”

AUTOMATIC ANALYSIS MODULE🧭 Overview
“Automatic Analysis Module” is a professional, multi-indicator system that interprets market conditions in real time using TSI, RSI, and ATR metrics.
It automatically detects trend reversals, volatility compressions, and momentum exhaustion, helping traders identify high-probability setups without manual analysis.
⚙️ Core Logic
The script continuously evaluates:
TSI (True Strength Index) → trend direction, strength, and early reversal zones.
RSI (Relative Strength Index) → momentum extremes and technical divergences.
ATR (Average True Range) → volatility expansion or compression phases.
Multi-timeframe ATR comparison → detects whether the weekly structure supports or contradicts the local move.
The system combines these signals to produce an automatic interpretation displayed directly on the chart.
📊 Interpretation Table
At every new bar close, the indicator updates a compact dashboard (bottom right corner) showing:
🔵 Main interpretation → trend, reversal, exhaustion, or trap scenario.
🟢 Micro ATR context → volatility check and flow analysis (stable / expanding / contracting).
Each condition is expressed in plain English for quick decision-making — ideal for professional traders who manage multiple charts.
📈 How to Use
1️⃣ Load the indicator on your preferred asset and timeframe (recommended: Daily or 4H).
2️⃣ Watch the blue line message for the main trend interpretation.
3️⃣ Use the green line message as a volatility gauge before entering.
4️⃣ Confirm entries with your own strategy or price structure.
Typical examples:
“Possible bullish reversal” → early accumulation signal.
“Compression phase → wait for breakout” → avoid premature trades.
“Confirmed uptrend” → trend continuation zone.
⚡ Key Features
Real-time auto-interpretation of TSI/RSI/ATR signals.
Detects both bull/bear traps and trend exhaustion zones.
Highlights volatility transitions before breakouts occur.
Works across all assets and timeframes.
No repainting — stable on historical data.
✅ Ideal For
Swing traders, position traders, and institutional analysts who want automated context recognition instead of manual indicator reading.

PDB 4 MA + Candle Strength/Weakness Detector
4MA Strength & Reversal Detector
Unlock the power of momentum with this advanced 4 Moving Average system (20, 50, 100, 200) designed to pinpoint market strength and early reversal zones with precision.
How It Works:
- Bearish Reversal: Triggered when all moving averages align (20 < 50 < 100 < 200) and bearish reversal candles appear — highlighting potential tops.
- Bullish Reversal: Triggered when all moving averages align (200 < 100 < 50 < 20) and bullish reversal candles form — marking potential bottoms
:Best For:
⚡ Scalpers and day traders using 1–5 minute timeframes
📈 Identifying momentum shifts and trend exhaustion early
Tip: Combine this with volume or RSI for stronger confirmation and fewer false signals.

ICT Turtle SoupICT Turtle Soup identifies classic “failed breakout” reversals after liquidity sweeps of recent highs/lows, then augments the setup with volume validation, market structure context, Kill Zone (session) filters, Order Blocks (OB), Fair Value Gaps (FVG), OTE (61.8–78.6%) zones, and optional risk targets (SL/TP 1:1, 1:2, 1:3). A compact dashboard summarizes current context (recent high/low, lookbacks, active session, structure state, mitigation counts).
What the Script Does
⦁ Detects Turtle Soup events: Price breaks a prior swing extreme and then quickly reverses back inside the range.
⦁ Grades signal quality: Factors include reversal speed, volume confirmation, breakout magnitude, and consecutive patterns.
⦁ Overlays market context: Trend/range classification (ADX / MA / ATR Bands / Combined), Kill Zones (Asian/London/NY), and time-of-day filters.
⦁ Marks IMB / mitigation zones: Draws Order Blocks and Fair Value Gaps, with optional live mitigation tracking and fading/removal on mitigation.
⦁ Shows OTE zones (61.8–78.6%) after confirmed reversals to highlight potential pullback entries.
⦁ Plots risk management guides: Optional SL buffer below/above reversal wick and TP bands at 1:1, 1:2, 1:3 R multiples.
⦁ Emits alerts on bullish/bearish Turtle Soup confirmations.
How It Works (Conceptual)
1. Liquidity Sweep & Breakout Check
⦁ Looks back over user-defined windows (single or multiple lookbacks: short/medium/long) to find the most recent swing high/low.
⦁ Flags a breakout when price pierces that swing (above for bearish, below for bullish).
⦁ Optional breakout bar volume check requires volume > avg(volume, N) × multiplier.
⦁ Optional swing age check requires the broken swing to be at least X bars old.
2. Reversal Confirmation
⦁ Within N bars after the sweep, validates a mean-reversion close back inside the prior range with a minimum wick/body ratio to confirm rejection.
⦁ Quality Score adds points for:
⦁ Speed: reversal within fast_reversal_bars;
⦁ Volume: breakout and/or reversal volume spike;
⦁ Series: previous consecutive signals;
⦁ Magnitude: sufficient sweep distance.
⦁ Optional high-quality filter only shows signals meeting a minimum score.
3. Context Filters (Optional)
⦁ Sessions/Kill Zones: Only allow signals in selected sessions (Asian/London/NY) with fully custom HHMM inputs.
⦁ Time Window: Restrict to specific hours (e.g., 08–12).
⦁ Market Structure: Classify Trending vs. Ranging (via ADX, MA separation/slope, ATR bands, or Combined). You can allow signals in trends, ranges, or both.
4. Smart Confluence Layers
⦁ Order Blocks: Finds likely OBs with structural validation (e.g., bearish up-candle prior to down move), imbalance score (body/range × volume factor), and extend-until-touched with mitigation % tracking.
⦁ Fair Value Gaps: Detects valid 3-bar gaps (bull/bear) with size threshold, supports touch / 50% / full mitigation logic, and can fade or remove after mitigation.
⦁ OTE Zones: After a reversal, projects the 61.8–78.6% retracement box from the actual swing range; offset scales to timeframe to avoid clutter.
5. Risk & Display
⦁ SL/TP guides: Optional wick-buffered SL and 1:1/1:2/1:3 TPs.
⦁ Dashboard: Recent high/low, active lookbacks, current session, structure label, and live counts of mitigated OBs/FVGs.
Signals & Visuals
⦁ Bullish Turtle Soup: Triangle up + label (🐢S/M/L/D + star rating).
⦁ Bearish Turtle Soup: Triangle down + label (🐢S/M/L/D + star rating).
⦁ Labels can show: quality stars, FAST/SLOW reversal, reversal & breakout volume tags, previous consecutive count, and last move %.
⦁ Lines/Boxes: OBs, FVGs, OTE zones, SL/TP bands, and optional breakout magnitude line.
Inputs (Key Groups)
⦁ Turtle Soup: Lookbacks (single or S/M/L), reversal bars, wick ratio, magnitude line, reversal speed, volume confirmation (multiplier/length), consecutive tracking.
⦁ Order Blocks: Show/validate structure, lookback, extend-until-touched, mitigation % threshold, colors.
⦁ Fair Value Gaps: Show, min size %, colors, mitigation mode (Touch/50%/Full), optional remove-on-mitigation.
⦁ Kill Zones/Sessions: Enable Asian/London/NY with custom HHMM, colors.
⦁ OTE: Show OTE (61.8–78.6%), color, timeframe-adaptive offsets.
⦁ Signal Filters: Filter by session, time window, market structure method (ADX/MA/ATR/Combined), thresholds (ADX, MA periods, ATR multiplier), trending/ranging allowances, structure label & offset.
⦁ SL/TP: SL buffer %, TP 1:1/1:2/1:3 toggles & colors.
⦁ Breakout Validation: Require breakout-bar volume, min swing age, volume label toggles.
⦁ Alerts: Enable/disable.
⦁ Dashboard: Position, text size, colors, border.
How to Use
1. Markets & Timeframes: Works on FX, crypto, indices, and futures. Start with M5–H1 for intraday and H1–H4 for swing; refine lookbacks per instrument volatility.
2. Core Flow:
⦁ Enable multiple lookbacks for robustness on mixed volatility.
⦁ Turn on validate_swing_significance to avoid micro sweeps.
⦁ Use validate_breakout_volume + use_volume_confirmation to filter weak pokes.
3. Context Choice:
⦁ In ranging environments, allow both sides; in trends, consider counter-trend only at HTF OB/FVG/OTE confluence.
⦁ Narrow to London/NY for higher activity if desired.
4. Entries/Stops/Targets:
⦁ Entry on confirmed label close or at OTE pullback post-signal.
⦁ SL: below/above reversal wick + sl_buffer%.
⦁ TP: scale at 1:1/1:2/1:3 or manage via OB/FVG/structure breaks.
5. Confluence: Prefer Turtle Soup that aligns with OB/FVG zones and Combined structure method for added reliability.
Alerts
⦁ “Bullish Turtle Soup detected” and “Bearish Turtle Soup detected” fire on confirmation.
⦁ Set to Once Per Bar (as coded) or adjust in the alert dialog per your workflow.
Notes & Tips
⦁ Multiple lookbacks (S/M/L) help capture both shallow and deep liquidity sweeps.
⦁ Use market structure label with offset to keep it readable on the right of price.
⦁ Mitigation tracking visually communicates when OB/FVG confluence is no longer valid.
⦁ Dashboard = fast situational awareness; keep it on during live trading.
Limitations & Disclaimer
⦁ This tool is educational and not financial advice. No profitability or win-rate is implied. Markets carry risk; manage position size and test thoroughly.
⦁ Signal quality depends on market regime, spreads, news, and data quality. Backtests/forward-tests may differ.
⦁ Visual objects are capped for performance; old items may auto-clean to keep charts responsive.

First-Move-Wrong Toolkit [CHE] First-Move-Wrong Toolkit — Session-bound sweep rejection with structure confirmation
Summary
This indicator marks potential “first move wrong” reversals during a defined trading session. It looks for a quick sweep beyond the prior day high or low, or the opening range high or low, followed by rejection and a basic structure confirmation. Optional rules require a retest and a VWAP reclaim in the direction of the trade idea. The script renders session levels as right-extended lines, signals as labels, optional SL/TP guide lines for visualization, and background tints during sweep events. Pivots are confirmed using swing width, which reduces repaint risk compared to live swings.
Motivation: Why this design?
Intraday reversals often start with a liquidity sweep around obvious highs or lows. Acting on the sweep alone can be noisy, while waiting for structure break and a retest can be slow. This tool balances both by checking a sweep and rejection at session-relevant levels, then requiring a simple structure cue and, optionally, a retest and a VWAP filter. The goal is a clear, rule-based signal layer that is easy to audit on chart without hidden state.
What’s different vs. standard approaches?
Baseline reference: Simple sweep detectors or basic CHOCH markers that ignore session context and liquidity anchors.
Architecture differences:
Session-aware opening range tracking that finalizes after the chosen minutes from session start.
Daily previous high and low pulled without lookahead, then extended forward as visual anchors.
Confirmed pivot highs and lows to avoid repaint from live, unconfirmed swings.
Optional retest rule using crossover or crossunder at the trigger level.
Optional VWAP filter to demand reclaim in the intended direction.
Global label cooldown to prevent clusters of signals.
Practical effect: Fewer one-off flips around noisy levels, clearer alignment with session structure, and compact visual feedback through lines, labels, and tints.
How it works (technical)
Levels: During the defined session, the script builds an opening range high and low until the configured minute mark after session start, then freezes those levels for the day. It also fetches the previous day high and low from the daily timeframe without lookahead and extends them forward.
Sweep and rejection: A sweep is defined as price moving beyond a target level and then rejecting back inside on the same bar. The script checks this condition separately for highs and lows against opening range and previous-day levels.
Structure validation: Confirmed pivot highs and lows are computed using a symmetric swing width. A bearish idea requires a prior sweep of a high plus a break through the last confirmed swing low. A bullish idea requires a prior sweep of a low plus a break through the last confirmed swing high.
Optional retest: If enabled, a bearish signal needs a cross under the bearish trigger level; a bullish signal needs a cross over the bullish trigger level.
VWAP filter (optional): The script requires a reclaim of VWAP in the intended direction when enabled.
State handling: Opening range values, previous-day lines, and the label cooldown timestamp are stored in persistent variables. Lines are created once and updated each bar to extend forward.
Repaint considerations: Pivots confirm only after the specified swing width, reducing repaint. The daily level request is performed without lookahead. Signals use closed-bar checks implied by crossover and crossunder logic.
Parameter Guide
Session (local) — Defines the active trading window. Default nine to seventeen. Narrower windows focus on the main session drive.
Opening Range (min) — Minutes from session start to finalize OR levels. Default fifteen. Shorter values react faster; longer values stabilize levels.
Use PrevDay H/L levels — Toggle previous-day anchors. On by default.
Use OR H/L levels — Toggle opening range anchors. On by default.
Equal H/L tolerance (ticks) — Intended tolerance for equal highs or lows. Default one. (Unknown/Optional) in current signals.
Swing width — Bars on both sides for confirmed pivots. Default two. Larger values reduce noise but confirm later.
Require CHOCH after sweep — Enforces structure break after a sweep. On by default.
Prefer retest entries — Requires crossover or crossunder of the trigger level. On by default.
VWAP filter — Demands a reclaim of VWAP in signal direction. Off by default.
TP in R (guide) — Multiplier for visual TP guides. Default one. Visualization only.
Show levels / Show signals / Show R-guides — Rendering toggles. R-guides are visual aids, not orders.
Label cooldown (bars) — Minimum bars between labels. Default five. Higher values reduce clusters.
Palette inputs — Colors and transparencies for levels, labels, VWAP, and tints.
Reading & Interpretation
Lines: Dotted lines represent opening range high and low after the OR window completes. Dashed lines represent previous-day high and low.
Signals: “Long” labels appear after a low-side sweep with rejection and structure confirmation, subject to optional retest and VWAP rules. “Short” labels mirror this on the high side.
Background tints: Red-tinted bars indicate a high-side sweep and rejection. Green-tinted bars indicate a low-side sweep and rejection.
R-guides: Circles display a visual stop level at the bar extreme and a target guide based on the selected multiple. They are informational only.
Practical Workflows & Combinations
Session reversal scans: During the first hour, watch for sweeps around previous-day or opening range levels, then wait for structure confirmation and optional retest.
Trend following with filters: Combine signals with higher-timeframe structure or a moving average regime check. Ignore signals against the dominant regime.
Exits and stops: Use the visual stop as a reference near the sweep extreme; adapt the target guide to volatility and market conditions.
Multi-asset / Multi-TF: Works on intraday timeframes for liquid futures, indices, forex, and large-cap equities. Start with default settings and adjust swing width and OR minutes to instrument volatility.
Behavior, Constraints & Performance
Repaint/confirmation: Pivots confirm after the swing window completes. Signals occur only when conditions are met on closed bars.
security()/HTF: Daily previous-day levels are requested without lookahead to reduce repaint.
Resources: Uses persistent variables and line updates per bar; no heavy loops or arrays.
Known limits: Signals can arrive later when swing width is large. Gaps around session boundaries may distort OR levels. VWAP behavior may vary with partial sessions or illiquid assets.
Sensible Defaults & Quick Tuning
Starting point: Session nine to seventeen, opening range fifteen minutes, swing width two, CHOCH required, retest on, VWAP off, cooldown five bars.
Too many flips: Increase swing width, enable VWAP filter, or raise label cooldown.
Too sluggish: Reduce swing width or shorten the opening range window.
Too many session-level hits: Disable either previous-day levels or opening range levels to simplify context.
What this indicator is—and isn’t
This is a session-aware visualization and signal layer focused on sweep-plus-structure behavior. It is not a complete trading system and does not manage orders, risk, or portfolio exposure. Use it with market structure, risk limits, and execution rules that fit your process.
Disclaimer
The content provided, including all code and materials, is strictly for educational and informational purposes only. It is not intended as, and should not be interpreted as, financial advice, a recommendation to buy or sell any financial instrument, or an offer of any financial product or service. All strategies, tools, and examples discussed are provided for illustrative purposes to demonstrate coding techniques and the functionality of Pine Script within a trading context.
Any results from strategies or tools provided are hypothetical, and past performance is not indicative of future results. Trading and investing involve high risk, including the potential loss of principal, and may not be suitable for all individuals. Before making any trading decisions, please consult with a qualified financial professional to understand the risks involved.
By using this script, you acknowledge and agree that any trading decisions are made solely at your discretion and risk.
Do not use this indicator on Heikin-Ashi, Renko, Kagi, Point-and-Figure, or Range charts, as these chart types can produce unrealistic results for signal markers and alerts.
Best regards and happy trading
Chervolino

3-6-9 Times v3.1 (rdt)3-6-9 Times v3.1 Indicator Overview
Core Concept
This indicator identifies specific times/dates where the digital root (sum of digits reduced to a single number) equals 3, 6, or 9, which are considered significant in numerology and certain trading methodologies.
How It Calculates Roots:
For Intraday Timeframes (minutes, hours):
Formula: Hour + First Minute Digit + Last Minute Digit → Reduce to single digit
For Daily/Weekly/Monthly Timeframes:
Uses Month + Day calculations with similar digit reduction logic.
Key Features:
1. Break Filter (Default: ON)
Only displays labels after a swing high/low is broken
Prevents clutter by filtering out times that don't coincide with price action
Configurable pivot length (default: 2 bars)
Optional directional filter: green candles must break highs, red candles must break lows
2. Root Selection
Toggle individual roots (3, 6, or 9) on/off
Each root has customizable color
Default colors: Blue (3), Green (6), Red (9)
3. Display Options
Marking Style: Labels, Vertical Lines, or Both
Label Text Format:
Root Only (default) - shows just "3", "6", or "9"
Time/Date Only - shows the actual time/date
Root + Time/Date (separate lines) - shows both
Label Background: Toggle colored box behind text (default: OFF)
Chart Background: Toggle colored background highlight (default: OFF)
Text Color: Customizable (default: black)
4. Session Filter:
Set specific hours/minutes for when to display signals
Default: 00:00 to 23:59 (all day)
Useful for focusing on specific trading sessions
5. Hour Offset
Manual adjustment for timezone/DST issues
Range: -12 to +12 hours
Helps align calculations with your preferred timezone
6. Label Placement
Green candles: Label appears above the bar
Red candles: Label appears below the bar
7. Alerts
Four alert conditions available:
Any 3-6-9 root hit
Specific Root 3 hit
Specific Root 6 hit
Specific Root 9 hit
Typical Use Case
Traders use this to identify potential reversal or continuation points when:
A 3/6/9 time occurs
Price breaks a recent swing high/low
Combining this timing signal with other technical analysis
The indicator helps identify "energetic" time windows that may correlate with increased volatility or directional moves.

Session Gap Fill [LuxAlgo]The Session Gap Fill tool detects and highlights filled and unfilled price gaps between regular sessions. It features a dashboard with key statistics about the detected gaps.
The tool is highly customizable, allowing users to filter by different types of gaps and customize how they are displayed on the chart.
🔶 USAGE
By default, the tool detects all price gaps between sessions. A price gap is defined as a difference between the opening price of one session and the closing price of the previous session. In this case, the tool uses the opening price of the first bar of the session against the closing price of the previous bar.
A bullish gap is detected when the session open price is higher than the last close, and a bearish gap is detected when the session open price is lower than the last close.
Gaps represent a change in market sentiment, a difference in what market participants think between the close of one trading session and the open of the next.
What is useful to traders is not the gap itself, but how the market reacts to it.
Unfilled gaps occur when prices do not return to the previous session's closing price.
Filled gaps occur when prices come back to the previous session's close price.
By analyzing how markets react to gaps, traders can understand market sentiment, whether different prices are accepted or rejected, and take advantage of this information to position themselves in favor of bullish or bearish market sentiment.
Next, we will cover the Gap Type Filter and Statistics Dashboard.
🔹 Gap Type Filter
Traders can choose from three options: display all gaps, display only overlapping gaps, or display only non-overlapping gaps. All gaps are displayed by default.
An overlapping gap is defined when the first bar of the session has any price in common with the previous bar. No overlapping gap is defined when the two bars do not share any price levels.
As we will see in the next section, there are clear differences in market behavior around these types of gaps.
🔹 Statistics Dashboard
The Statistics Dashboard displays key metrics that help traders understand market behavior around each type of gap.
Gaps: The percentage of bullish and bearish gaps.
Filled: The percentage of filled bullish and bearish gaps.
Reversed: The percentage of filled gaps that move in favor of the gap
Bars Avg.: The average number of bars for a gap to be filled.
Now, let's analyze the chart on the left of the image to understand those stats. These are the stats for all gaps, both overlapping and non-overlapping.
Of the total, bullish gaps represent 55%, and bearish ones represent 44%. The gap bias is pretty balanced in this market.
The second statistic, Filled, shows that 63% of gaps are filled, both bullish and bearish. Therefore, there is a higher probability that a gap will be filled than not.
The third statistic is reversed. This is the percentage of filled gaps where prices move in favor of the gap. This applies to filled bullish gaps when the close of the session is above the open, and to filled bearish gaps when the close of the session is below the open. In other words, first there is a gap, then it fills, and finally it reverses. As we can see in the chart, this only happens 35% of the time for bullish gaps and 29% of the time for bearish gaps.
The last statistic is Bars Avg., which is the average number of bars for a gap to be filled. On average, it takes between one and two bars for both bullish and bearish gaps. On average, gaps fill quickly.
As we can see on the chart, selecting different types of gaps yields different statistics and market behavior. For example, overlapping gaps have a greater than 90% chance of being filled, whereas non-overlapping gaps have a less than 40% chance.
🔶 SETTINGS
Gap Type: Select the type of gap to display.
🔹 Dashboard
Dashboard: Enable or disable the dashboard.
Position: Select the location of the dashboard.
Size: Select the dashboard size.
🔹 Style
Filled Bullish Gap: Enable or disable this gap and choose the color.
Filled Bearish Gap: Enable or disable this gap and choose the color.
Unfilled Gap: Enable or disable this gap and choose the color.
Max Deviation Level: Enable or disable this level and choose the color.
Open Price Level: Enable or disable this level and choose the color.

Volume-Confirmed Reversal Engine [AlgoPoint]Volume-Confirmed Reversal Engine v2.0
Overview
A price pattern alone is not enough to signal a high-probability reversal. True market turning points—moments of capitulation or euphoria—are almost always confirmed by a significant spike in volume.
The Volume-Confirmed Reversal Engine is designed to identify these exact moments. It filters out low-conviction price movements and focuses only on reversal patterns that are backed by meaningful volume activity.
How It Works
The indicator's logic is based on a sequential confirmation process:
- High-Volume Anchor Candle: The engine first scans for an "Anchor Candle"—a candle that makes a new high or low over a user-defined look_back period. Critically, this candle's volume must also be significantly higher than the recent average. Low-volume breakouts are ignored.
- Setup Activation & Visualization: When a valid Anchor Candle is detected, the indicator enters a "setup" phase. It visually marks this on your chart by drawing a Setup Box around the high and low of the Anchor Candle, extending it forward for the duration of the confirm_in window.
- Confirmation & Signal: A final signal is only triggered if the price breaks out of the opposite side of the Setup Box within the confirmation window. This action, combined with the initial volume spike, confirms the reversal.
- Setup Box Visualization: See exactly which candle the indicator is watching and the key price levels (the box boundaries) that need to be broken for a signal.
Signal Strength Score (1-4): Every signal now comes with a score, providing insight into its quality based on four factors:
- The base price pattern is met.
- The initial Anchor Candle had high volume.
- The final Confirmation Candle also had high volume.
- The signal is aligned with the long-term macro trend (e.g., a BUY signal above the 200 EMA).
Status Dashboard: A simple panel on your chart tells you what the indicator is doing in real-time ("Scanning for Setups," "Watching Bullish Setup," etc.) and displays a countdown for how many bars are left for a confirmation.
How to Interpret & Use
- The Box: When a colored box appears, it's an early warning that a reversal setup is active. Watch the boundaries of the box for a potential breakout.
- The Score: Use the score to gauge the quality of a signal. A 3/4 or 4/4 score represents a very high-conviction setup where multiple technical factors are aligned.
- The Dashboard: Use the panel to understand the indicator's current state and the time-sensitivity of an active setup.
- The BUY/SELL Labels: These are the final, actionable triggers, appearing only after the full price and volume confirmation process is complete.

Project Pegasus RevenantDescription
Project Pegasus Revenant is a reversal and liquidity-trap detection system combining a configurable fractal reversal engine with the SweepTrigger liquidity finder. It highlights potential structural turning points and stop-hunt scenarios directly on the chart.
What’s unique
Fractal Reversal Engine: Adjustable strictness (1 = loose, 5 = strict) to fit different market conditions.
Signal Filtering: Minimum bar spacing to avoid clustering of false or repeated signals.
SweepTrigger Add-on: Detects liquidity sweeps with wick-based rejection logic, auto-doji detection, and range-strength confirmation.
Dual Signal Output: Circle markers for pure fractal reversals, triangles for sweep-based liquidity traps.
Adaptive Filters: Customizable thresholds for body size, candle range, and sweep strength.
How it works (technical)
Fractals: A reversal fractal is confirmed when the high/low at position n is surrounded by lower/higher highs/lows across a configurable frontier.
Signal confirmation: Once price trades back through the fractal level within a limited number of bars, a potential reversal is triggered.
Bar filter: Signals require a minimum distance in bars to prevent noise.
SweepTrigger logic:
Wick comparison (upper vs lower) determines rejection direction.
Doji and low-body candles are auto-filtered.
Range check ensures the current candle exceeds a configurable multiple of the average range.
Visuals:
Green/Red circles = fractal reversals.
Cyan/Purple triangles = liquidity sweep triggers.
How to use
Watch fractal signals to anticipate structural reversal points.
Combine SweepTrigger signals with liquidity highs/lows for identifying stop hunts and fakeouts.
Use as standalone reversal tool or as confirmation within a broader system (e.g., order blocks, volume profile, or market structure).
Key settings
Reversal Mode: 1–5 (controls strictness of fractals).
SweepTrigger: On/off toggle, lookback window, body-size filter, range strength multiplier.
Visuals: Shapes, sizes, and color-coded signals for clear separation between fractal and sweep triggers.
Notes & limitations
Works on all timeframes.
Signals are reactive (based on confirmed bars), not predictive — no lookahead logic.
Too strict settings may reduce signal frequency; too loose may increase noise.
Disclaimer
For educational and informational purposes only. Not financial advice.

Extreme Pressure Zones Indicator (EPZ) [BullByte]Extreme Pressure Zones Indicator(EPZ)
The Extreme Pressure Zones (EPZ) Indicator is a proprietary market analysis tool designed to highlight potential overbought and oversold "pressure zones" in any financial chart. It does this by combining several unique measurements of price action and volume into a single, bounded oscillator (0–100). Unlike simple momentum or volatility indicators, EPZ captures multiple facets of market pressure: price rejection, trend momentum, supply/demand imbalance, and institutional (smart money) flow. This is not a random mashup of generic indicators; each component was chosen and weighted to reveal extreme market conditions that often precede reversals or strong continuations.
What it is?
EPZ estimates buying/selling pressure and highlights potential extreme zones with a single, bounded 0–100 oscillator built from four normalized components. Context-aware weighting adapts to volatility, trendiness, and relative volume. Visual tools include adaptive thresholds, confirmed-on-close extremes, divergence, an MTF dashboard, and optional gradient candles.
Purpose and originality (not a mashup)
Purpose: Identify when pressure is building or reaching potential extremes while filtering noise across regimes and symbols.
Originality: EPZ integrates price rejection, momentum cascade, pressure distribution, and smart money flow into one bounded scale with context-aware weighting. It is not a cosmetic mashup of public indicators.
Why a trader might use EPZ
EPZ provides a multi-dimensional gauge of market extremes that standalone indicators may miss. Traders might use it to:
Spot Reversals: When EPZ enters an "Extreme High" zone (high red), it implies selling pressure might soon dominate. This can hint at a topside reversal or at least a pause in rallies. Conversely, "Extreme Low" (green) can highlight bottom-fish opportunities. The indicator's divergence module (optional) also finds hidden bullish/bearish divergences between price and EPZ, a clue that price momentum is weakening.
Measure Momentum Shifts: Because EPZ blends momentum and volume, it reacts faster than many single metrics. A rising MPO indicates building bullish pressure, while a falling MPO shows increasing bearish pressure. Traders can use this like a refined RSI: above 50 means bullish bias, below 50 means bearish bias, but with context provided by the thresholds.
Filter Trades: In trend-following systems, one could require EPZ to be in the bullish (green) zone before taking longs, or avoid new trades when EPZ is extreme. In mean-reversion systems, one might specifically look to fade extremes flagged by EPZ.
Multi-Timeframe Confirmation: The dashboard can fetch a higher timeframe EPZ value. For example, you might trade a 15-minute chart only when the 60-minute EPZ agrees on pressure direction.
Components and how they're combined
Rejection (PRV) – Captures price rejection based on candle wicks and volume (see Price Rejection Volume).
Momentum Cascade (MCD) – Blends multiple momentum periods (3,5,8,13) into a normalized momentum score.
Pressure Distribution (PDI) – Measures net buy/sell pressure by comparing volume on up vs down candles.
Smart Money Flow (SMF) – An adaptation of money flow index that emphasizes unusual volume spikes.
Each of these components produces a 0–100 value (higher means more bullish pressure). They are then weighted and averaged into the final Market Pressure Oscillator (MPO), which is smoothed and scaled. By combining these four views, EPZ stands out as a comprehensive pressure gauge – the whole is greater than the sum of parts
Context-aware weighting:
Higher volatility → more PRV weight
Trendiness up (RSI of ATR > 25) → more MCD weight
Relative volume > 1.2x → more PDI weight
SMF holds a stable weight
The weighted average is smoothed and scaled into MPO ∈ with 50 as the neutral midline.
What makes EPZ stand out
Four orthogonal inputs (price action, momentum, pressure, flow) unified in a single bounded oscillator with consistent thresholds.
Adaptive thresholds (optional) plus robust extreme detection that also triggers on crossovers, so static thresholds work reliably too.
Confirm Extremes on Bar Close (default ON): dots/arrows/labels/alerts print on closed bars to avoid repaint confusion.
Clean dashboard, divergence tools, pre-alerts, and optional on-price gradients. Visual 3D layering uses offsets for depth only,no lookahead.
Recommended markets and timeframes
Best: liquid symbols (index futures, large-cap equities, major FX, BTC/ETH).
Timeframes: 5–15m (more signals; consider higher thresholds), 1H–4H (balanced), 1D (clear regimes).
Use caution on illiquid or very low TFs where wick/volume geometry is erratic.
Logic and thresholds
MPO ∈ ; 50 = neutral. Above 50 = bullish pressure; below 50 = bearish.
Static thresholds (defaults): thrHigh = 70, thrLow = 30; warning bands 5 pts inside extremes (65/35).
Adaptive thresholds (optional):
thrHigh = min(BaseHigh + 5, mean(MPO,100) + stdev(MPO,100) × ExtremeSensitivity)
thrLow = max(BaseLow − 5, mean(MPO,100) − stdev(MPO,100) × ExtremeSensitivity)
Extreme detection
High: MPO ≥ thrHigh with peak/slope or crossover filter.
Low: MPO ≤ thrLow with trough/slope or crossover filter.
Cooldown: 5 bars (default). A new extreme will not print until the cooldown elapses, even if MPO re-enters the zone.
Confirmation
"Confirm Extremes on Bar Close" (default ON) gates extreme markers, pre-alerts, and alerts to closed bars (non-repainting).
Divergences
Pivot-based bullish/bearish divergence; tags appear only after left/right bars elapse (lookbackPivot).
MTF
HTF MPO retrieved with lookahead_off; values can update intrabar and finalize at HTF close. This is disclosed and expected.
Inputs and defaults (key ones)
Core: Sensitivity=1.0; Analysis Period=14; Smoothing=3; Adaptive Thresholds=OFF.
Extremes: Base High=70, Base Low=30; Extreme Sensitivity=1.5; Confirm Extremes on Bar Close=ON; Cooldown=5; Dot size Small/Tiny.
Visuals: Heatmap ON; 3D depth optional; Strength bars ON; Pre-alerts OFF; Divergences ON with tags ON; Gradient candles OFF; Glow ON.
Dashboard: ON; Position=Top Right; Size=Normal; MTF ON; HTF=60m; compact overlay table on price chart.
Advanced caps: Max Oscillator Labels=80; Max Extreme Guide Lines=80; Divergence objects=60.
Dashboard: what each element means
Header: EPZ ANALYSIS.
Large readout: Current MPO; color reflects state (extreme, approaching, or neutral).
Status badge: "Extreme High/Low", "Approaching High/Low", "Bullish/Neutral/Bearish".
HTF cell (when MTF ON): Higher-timeframe MPO, color-coded vs extremes; updates intrabar, settles at HTF close.
Predicted (when MTF OFF): Simple MPO extrapolation using momentum/acceleration—illustrative only.
Thresholds: Current thrHigh/thrLow (static or adaptive).
Components: ASCII bars + values for PRV, MCD, PDI, SMF.
Market metrics: Volume Ratio (x) and ATR% of price.
Strength: Bar indicator of |MPO − 50| × 2.
Confidence: Heuristic gauge (100 in extremes, 70 in warnings, 50 with divergence, else |MPO − 50|). Convenience only, not probability.
How to read the oscillator
MPO Value (0–100): A reading of 50 is neutral. Values above ~55 are increasingly bullish (green), while below ~45 are increasingly bearish (red). Think of these as "market pressure".
Extreme Zones: When MPO climbs into the bright orange/red area (above the base-high line, default 70), the chart will display a dot and downward arrow marking that extreme. Traders often treat this as a sign to tighten stops or look for shorts. Similarly, a bright green dot/up-arrow appears when MPO falls below the base-low (30), hinting at a bullish setup.
Heatmap/Candles: If "Pressure Heatmap" is enabled, the background of the oscillator pane will fade green or red depending on MPO. Users can optionally color the price candles by MPO value (gradient candles) to see these extremes on the main chart.
Prediction Zone(optional): A dashed projection line extends the MPO forward by a small number of bars (prediction_bars) using current MPO momentum and acceleration. This is a heuristic extrapolation best used for short horizons (1–5 bars) to anticipate whether MPO may touch a warning or extreme zone. It is provisional and becomes less reliable with longer projection lengths — always confirm predicted moves with bar-close MPO and HTF context before acting.
Divergences: When price makes a higher high but EPZ makes a lower high (bearish divergence), the indicator can draw dotted lines and a "Bear Div" tag. The opposite (lower low price, higher EPZ) gives "Bull Div". These signals confirm waning momentum at extremes.
Zones: Warning bands near extremes; Extreme zones beyond thresholds.
Crossovers: MPO rising through 35 suggests easing downside pressure; falling through 65 suggests waning upside pressure.
Dots/arrows: Extreme markers appear on closed bars when confirmation is ON and respect the 5-bar cooldown.
Pre-alert dots (optional): Proximity cues in warning zones; also gated to bar close when confirmation is ON.
Histogram: Distance from neutral (50); highlights strengthening or weakening pressure.
Divergence tags: "Bear Div" = higher price high with lower MPO high; "Bull Div" = lower price low with higher MPO low.
Pressure Heatmap : Layered gradient background that visually highlights pressure strength across the MPO scale; adjustable intensity and optional zone overlays (warning / extreme) for quick visual scanning.
A typical reading: If the oscillator is rising from neutral towards the high zone (green→orange→red), the chart may see strong buying culminating in a stall. If it then turns down from the extreme, that peak EPZ dot signals sell pressure.
Alerts
EPZ: Extreme Context — fires on confirmed extremes (respects cooldown).
EPZ: Approaching Threshold — fires in warning zones if no extreme.
EPZ: Divergence — fires on confirmed pivot divergences.
Tip: Set alerts to "Once per bar close" to align with confirmation and avoid intrabar repaint.
Practical usage ideas
Trend continuation: In positive regimes (MPO > 50 and rising), pullbacks holding above 50 often precede continuation; mirror for bearish regimes.
Exhaustion caution: E High/E Low can mark exhaustion risk; many wait for MPO rollover or divergence to time fades or partial exits.
Adaptive thresholds: Useful on assets with shifting volatility regimes to maintain meaningful "extreme" levels.
MTF alignment: Prefer setups that agree with the HTF MPO to reduce countertrend noise.
Examples
Screenshots captured in TradingView Replay to freeze the bar at close so values don't fluctuate intrabar. These examples use default settings and are reproducible on the same bars; they are for illustration, not cherry-picking or performance claims.
Example 1 — BTCUSDT, 1h — E Low
MPO closed at 26.6 (below the 30 extreme), printing a confirmed E Low. HTF MPO is 26.6, so higher-timeframe pressure remains bearish. Components are subdued (Momentum/Pressure/Smart$ ≈ 29–37), with Vol Ratio ≈ 1.19x and ATR% ≈ 0.37%. A prior Bear Div flagged weakening impulse into the drop. With cooldown set to 5 bars, new extremes are rate-limited. Many traders wait for MPO to curl up and reclaim 35 or for a fresh Bull Div before considering countertrend ideas; if MPO cannot reclaim 35 and HTF stays weak, treat bounces cautiously. Educational illustration only.
Example 2 — ETHUSD, 30m — E High
A strong impulse pushed MPO into the extreme zone (≥ 70), printing a confirmed E High on close. Shortly after, MPO cooled to ~61.5 while a Bear Div appeared, showing momentum lag as price pushed a higher high. Volume and volatility were elevated (≈ 1.79x / 1.25%). With a 5-bar cooldown, additional extremes won't print immediately. Some treat E High as exhaustion risk—either waiting for MPO rollover under 65/50 to fade, or for a pullback that holds above 50 to re-join the trend if higher-timeframe pressure remains constructive. Educational illustration only.
Known limitations and caveats
The MPO line itself can change intrabar; extreme markers/alerts do not repaint when "Confirm Extremes on Bar Close" is ON.
HTF values settle at the close of the HTF bar.
Illiquid symbols or very low TFs can be noisy; consider higher thresholds or longer smoothing.
Prediction line (when enabled) is a visual extrapolation only.
For coders
Pine v6. MTF via request.security with lookahead_off.
Extremes include crossover triggers so static thresholds also yield E High/E Low.
Extreme markers and pre-alerts are gated by barstate.isconfirmed when confirmation is ON.
Arrays prune oldest objects to respect resource limits; defaults (80/80/60) are conservative for low TFs.
3D layering uses negative offsets purely for drawing depth (no lookahead).
Screenshot methodology:
To make labels legible and to demonstrate non-repainting behavior, the examples were captured in TradingView Replay with "Confirm Extremes on Bar Close" enabled. Replay is used only to freeze the bar at close so plots don't change intrabar. The examples use default settings, include both Extreme Low and Extreme High cases, and can be reproduced by scrolling to the same bars outside Replay. This is an educational illustration, not a performance claim.
Disclaimer
This script is for educational purposes only and does not constitute financial advice. Markets involve risk; past behavior does not guarantee future results. You are responsible for your own testing, risk management, and decisions.

Smart CRT Indicator📌 Smart CRT Indicator – Spot Trend Reversals and Continuations with Precision
The Smart CRT Indicator is a versatile price action tool that identifies Candle Range Trap (CRT) patterns—powerful setups that often precede either trend reversals or breakout continuations.
It detects and visualizes market conditions where price gets "trapped" within a prior range or breaks out deceptively, giving traders early insight into potential directional moves.
🔍 Key Features:
✅ Bullish & Bearish CRT Signals
Accurately spots both reversal and continuation setups using CRT logic across three core patterns.
✅ Flexible Range Close Filter
Customize how deeply the second candle closes within the first candle's range to fine-tune signal quality.
✅ Trend Filter (Optional)
Choose whether to only show signals aligned with the dominant trend, using a customizable SMA filter.
✅ Visual Range Mapping
Automatically draws range lines to mark key price zones for CRT patterns. Adjustable style, color, and width.
✅ Real-Time Alerts
Get notified instantly when a new CRT pattern appears on your chart.
🧠 CRT Pattern Types Detected:
Inside Bar CRT: A compression pattern inside a larger range that signals potential breakout or reversal.
Multi-Candle CRT: A group of smaller candles shrinking inside an anchor candle—often a sign of building momentum.
Purge CRT: A deceptive breakout beyond the previous candle’s range, followed by an immediate reversal.
⚙️ Best For:
Traders seeking trend continuation breakout setups
Traders looking to fade false moves or catch reversals
Price action traders who rely on candle structure and traps
Swing, intraday, or even scalping strategies
🧩 Tip:
Combine CRT signals with Key Levels, FVG, support/resistance or order block zones for high-probability confluence entries.

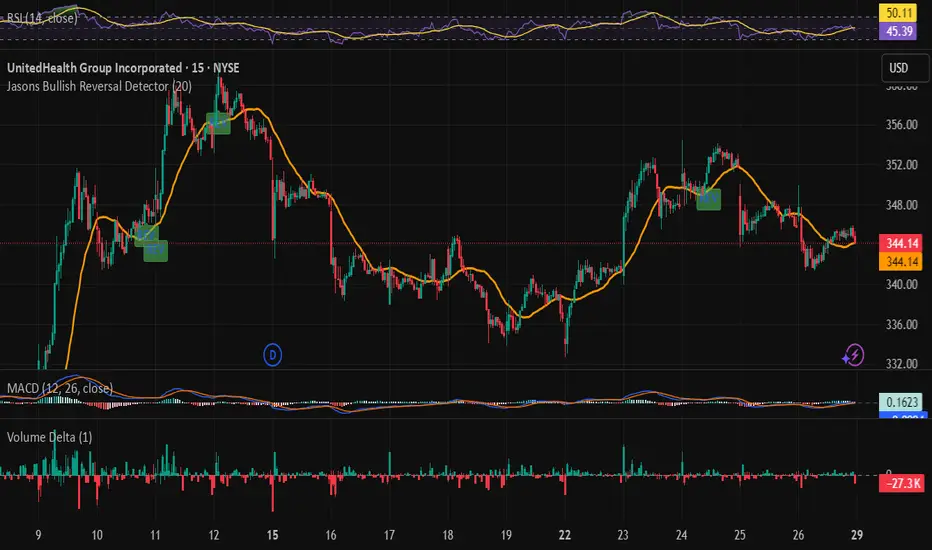
Jasons Bullish Reversal DetectorThis bullish reversal detector is designed to spot higher-quality turning points instead of shallow bounces. At its core, it looks for candles closing above the 20-period SMA, a MACD bullish crossover, and RSI strength above 50. On top of that, it layers in “depth” filters: price must reclaim and retest a long-term baseline (like the 200-period VWMA), momentum should confirm with RSI and +DI leading, short-term EMAs need to slope upward, and conditions like overheated ATR or strong downside ADX will block false signals. When all of these align, the script flags a depth-confirmed bullish reversal, aiming to highlight spots where structure, momentum, and volatility all support a sustainable shift upward.
Oscillator Matrix [Alpha Extract]A comprehensive multi-oscillator system that combines volume-weighted money flow analysis with enhanced momentum detection, providing traders with a unified framework for identifying high-probability market opportunities across all timeframes. By integrating two powerful oscillators with advanced confluence analysis, this indicator delivers precise entry and exit signals while filtering out market noise through sophisticated threshold-based regime detection.
🔶 Volume-Weighted Money Flow Analysis
Utilizes an advanced money flow calculation that tracks volume-weighted price movements to identify institutional activity and smart money flow. This approach provides superior signal quality by emphasizing high-volume price movements while filtering out low-volume market noise.
// Volume-weighted flows
up_volume = price_up ? volume : 0
down_volume = price_down ? volume : 0
// Money Flow calculation
up_vol_sum = ta.sma(up_volume, mf_length)
down_vol_sum = ta.sma(down_volume, mf_length)
total_volume = up_vol_sum + down_vol_sum
money_flow_ratio = total_volume > 0 ? (up_vol_sum - down_vol_sum) / total_volume : 0
🔶 Enhanced Hyper Wave Oscillator
Features a sophisticated MACD-based momentum oscillator with advanced normalization techniques that adapt to different price ranges and market volatility. The system uses percentage-based calculations to ensure consistent performance across various instruments and timeframes.
// Enhanced MACD-based oscillator
fast_ma = ta.ema(src, hw_fast)
slow_ma = ta.ema(src, hw_slow)
macd_line = fast_ma - slow_ma
signal_line = ta.ema(macd_line, hw_signal)
// Proper normalization using percentage of price
price_base = ta.sma(close, 50)
macd_normalized = macd_line / price_base
hyper_wave = macd_range > 0 ? macd_normalized / macd_range : 0
🔶 Multi-Factor Confluence System
Implements an intelligent confluence scoring mechanism that combines signals from both oscillators to identify high-probability trading opportunities. The system assigns strength scores based on multiple confirmation factors, significantly reducing false signals.
🔶 Fixed Threshold Levels
Uses predefined threshold levels optimized for standard oscillator ranges to distinguish between normal market fluctuations and significant momentum shifts. The dual-threshold system provides clear visual cues for overbought/oversold conditions while maintaining consistent signal criteria across different market conditions.
🔶 Overflow Detection Technology
Advanced overflow indicators identify extreme market conditions that often precede major reversals or continuation patterns. These signals highlight moments when market momentum reaches critical levels, providing early warning for potential turning points.
🔶 Dual Oscillator Integration
The indicator simultaneously tracks volume-weighted money flow and momentum-based price action through two independent oscillators. This dual approach ensures comprehensive market analysis by capturing both institutional activity and technical momentum patterns.
// Multi-factor confluence scoring
confluence_bull = (mf_bullish ? 1 : 0) + (hw_bullish ? 1 : 0) +
(mf_overflow_bull ? 1 : 0) + (hw_overflow_bull ? 1 : 0)
confluence_bear = (mf_bearish ? 1 : 0) + (hw_bearish ? 1 : 0) +
(mf_overflow_bear ? 1 : 0) + (hw_overflow_bear ? 1 : 0)
confluence_strength = confluence_bull > confluence_bear ? confluence_bull / 4 : -confluence_bear / 4
🔶 Intelligent Signal Generation
The system generates two tiers of reversal signals: strong signals that require multiple confirmations across both oscillators, and weak signals that identify early momentum shifts. This hierarchical approach allows traders to adjust position sizing based on signal strength.
🔶 Visual Confluence Zones
Background coloring dynamically adjusts based on confluence strength, creating visual zones that immediately communicate market sentiment. The intensity of background shading corresponds to the strength of the confluent signals, making pattern recognition effortless.
🔶 Threshold Visualization
Color-coded threshold zones provide instant visual feedback about oscillator positions relative to key levels. The fill areas between thresholds create clear overbought and oversold regions with graduated color intensity.
🔶 Candle Color Integration
Optional candle coloring applies confluence-based color logic directly to price bars, creating a unified visual framework that helps traders correlate indicator signals with actual price movements for enhanced decision-making.
🔶 Overflow Alert System
Specialized circular markers highlight extreme overflow conditions on both oscillators, drawing attention to potential climax moves that often precede significant reversals or accelerated trend continuation.
🔶 Customizable Display Options
Comprehensive display controls allow traders to toggle individual components on or off, enabling focused analysis on specific aspects of the indicator. This modularity ensures the indicator adapts to different trading styles and analytical preferences.
1 Week
1 Day
15 Min
This indicator provides a complete analytical framework by combining volume analysis with momentum detection in a single, coherent system. By offering multiple confirmation layers and clear visual hierarchies, it empowers traders to identify high-probability opportunities while maintaining precise risk management across all market conditions and timeframes. The sophisticated confluence system ensures that signals are both timely and reliable, making it an essential tool for serious technical analysts.

Dizzy HOLO🚀 Dizzy HOLO is an all-in-one professional trading suite designed for serious traders.
It combines Pivot Points, Opening Range Breakout (ORB), HOLO (High of Low / Low of High), Weekly Levels, SMA Thresholds, and Real-Time Alerts into a single lightweight indicator.
🔑 Key Features:
✅ Pivot Points (Fibonacci & Camarilla) – Automatic support & resistance with labels.
✅ Opening Range Breakout (ORB) – Custom session ORB with historical data and breakout alerts.
✅ HOLO Strategy – Daily High/Low, Highest H1 Open, Lowest H1 Close with dynamic buy/sell zones.
✅ Weekly Levels – Previous Week High/Low/Open/Close with extended dotted projections.
✅ SMA Threshold Zones – Dynamic SMA with gray zone filter and trend-based candle coloring.
✅ Multi-Timeframe Analysis – Auto-switching pivots & real-time confirmation.
✅ Smart Alerts – Pivot breakouts, ORB levels, HOLO crosses, and Weekly breaks.
🎯 Why Use Dizzy HOLO?
This indicator is built for breakout, reversal, and trend traders. It provides clear market structure, liquidity zones, and actionable alerts so you never miss important setups.
🛠️ Best Suited For:
Intraday scalpers
Swing traders
Breakout traders
HOLO strategy followers
Multi-timeframe traders

Estimated Manipulation Movement Signal [AlgoPoint]Follow the Footprints of Whale Movements That Drive the Market
Overview
The market is not always driven by natural supply and demand. Large players—often called "whales" or institutions—can create artificial price movements to trigger stop-losses, induce panic or FOMO, and build their large positions at favorable prices. These events are known as "stop hunts" or "liquidity grabs."
The EMMS indicator is a specialized tool designed to detect these specific moments of potential market manipulation. It does not follow trends in a traditional sense; instead, it identifies high-probability reversal points created by the calculated actions of Smart Money trapping other market participants.
How It Works: The 3-Module Logic
The indicator uses a multi-stage confirmation process to identify a potential stop hunt:
1. Anomaly Detection: The engine first scans the chart for "Anomaly Candles." These are candles with unusually high volume and a very long wick relative to their body. This combination signals a sudden, forceful, and potentially unnatural price push.
2. Liquidity Zone Detection: The indicator automatically identifies and tracks recent significant swing highs and lows. These levels are considered "Liquidity Zones" because they are areas where a large number of stop-loss orders are likely clustered. These are the "hunting grounds" for whales.
3. The Stop Hunt Signal: A final signal is generated only when these two events align in a specific sequence:
An Anomaly Candle (high volume, long wick) spikes through a previously identified Liquidity Zone.
The same candle then reverses, closing back inside the previous price range.
This sequence confirms that the move was likely a "trap" designed to engineer liquidity, and a reversal in the opposite direction is now highly probable.
How to Interpret & Use This Indicator
BUY Signal: A BUY signal appears after a sharp price drop that pierces a recent swing low (taking out the stops of long positions) and then aggressively reverses to close higher. This suggests that Smart Money has absorbed the panic selling they just induced. The signal indicates a potential move UP.
SELL Signal: A SELL signal appears after a sharp price spike that pierces a recent swing high (taking out the stops of short positions) and then aggressively reverses to close lower. This suggests that Smart Money has sold into the FOMO buying they just created. The signal indicates a potential move DOWN.
This indicator is best used as a high-probability confirmation tool, ideally in conjunction with your understanding of the overall market trend and structure.

Tristan's Star: 15m Shooting Star DetectorThis script is designed to be used on the 1-minute chart , but it analyzes the market as if you were watching the 15-minute candles.
Every cluster of 15 one-minute candles is grouped together and treated as a single 15-minute candle.
When that 15-minute “synthetic” candle looks like a shooting star pattern (small body near the low, long upper wick, short lower wick, bearish bias), the script triggers a signal.
At the close of that 15-minute cluster, the script will:
Plot a single “Sell” label on the last 1-minute bar of the group.
Draw a horizontal line across the 15 bars at the high, showing the level that created the shooting star.
Optionally display a table cell in the corner with the word “SELL.”
This lets you stay on the 1-minute timeframe for precision entries and exits, while still being alerted when the higher-timeframe (15-minute) shows a bearish reversal pattern.
