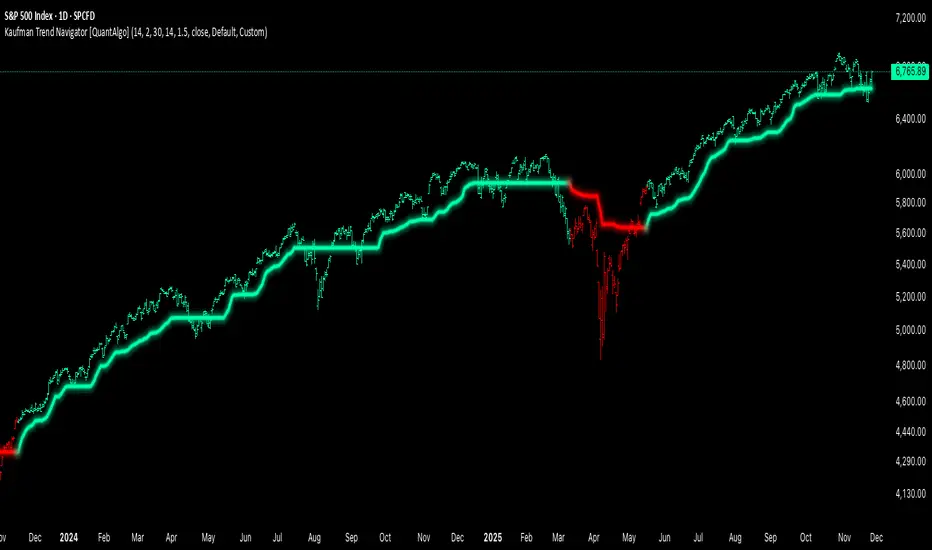
Kaufman Trend Navigator [QuantAlgo]🟢 Overview
The Kaufman Trend Navigator is an adaptive trend following system that combines efficiency-weighted price smoothing with volatility-adjusted bands to identify and track directional market movements. The indicator dynamically adjusts its sensitivity based on market conditions, becoming more responsive during trending periods and more conservative during consolidation. This dual-layer approach provides traders and investors with a systematic framework for trend identification, entry timing, and risk management across multiple timeframes and asset classes.
🟢 How It Works
The indicator employs an efficiency ratio mechanism that measures the directional movement of price relative to total price volatility over a defined lookback period. This ratio determines the adaptive response rate, allowing the system to distinguish between genuine directional moves and random market noise. When price exhibits strong directional characteristics, the internal smoothing accelerates to track the trend more closely. Conversely, during periods of low efficiency or choppy price action, the smoothing becomes more conservative to filter out false signals.
Volatility bands are constructed using normalized range measurements, creating dynamic upper and lower boundaries around the adaptive trend calculation. These bands expand and contract based on recent market volatility, providing context-dependent thresholds for trend validation. The trend line itself updates through a band-following logic where it tracks the relevant boundary based on the current directional bias, creating a stepping mechanism that maintains trend persistence while allowing for validated reversals.
The visual representation uses a gradient-weighted display to emphasize the primary trend line while maintaining clarity on price charts. Trend direction changes trigger when the internal logic confirms a boundary crossover, generating signals for potential position entries or exits. The system includes preset configurations calibrated for different trading timeframes, from responsive settings for scalping to smoother parameters suited for swing and position trading.
🟢 How to Use It
▶ Enter Long positions when the trend line transitions to Bullish (Green) coloring, which indicates upward directional bias has been established. Conversely, enter Short positions or exit Longs when the trend line shifts to Bearish (Red), which signals confirmed downward momentum.
The trend line itself can be used as dynamic support during uptrends and resistance during downtrends, providing logical areas for position management and stop placement. Price remaining above the line during bullish phases or below during bearish phases can also be used as a confirmation of trend strength and continuation probability.
▶ Built-in alert functionality provides real-time notifications for trend changes without requiring continuous chart monitoring. Configure alerts for Bullish Trend Signal to capture upward reversals, Bearish Trend Signal for downward shifts, or the general Trend Change alert to monitor both directions simultaneously. These alerts trigger only on confirmed trend transitions, reducing noise from intrabar fluctuations.
The indicator also includes six color presets (Classic, Aqua, Cosmic, Ember, Neon, Custom) to optimize visual clarity across different chart themes and lighting conditions. Select presets based on your monitor setup and background preference to ensure immediate trend recognition without visual strain. Bar coloring can be enabled to highlight trend direction directly on the price chart, eliminating the need to reference the trend line position during rapid market analysis.
🟢 Pro Tips for Trading and Investing
▶ Match the preset configuration (or your preferred settings) to your trading timeframe: use Fast Response for intraday charts (1-15 minutes), Default for swing trading (hourly to daily), and Smooth Trend for position trading (4-hour to weekly).
▶ Combine trend signals with volume analysis and market structure to filter lower-probability setups. During sideways markets, expect increased signal frequency with reduced reliability; consider waiting for the trend line to establish a clear slope before committing capital.
▶ Use the trend line as a trailing reference rather than a fixed stop level, allowing normal intrabar volatility while protecting against genuine reversals.
▶ For portfolio management, align position sizing with trend strength by observing the angle and consistency of the trend line progression.
Scalping
GRAM SCALP_PDH/PDL/P.POC/P.VAL/P.VAH_9/21EMA)This is a simple scalping strategy for futures markets (e.g., MNQ/ES), designed for prop firm challenges that require consistency and good R/R. It focuses on intraday trades during NY session (9:30 ET onward), using bias, EMAs, and key levels from prior Globex session (18:00–17:00 ET).
Goal: Set-and-forget limit orders in bias direction, aiming for small, consistent wins.
Daily Bias (Trend Detection):
Based on the first 15-min candle (9:30–9:45 ET).
If close > open (green): LONG ONLY bias – background shades green, label says "LONG ONLY".
If close < open (red): SHORT ONLY bias – background shades red, label says "SHORT ONLY".
Trade only in bias direction to avoid counter-trend risks. No bias? Sit out.
EMAs for Entries/Confirmation:
9 EMA (orange): Fast line for short-term trend/pullbacks.
21 EMA (purple): Slower line for overall direction.
Entry idea: Wait for price to pull back to 9/21 EMA in bias direction, then enter on bounce/break (e.g., long above EMA on green bias).
Use as dynamic support/resistance – don't trade if price is far from EMAs.
Key Levels from Prior Session (Globex 18:00–17:00 ET):
PDH (Previous Day High): Gray line – potential resistance/target for longs.
PDL (Previous Day Low): Gray line – potential support/target for shorts.
Volume Profile (VP):
POC (Point of Control, orange): Highest volume price – strong magnet; price often returns here.
VAH (Value Area High, fuchsia circles): Top of 70% volume range – resistance; break above = bullish.
VAL (Value Area Low, fuchsia circles): Bottom of 70% volume range – support; break below = bearish.
Use levels for entries (e.g., bounce off VAL for long), stops (behind level), or targets (e.g., aim for POC/VAH).
Trading Rules:
Session: NY open (9:30 ET) to close (16:00 ET). Avoid news/high volatility.
Bias Only: After 9:45 ET, check label/color – trade longs on green, shorts on red.
Entries: Set limit orders at key levels/EMAs in bias direction. E.g., long bias: Buy limit at VAL or EMA pullback.
Risk Management:
Stop Loss: Behind nearest level (e.g., below VAL for long) or fixed 10-20 ticks.
Take Profit: 1:2 risk-reward or at next level (e.g., PDH/POC).
Position Size: 1-2% risk per trade; max 5 trades/day for prop rules.
Exits: Trail with EMAs or exit at EOD. No overnight holds.
Avoid: Choppy markets, gaps through levels, or no clear bias.
Why It Works:
Bias filters bad trades; EMAs confirm momentum; VP/PDH/PDL provide high-probability zones based on where volume/price settled overnight.
Simple, mechanical – ideal for prop challenges (rules on drawdown, consistency).
Backtest on 2-min charts; aim for 60%+ win rate on small scalps (5-20 ticks).
Customize in indicator settings (e.g., VP bin size, line colors). Test on demo before live. Not financial advice – trade at own risk.10 web pages

Universal Scalper Indicator [Crypto/Forex/Gold]Universal Scalper Pro is an all-in-one scalping system designed for the 15-Minute Timeframe. It automates the analysis of trend, volatility, and risk management into a single, high-contrast dashboard.
Unlike standard crossover indicators, this system filters out low-volatility "noise" using a built-in ADX engine and automatically calculates dynamic Stop Loss and Take Profit levels based on market volatility (ATR).
It is engineered to work universally on:
Crypto (BTC, ETH, SOL, Altcoins)
Commodities (Gold, Silver, Oil)
Forex (Major & Minor Pairs)
Stocks (High volume tech stocks like NVDA, TSLA)
📈 How It Works (The Strategy)
1. The Trend Engine (9/21 EMA) The core logic utilizes a Fast (9) and Slow (21) Exponential Moving Average crossover.
Bullish Signal: The 9 EMA crosses above the 21 EMA.
Bearish Signal: The 9 EMA crosses below the 21 EMA. This specific combination is chosen for its responsiveness to 15-minute intraday trends.
2. The Noise Filter (ADX > 15) To prevent "whipsaws" (fake signals during sideways markets), the script includes a Volatility Filter based on the Average Directional Index (ADX).
Signals are rejected if the ADX is below 15.
This ensures you only receive alerts when there is sufficient momentum to sustain a move.
3. Dynamic Risk Management (ATR) The script uses the Average True Range (ATR) to calculate Stop Loss and Take Profit levels that adapt to the specific asset's volatility.
Stop Loss: Placed at 1.5x ATR from the entry. (Tight enough to preserve capital, wide enough to survive standard market noise).
Take Profit: Placed at 2.0x ATR from the entry. (Provides a healthy 1:1.3 Risk/Reward ratio).
🚀 Key Features
Universal Dashboard: A bottom-right panel displays the live Trend Status, Entry Price, Stop Loss, and Take Profit. It automatically formats decimals for any asset (e.g., 2 decimals for Gold, 5 for Forex, 8 for Crypto).
"Sticky" Memory: The dashboard retains the prices of the last valid signal, allowing you to manage your trade even after the signal candle closes.
Trend Cloud: A visual Green/Red zone between the EMAs helps you instantly identify the market bias.
Unified Alerts: A single alert setup ("Any alert() function call") sends the Asset Name, Entry, SL, and TP directly to your phone.
🛠️ How to Use
Timeframe: Set your chart to 15 Minutes (15m).
Wait for the Signal: Look for the "BUY" (Green) or "SELL" (Red) label on the chart.
Check the Dashboard: Ensure the "STATUS" is BULLISH (for buys) or BEARISH (for sells). If the status says "WAIT", do not trade.
Execute: Enter the trade using the exact Stop Loss and Take Profit levels shown on the dashboard.
⚠️ Risk Disclaimer
Trading financial markets involves high risk and may not be suitable for all investors. This indicator is a technical analysis tool and does not constitute financial advice. Past performance is not indicative of future results. Always practice with a demo account before trading real capital.

30s Model IndicatorThe Model
The 30s model is a NASDAQ (NQ) scalping strategy based on entries within 30-second fair-value gaps (FVGs), formed after liquidity is taken on a higher timeframe.
What the Indicator Does
The indicator identifies liquidity sweeps: swing highs/lows with at least "Left Pivot" bars to the left, capturing at least one prior swing high/low.
It then detects if a 30s FVG formed within "FVG Distance from Swing" bars of the latest liquidity-taking swing high/low.
If found, it verifies the FVG meets the "Minimum FVG Size" and that forming candles didn't hit the take-profit level.
When conditions match, the FVG is highlighted with entry, take-profit, and stop-loss lines, plus optional price labels. The appearance of all the elements can be customized in the indicator settings.
You can also setup alerts on the indicator that will trigger whenever a valid 30s is formed.
Error Conditions
Not running on 30s time-frame
Not using NQ, or MNQ

Time-Decay Liquidity Zones [BackQuant]Time-Decay Liquidity Zones
A dynamic liquidity map that turns single-bar exhaustion events into fading, color-graded zones, so you can see where trapped traders and unfinished business still matter, and when those areas have finally stopped pulling price.
What this is
This indicator detects unusually strong impulsive moves into wicks, converts them into supply or demand “zones,” then lets those zones decay over time. Each zone carries a strength score that fades bar by bar. Zones that stop attracting or rejecting price are gradually de-emphasized and eventually removed, while the most relevant areas stay bright and obvious.
Instead of static rectangles that live forever, you get a living liquidity map where:
Zones are born from objective criteria: volatility, wick size, and optional volume spikes.
Zones “age” using a configurable decay factor and maximum lifetime.
Zone color and opacity reflect current relative strength on a unified clear → green → red gradient.
Zones freeze when broken, so you can distinguish “active reaction areas” from “historical levels that have already given way”.
Conceptual idea
Large wicks with strong volatility often mark areas where aggressive orders met hidden liquidity and got absorbed. Price may revisit these areas to test leftover interest or to relieve trapped positions. However, not every wick matters for long. As time passes and more bars print, the market “forgets” some areas.
Time-Decay Liquidity Zones turns that idea into a rule-based system:
Find bars that likely reflect strong aggressive flows into liquidity.
Mark a zone around the wick using ATR-based thickness.
Assign a strength score of 1.0 at birth.
Each bar, reduce that score by a decay factor and remove zones that fall below a threshold or live too long.
Color all surviving zones from weak to strong using a single gradient scale and a visual legend.
How events are detected
Detection lives in the Event Detection group. The script combines range, wick size, and optional volume filters into simple rules.
Volatility filter
ATR Length — computes a rolling ATR over your chosen window. This is the volatility baseline.
Min range in ATRs — bar range (High–Low) must exceed this multiple of ATR for an event to be considered. This avoids tiny bars triggering zones.
Wick filters
For each bar, the script splits the candle into body and wicks:
Upper wick = High minus the max(Open, Close).
Lower wick = min(Open, Close) minus Low.
Then it tests:
Upper wick condition — upper wick must be larger than Min wick size in ATRs × ATR.
Lower wick condition — lower wick must be larger than Min wick size in ATRs × ATR.
Only bars with a sufficiently long wick relative to volatility qualify as candidate “liquidity events”.
Volume filter
Optionally, the script requires a volume spike:
Use volume filter — if enabled, volume must exceed a rolling volume SMA by a configurable multiplier.
Volume SMA length — period for the volume average.
Volume spike multiplier — how many times above the SMA current volume needs to be.
This lets you focus only on “heavy” tests of liquidity and ignore quiet bars.
Event types
Putting it together:
Upper event (potential supply / long liquidation, etc.)
Occurs when:
Upper wick is large in ATR terms.
Full bar range is large in ATR terms.
Volume is above the spike threshold (if enabled).
Lower event (potential demand / short liquidation, etc.)
Symmetric conditions using the lower wick.
How zones are constructed
Zone geometry lives in Zone Geometry .
When an event is detected, the script builds a rectangular box that anchors to the wick and extends in the appropriate direction by an ATR-based thickness.
For upper (supply-type) zones
Bottom of the zone = event bar high.
Top of the zone = event bar high + Zone thickness in ATRs × ATR.
The zone initially spans only the event bar on the x-axis, but is extended to the right as new bars appear while the zone is active.
For lower (demand-type) zones
Top of the zone = event bar low.
Bottom of the zone = event bar low − Zone thickness in ATRs × ATR.
Same extension logic: box starts on the event bar and grows rightward while alive.
The result is a band around the wick that scales with volatility. On high-ATR charts, zones are thicker. On calm charts, they are narrower and more precise.
Zone lifecycle, decay, and removal
All lifecycle logic is controlled by the Decay & Lifetime group.
Each zone carries:
Score — a floating-point “importance” measure, starting at 1.0 when created.
Direction — +1 for upper zones, −1 for lower zones.
Birth index — bar index at creation time.
Active flag — whether the zone is still considered unbroken and extendable.
1) Active vs broken
Each confirmed bar, the script checks:
For an upper zone , the zone is counted as “broken” when the close moves above the top of the zone.
For a lower zone , the zone is counted as “broken” when the close moves below the bottom of the zone.
When a zone breaks:
Its right edge is frozen at the previous bar (no further extension).
The zone remains on the chart, but is no longer updated by price interaction. It still decays in score until removal.
This lets you see where a major level was overrun, while naturally fading its influence over time.
2) Time decay
At each confirmed bar:
Score := Score × Score decay per bar .
A decay value close to 1.0 means very slow decay and long-lived zones.
Lower values (closer to 0.9) mean faster forgetting and more current-focused zones.
You are controlling how quickly the market “forgets” past events.
3) Age and score-based removal
Zones are removed when either:
Age in bars exceeds Max bars a zone can live .
This is a hard lifetime cap.
Score falls below Minimum score before removal .
This trims zones that have decayed into irrelevance even if their age is still within bounds.
When a zone is removed, its box is deleted and all associated state is freed to keep performance and visuals clean.
Unified gradient and color logic
Color control lives in Gradient & Color . The indicator uses a single continuous gradient for all zones, above and below price, so you can read strength at a glance without guessing what palette means what.
Base colors
You set:
Mid strength color (green) — used for mid-level strength zones and as the “anchor” in the gradient.
High strength color (red) — used for the strongest zones.
Max opacity — the maximum visual opacity for the solid part of the gradient. Lower values here mean more solid; higher values mean more transparent.
The script then defines three internal points:
Clear end — same as mid color, but with a high alpha (close to transparent).
Mid end — mid color at the strongest allowed opacity.
High end — high color at the strongest allowed opacity.
Strength normalization
Within each update:
The script finds the maximum score among all existing zones.
Each zone’s strength is computed as its score divided by this maximum.
Strength is clamped into .
This means a zone with strength 1.0 is currently the strongest zone on the chart. Other zones are colored relative to that.
Piecewise gradient
Color is assigned in two stages:
For strength between 0.0 and 0.5: interpolate from “clear” green to solid green.
Weak zones are barely visible, mid-strength zones appear as solid green.
For strength between 0.5 and 1.0: interpolate from solid green to solid red.
The strongest zones shift toward the red anchor, clearly separating them from everything else.
Strength scale legend
To make the gradient readable, the indicator draws a vertical legend on the right side of the chart:
About 15 cells from top (Strong) to bottom (Weak).
Each cell uses the same gradient function as the zones themselves.
Top cell is labeled “Strong”; bottom cell is labeled “Weak”.
This legend acts as a fixed reference so you can instantly map a zone’s color to its approximate strength rank.
What it plots
At a glance, the indicator produces:
Upper liquidity zones above price, built from large upper wick events.
Lower liquidity zones below price, built from large lower wick events.
All zones colored by relative strength using the same gradient.
Zones that freeze when price breaks them, then fade out via decay and removal.
A strength scale legend on the right to interpret the gradient.
There are no extra lines, labels, or clutter. The focus is the evolving structure of liquidity zones and their visual strength.
How to read the zones
Bright red / bright green zones
These are your current “major” liquidity areas. They have high scores relative to other zones and have not yet decayed. Expect meaningful reactions, absorption attempts, or spillover moves when price interacts with them.
Faded zones
Pale, nearly transparent zones are either old, decayed, or minor. They can still matter, but priority is lower. If these are in the middle of a long consolidation, they often become background noise.
Broken but still visible zones
Zones whose extension has stopped have been overrun by closing price. They show where a key level gave way. You can use them as context for regime shifts or failed attempts.
Absence of zones
A chart with few or no zones means that, under your current thresholds, there have not been strong enough liquidity events recently. Either tighten the filters or accept that recent price action has been relatively balanced.
Use cases
1) Intraday liquidity hunting
Run the indicator on lower timeframes (e.g., 1–15 minute) with moderately fast decay.
Use the upper zones as potential sell reaction areas, the lower zones as potential buy reaction areas.
Combine with order flow, CVD, or footprint tools to see whether price is absorbing or rejecting at each zone.
2) Swing trading context
Increase ATR length and range/wick multipliers to focus only on major spikes.
Set slower decay and higher max lifetime so zones persist across multiple sessions.
Use these zones as swing inflection areas for larger setups, for example anticipating re-tests after breakouts.
3) Stop placement and invalidation
For longs, place invalidation beyond a decaying lower zone rather than in the middle of noise.
For shorts, place invalidation beyond strong upper zones.
If price closes through a strong zone and it freezes, treat that as additional evidence your prior bias may be wrong.
4) Identifying trapped flows
Upper zones formed after violent spikes up that quickly fail can mark trapped longs.
Lower zones formed after violent spikes down that quickly reverse can mark trapped shorts.
Watching how price behaves on the next touch of those zones can hint at whether those participants are being rescued or squeezed.
Settings overview
Event Detection
Use volume filter — enable or disable the volume spike requirement.
Volume SMA length — rolling window for average volume.
Volume spike multiplier — how aggressive the volume spike filter is.
ATR length — period for ATR, used in all size comparisons.
Min wick size in ATRs — minimum wick size threshold.
Min range in ATRs — minimum bar range threshold.
Zone Geometry
Zone thickness in ATRs — vertical size of each liquidity zone, scaled by ATR.
Decay & Lifetime
Score decay per bar — multiplicative decay factor for each zone score per bar.
Max bars a zone can live — hard cap on lifetime.
Minimum score before removal — score cut-off at which zones are deleted.
Gradient & Color
Mid strength color (green) — base color for mid-level zones and the lower half of the gradient.
High strength color (red) — target color for the strongest zones.
Max opacity — controls the most solid end of the gradient (0 = fully solid, 100 = fully invisible).
Tuning guidance
Fast, session-only liquidity
Shorter ATR length (e.g., 20–50).
Higher wick and range multipliers to focus only on extreme events.
Decay per bar closer to 0.95–0.98 and moderate max lifetime.
Volume filter enabled with a decent multiplier (e.g., 1.5–2.0).
Slow, structural zones
Longer ATR length (e.g., 100+).
Moderate wick and range thresholds.
Decay per bar very close to 1.0 for slow fading.
Higher max lifetime and slightly higher min score threshold so only very weak zones disappear.
Noisy, high-volatility instruments
Increase wick and range ATR multipliers to avoid over-triggering.
Consider enabling the volume filter with stronger settings.
Keep decay moderate to avoid the chart getting overloaded with old zones.
Notes
This is a structural and contextual tool, not a complete trading system. It does not account for transaction costs, execution slippage, or your specific strategy rules. Use it to:
Highlight where liquidity has recently been tested hard.
Rank these areas by decaying strength.
Guide your attention when layering in separate entry signals, risk management, and higher-timeframe context.
Time-Decay Liquidity Zones is designed to keep your chart focused on where the market has most recently “cared” about price, and to gradually forget what no longer matters. Adjust the detection, geometry, decay, and gradient to fit your product and timeframe, and let the zones show you which parts of the tape still have unfinished business.

9/15 EMA Scalper 9/15 EMA Scalper — by uzairbaloch
This script is a price-action based scalping system built around the 9 EMA and 15 EMA trend structure.
It identifies short-term reversal points where the market pulls back into the EMAs and confirms direction with a strong candle signal.
The strategy looks for:
• A clear EMA trend (9 above 15 for buys, 9 below 15 for sells)
• Pullback into EMA9/EMA15 with candle bodies touching the fast EMA
• Strong confirmation candle (engulfing / strong momentum / controlled wick)
• Optional slope filter to avoid flat, choppy sessions
• Automatic trade labels showing Entry, SL and TP (based on R:R)
The script is designed for scalping on gold, indices, and high-volatility FX pairs.
It resets trade logic immediately after SL or TP is hit, so it can catch the next valid signal without delay.
This tool is meant as an indicator — not a full strategy — and can be used to visually mark high-probability EMA pullback setups with precise levels.
Author: uzairbaloch

TICK & ADD Market Internals SuiteOverview: This is the ultimate Market Internals tool designed for professional SPX/ES and NQ intraday traders.
Traders often monitor both TICK (for short-term timing) and ADD (for daily trend context). However, displaying them on the same chart is usually problematic due to their different scales (TICK ±1000 vs. ADD ±2000), causing chart compression.
Market Internals Suite solves this with a smart "Visual Scaling" algorithm, perfectly fusing TICK Candles and the ADD Line into a single, coherent pane.
Key Features
1.Hybrid Visualization:
· TICK (Foreground): Displayed as OHLC Candles to capture instant liquidity sweeps and wicks.
· ADD (Background): Displayed as a clean Line to show the underlying market breadth trend without clutter.
2.Smart Visual Scaling:
· To prevent chart distortion, the ADD line is visually scaled down (Default Ratio: 1.5).
· This aligns the ADD trend volatility with the TICK range, allowing you to instantly spot divergences or resonance between sentiment and trend.
3.Real-Time Data Dashboard:
· Never lose track of the actual numbers. A dashboard in the top-right corner displays the TRUE values for both TICK and ADD (unscaled).
· Customizable Text Size: You can adjust the dashboard font size (Small/Normal/Large/Huge) in the settings to fit your screen.
4.TICK Extreme Alerts:
· Visual Highlight: The chart background highlights (Green/Red) only when TICK hits the extreme ±1000 levels.
· The ADD line remains clean and alert-free to serve as a stable reference.
Strategy: Context + Timing:
1.Trend Resonance
When the ADD line trends upward and TICK candles consistently maintain levels above zero, it indicates a healthy, strong trend. This is a signal to look for trend-following long setups.
2.Divergence Analysis (The "Holy Grail" Signal)
This combination view makes spotting internal divergences incredibly easy:
· Bearish Divergence: When Price makes a New High, but the ADD line or TICK peaks make a Lower High. This suggests buying exhaustion beneath the surface and often precedes a reversal down.
· Bullish Divergence: When Price makes a New Low, but the ADD line or TICK lows make a Higher Low. This suggests that selling pressure is being absorbed, signaling a potential bounce or reversal up.

Liquidation Cascade Detector [QuantAlgo]🟢 Overview
The Liquidation Cascade Detector employs multi-dimensional microstructure analysis to identify forced liquidation events by synthesizing volume anomalies, price acceleration dynamics, and volatility regime shifts. Unlike conventional momentum indicators that merely track directional bias, this indicator isolates the specific market conditions where leveraged positions experience forced unwinding, creating asymmetric opportunities for mean reversion traders and market makers to take advantage of temporary liquidity imbalances.
These liquidation cascades manifest through various catalysts: overwhelming spot selling coupled with leveraged long liquidation forced unwinding creates downward spirals where organic sell pressure triggers margin calls, which generate additional selling that triggers more margin calls. Conversely, sudden large buy orders or coordinated buying can squeeze overleveraged shorts, forcing buy-to-cover orders that push price higher, triggering additional short stops in a self-reinforcing feedback loop. The indicator captures both scenarios, regardless of whether the initial catalyst is organic flow or forced liquidation.
For sophisticated traders/market makers deploying amplification strategies, this indicator serves as an early warning system for distressed order flow. By detecting the moments when cascading stop-losses and margin calls create self-reinforcing price movements, the system enables traders to: (1) identify forced participants experiencing capital pressure, (2) strategically add liquidity in the direction of panic flow to amplify displacement, (3) accumulate contra-positions during the overshoot phase, and (4) capture mean reversion profits as equilibrium pricing reasserts itself. This approach transforms destructive liquidation events into potential profit opportunities by systematically front-running and then fading coordinated forced selling/buying.
🟢 How It Works
The detection engine operates through a three-tier confirmation framework that validates liquidation events only when multiple independent market stress indicators align simultaneously:
► Tier 1: Volume Anomaly Detection
The system calculates bar-to-bar volume ratios to identify abnormal participation spikes characteristic of forced liquidations. The Volume Spike threshold filters for transactions where current volume significantly exceeds previous bar volume. When leveraged positions hit stop-losses or margin requirements, their simultaneous unwinding creates distinctive volume signatures absent during organic price discovery. This metric isolates moments when market makers face one-sided order flow from distressed participants unable to control execution timing, whether triggered by whale orders absorbing liquidity or cascading margin calls creating relentless directional pressure.
► Tier 2: Price Acceleration Measurement
By comparing current bar's absolute body size against the previous bar's movement, the algorithm quantifies momentum acceleration. The Price Acceleration threshold identifies scenarios where price velocity increases dramatically, a hallmark of cascading liquidations where each stop-loss triggers additional stops in a feedback loop. This calculation distinguishes between gradual trend development (irrelevant for amplification attacks) and explosive moves driven by forced order flow requiring immediate liquidity provision. The metric captures both panic selling scenarios where spot sellers overwhelm bid liquidity triggering long liquidations, and short squeeze dynamics where aggressive buying exhausts offer-side depth forcing short covering.
► Tier 3: Volatility Expansion Analysis
The indicator measures bar range expansion by computing the current high-low range relative to the previous bar. The Volatility Spike threshold captures regime shifts where intrabar price action becomes erratic, evidence that market depth has evaporated and order book imbalance is driving price. Combined with body-to-range analysis indicating strong directional conviction, this metric confirms that volatility expansion reflects genuine liquidation pressure rather than random noise or low-volume chop.
*Supplementary Confirmation Metrics
Beyond the three primary detection tiers, the system analyzes additional candle characteristics that distinguish genuine liquidation events from ordinary volatility:
► Candle Strength: Measures the ratio of candle body size to total bar range. High readings (above 60%) indicate strong directional conviction where price moved decisively in one direction with minimal retracement. During liquidations, distressed traders execute market orders that drive price aggressively without the normal back-and-forth of balanced trading. Strong-bodied candles with minimal wicks confirm forced participants are accepting any available price rather than attempting to minimize slippage, validating that observed volume and price acceleration stem from liquidation pressure rather than routine trading.
► Volume Climax: Identifies when current volume reaches the highest level within recent history. Climax volume events mark terminal liquidation phases where maximum panic or squeeze intensity occurs. These extreme participation spikes typically represent the final wave of forced exits as the last remaining stops are triggered or the final shorts capitulate. For mean reversion traders, volume climax signals provide optimal reversal entry timing, as they mark maximum displacement from equilibrium when all forced sellers/buyers have been exhausted.
*Directional Classification
The system categorizes cascades into two actionable classes:
1. Short Liquidation (Bullish Cascade): Upward price movement combined with cascade patterns equals forced short covering. This occurs when aggressive spot buying (often from whales placing large market orders) or coordinated buy programs exhaust available offer liquidity, spiking price upward and triggering clustered short stop-losses. Short sellers experiencing margin pressure must buy-to-close regardless of price, creating artificial demand spikes that compound the initial buying pressure. The combination of organic buying and forced covering creates explosive upward moves as each liquidated short adds buy-side pressure, triggering additional shorts in a self-reinforcing loop. Market makers can amplify this by lifting offers ahead of forced buy orders, then selling into the exhaustion at elevated levels.
2. Long Liquidation (Bearish Cascade): Downward price movement combined with cascade patterns equals forced long liquidation. This manifests when heavy spot selling (panic sellers, large institutional unwinds, or coordinated distribution) overwhelms bid-side liquidity, breaking through support levels where long stop-losses cluster. Over-leveraged longs facing margin calls must sell-to-close at any price, generating artificial supply waves that compound the initial selling pressure. The dual force of organic selling coupled with forced long liquidation creates downward spirals where each margin call triggers additional margin calls through further price deterioration. Amplification opportunities exist by hitting bids ahead of panic selling, accumulating long positions during the capitulation, and reversing as sellers exhaust.
🟢 How to Use
1. For Mean Reversion Traders
When the indicator highlights a short liquidation cascade (green background), this signals that shorts are experiencing forced buy-to-cover pressure, often initiated by whale bids or aggressive spot buying that triggered the squeeze. Mean reversion traders can interpret this as a temporary upward dislocation from fair value. As the dashboard shows declining momentum metrics and the cascade highlighting stops, this represents a potential fade opportunity. Enter short positions expecting price to revert back toward pre-cascade levels once the forced buying exhausts and the initial large buyer completes their accumulation.
When a long liquidation cascade triggers (red background), longs are undergoing forced sell-to-close liquidation, typically catalyzed by overwhelming spot selling that breached key support levels. This creates artificial downward pressure disconnected from fundamental value, as margin-driven forced selling compounds organic sell flow. Mean reversion traders wait for the cascade to complete (dashboard transitions from active liquidation status to neutral), then enter long positions anticipating snap-back toward equilibrium pricing as panic subsides and forced sellers are exhausted.
You can also monitor the dashboard's Volume Climax indicator. When it displays "YES" during an active cascade, this suggests the liquidation is reaching its terminal phase, whether driven by the final shorts being squeezed out or the last leveraged longs capitulating. Mean reversion entries become highest probability at this point, as maximum displacement from fair value has occurred. Wait for the next 1-3 bars after climax confirmation, then enter contra-trend positions with tight stops.
The Candle Strength metric also helps validate entry timing. When candle strength readings drop significantly after maintaining elevated levels during the cascade, this divergence indicates absorption is occurring. Market makers are stepping in to provide liquidity, supporting your mean reversion thesis. Strong candle bodies during the cascade followed by weaker bodies signal the forced flow is diminishing.
2. For Momentum & Trend Following Traders
When price breaks through a significant resistance level and immediately triggers a short liquidation cascade (green background), this confirms breakout validity through forced participation. Shorts positioned against the breakout are now experiencing margin pressure from the combination of breakout momentum and potential whale buying, creating self-reinforcing buying that propels price higher. Enter long positions during the cascade or immediately after, as the forced covering provides fuel for extended momentum continuation.
Conversely, when price breaks below key support and triggers a long liquidation cascade (red background), the breakdown is validated by forced selling from trapped longs. Heavy spot selling coupled with margin liquidations creates accelerated downside momentum as liquidations cascade through clustered stop-loss levels. Enter short positions as the cascade develops, riding the combined force of organic selling and forced liquidation for extended trend moves.
3. For Sophisticated Traders & Market Makers
► Amplification Attack Execution
Sophisticated operators can exploit cascades through systematic amplification positioning. When a short liquidation is detected (green highlight activating), often initiated by whale bids absorbing offer liquidity, place aggressive buy orders to front-run and amplify the forced short covering. This exacerbates upward pressure, pushing price further from equilibrium and triggering additional clustered stops. Simultaneously begin accumulating short positions at these artificially elevated levels. As dashboard metrics indicate cascade exhaustion (volume spike declining, climax signal appearing, candle strength weakening), flatten amplification longs and hold accumulated shorts into the mean reversion.
For long liquidations (red highlight), typically catalyzed by heavy spot selling overwhelming bid depth, execute the inverse strategy. Place aggressive sell orders to compound the panic selling, amplifying downward displacement and accelerating margin call triggers. Layer long entries at depressed prices during this amplification phase as forced liquidation selling creates artificial supply. When dashboard signals cascade completion (metrics normalizing, volume climax passing), exit amplification shorts and maintain long positions for the reversal trade.
► Market Making During Liquidity Crises
During detected cascades, temporarily adjust quote placement strategy. When dashboard shows all three confirmation metrics activating simultaneously with strong candle bodies, this indicates the highest probability liquidation event, whether from whale order flow or cascading margin calls. Widen spreads dramatically to capture enhanced edge during the liquidity vacuum. Alternatively, step away from quote provision entirely on your natural inventory side (stop offering during short cascades driven by aggressive buying, stop bidding during long cascades driven by overwhelming selling) to avoid adverse selection from forced flow.
Use cascade detection to inform inventory management. During short cascades initiated by large buy orders or short squeezes, reduce existing short inventory exposure while allowing the forced buying to push price higher. Rebuild short inventory only at the inflated levels created by liquidation pressure. During long cascades where spot selling compounds leveraged liquidation, reduce long inventory and use the forced selling to reaccumulate at artificially depressed prices rather than providing stabilizing liquidity too early.
► Sequential Positioning Strategy
Advanced traders can structure trades in phases: (1) Initial amplification orders placed immediately upon cascade detection to front-run forced flow, (2) Contra-position accumulation scaled in as displacement extends and dashboard readings intensify, (3) Amplification trade exit when metrics show deceleration or candle strength weakens, (4) Contra-position hold through mean reversion, targeting pre-cascade price levels. This sequential approach extracts profit from both the dislocation phase and the subsequent equilibrium restoration.
► Risk Monitoring
If cascade highlighting persists across many consecutive bars while dashboard volume readings remain extremely elevated with sustained strong candle bodies, this suggests sustained institutional deleveraging or persistent whale activity rather than simple retail liquidation. Reduce amplification position sizing significantly, as these extended events can exhibit delayed mean reversion. Professional counter-parties may be establishing dominant positions, limiting your edge.
When volatility spike metrics decline while cascade highlighting continues, professional absorption is occurring. Proceed cautiously with amplification strategies, as intelligent liquidity providers are already positioning for the reversal, potentially front-running your intended reversal trade. Similarly, if large liquidation wicks appear during cascades, this indicates partial absorption is happening, suggesting more sophisticated players are taking the opposite side of distressed flow.

ATR Volatility AlertsOverview:
This is a dynamic alert tool based on the Average True Range (ATR), designed to help traders detect sudden price movements that exceed normal volatility levels. Whether you are trading breakouts or monitoring for abnormal spikes, this indicator visualizes these events on the chart and triggers system alerts when the price move exceeds your specified ATR multiplier.
Key Features:
Fully Customizable ATR Range:
You can adjust the ATR Length (Default: 14) and the Multiplier (Default: 1.5x).
Tip: Increase the multiplier (e.g., to 2.0 or 3.0) to catch only extreme volatility, or lower it for scalping smaller moves.
Visual Chart Signals:
Visual markers appear instantly when a bar's movement exceeds the ATR threshold.
Green Triangle: Indicates an Upward Spike.
Red Triangle: Indicates a Downward Spike.
Flexible System Alerts:
Designed to integrate seamlessly with TradingView's alert system. You can choose from three specific alert directions based on your strategy:
1.Price Spike Up: Triggers only on sharp upward moves.
2.Price Spike Down: Triggers only on sharp downward moves.
3.Bidirectional Volatility Alert: Triggers on BOTH huge pumps and dumps.
How to Set Alerts:
Click the "Create Alert" button in TradingView.
Select ATR Volatility Alerts in the "Condition" dropdown.
Choose the specific logic you need:
· Select Price Spike Up for bullish monitoring.
· Select Price Spike Down for bearish monitoring.
· Select Bidirectional Volatility Alert to watch for any volatility expansion.

TICK Indicator with Extreme AlertsOverview:
This indicator is designed to provide intraday traders (especially those trading SPX, ES, and NQ) with a clearer NYSE TICK analysis tool featuring visual alerts. Unlike traditional TICK line charts, this indicator utilizes OHLC Candlesticks to display data, allowing you to fully view the Open, High, Low, and Close within a specific timeframe, thereby capturing instantaneous liquidity sweeps.
Core Features & Logic:
Candlestick Visualization (OHLC Candles): Uses the USI:TICK.US data source by default. The candlestick patterns allow you to clearly see if the TICK pierced key levels intraday but retraced by the close—vital information that standard line charts often miss.
Dual Key Level System: The indicator is designed with two independent reference tiers for trend observation and reversal detection:
Reference Lines (+/- 800): Marked by gray dashed lines. These represent the standard bull/bear dividing zones. When TICK sustains above +800 or below -800, it typically indicates a strong trending market.
Extreme Alerts (+/- 1000): These thresholds are used to identify extreme market sentiment (overbought/oversold conditions).
Background Highlight Alerts (Visual Alerts): To reduce screen-watching fatigue, the indicator automatically highlights the candlestick background when extreme market sentiment occurs:
Green Background: Triggered when TICK High breaks above +1000. Represents extreme buying sentiment, potentially indicating exhaustion or a short squeeze.
Red Background: Triggered when TICK Low drops below -1000. Represents extreme panic selling (Washout), often serving as a potential signal for an intraday reversal or a short-term bottom.
Custom Settings:
All thresholds (800 reference lines, 1000 alert lines) are fully adjustable in the settings.
All colors (Candles, Reference Lines, Background Alert Colors) can be customized.
Use Cases: This tool is ideal for intraday counter-trend or trend-following trading when combined with Price Action analysis and key Support & Resistance levels.

Scalper Pro Pattern Recognition & Price Action📘 Scalper Pro Pattern Recognition & Price Action
Overview
Scalper Pro is a dynamic multi-layer trend recognition and price action strategy that integrates Supertrend, Smart Money Concepts (SMC), and volatility-based risk control.
It adapts to market volatility in real time to enhance entry precision and optimize risk.
⚠️ This script is for educational and research purposes only.
Past performance does not guarantee future results.
🎯 Strategy Objectives
Detect structural market shifts (BOS / CHoCH) automatically.
Identify Order Blocks (OB), Fair Value Gaps (FVG), and key liquidity zones.
Plot dynamic Take-Profit (TP) and Stop-Loss (SL) levels based on ATR.
Avoid low-volatility (sideways) conditions using ADX filtering.
Combine trend-following signals with structural confirmation.
✨ Key Features
Supertrend Entry Signals — Generates precise buy/sell markers based on price crossovers with the Supertrend line.
Order Block Detection — Automatically plots both Internal and Swing Order Blocks for smart money insights.
Fair Value Gap Visualization — Highlights inefficiency zones in bullish or bearish structures.
Market Structure Labels — Marks Break of Structure (BOS) and Change of Character (CHoCH) points for clear trend shifts.
Dynamic Risk Levels — Automatically generates TP/SL lines and price labels using ATR-based distance.
📊 Trading Rules
Long Entry:
• Price crosses above the Supertrend (ta.crossover(close, supertrend))
• ADX above sideways threshold (trend condition confirmed)
• Optional confirmation from a bullish BOS or CHoCH
Short Entry:
• Price crosses below the Supertrend (ta.crossunder(close, supertrend))
• ADX above threshold
• Optional confirmation from a bearish BOS or CHoCH
Exit (or Reverse):
• Opposite Supertrend crossover
• Price hits TP/SL lines
• Trend shift confirmed by internal BOS/CHoCH
💰 Risk Management Parameters
Stop Loss & Take Profit based on ATR × risk multiplier
ATR Length: 14 (default)
Risk %: 3% per trade
Sideways Filter: ADX < 15 → no trade zone
TP1–TP3 = Entry ± (ATR × 1~3)
⚙️ Indicator Settings
Supertrend Module:
ATR Length: 10
Factor: nsensitivity × 7
ADX Module:
ADX Length: 15
Sideways Threshold: 15
EMA Set:
EMA (5, 9, 13, 34, 50) × Volatility Factor (3)
SMA Filter:
SMA(8) & SMA(9) for short-term trend confirmation
Smart Money Concepts Module:
Displays BOS/CHoCH, Order Blocks, FVGs, Equal Highs/Lows, and Premium/Discount zones
🔧 Improvements & Uniqueness
Integrates Supertrend momentum with Smart Money Concepts (SMC) structural analysis.
Dual detection layers: Internal (micro) and Swing (macro) structures.
ATR-driven auto labeling for entry, stop, and profit targets.
Premium/Discount and Equilibrium zones visualized on the chart.
Built-in ADX filter to skip low-trend market conditions.
✅ Summary
Scalper Pro Pattern Recognition & Price Action merges classical trend-following with modern market structure analytics.
It combines momentum detection, volatility control, and smart money mapping into one cohesive framework.
Unified trend, structure, and risk visualization.
Auto-marked BOS/CHoCH, OB, FVG, and liquidity zones.
Usable for scalping, intraday, or swing trading setups.
⚠️ This strategy is based on historical data and designed for educational use only.
Always apply sound risk management and forward testing before live trading.

Trading Sessions [QuantAlgo]🟢 Overview
The Trading Sessions indicator tracks and displays the four major global trading sessions: Sydney, Tokyo, London, and New York. It provides session-based background highlighting, real-time price change tracking from session open, and a data table with session status. The script works across all markets (forex, equities, commodities, crypto) and helps traders identify when specific geographic markets are active, which directly correlates with changes in liquidity and volatility patterns. Default session times are set to major financial center hours in UTC but are fully adjustable to match your trading methodology.
🟢 Key Features
→ Session Background Color Coding
Each trading session gets a distinct background color on your chart:
1. Sydney Session - Default orange, 22:00-07:00 UTC
2. Tokyo Session - Default red, 00:00-09:00 UTC
3. London Session - Default green, 08:00-16:00 UTC
4. New York Session - Default blue, 13:00-22:00 UTC
When sessions overlap, the color priority is New York > London > Tokyo > Sydney. This means if London and New York are both active, the background shows New York's color. The priority matches typical liquidity and volatility patterns where later sessions generally show higher volume.
→ Color Customization
All session colors are configurable in the Color Settings panel:
1. Click any session color input to open the color picker
2. Select your preferred color for that session
3. Use the "Background Transparency" slider (0-100) to adjust opacity. Lower values = more visible, higher values = more subtle
4. Enable "Color Price Bars" to color candlesticks themselves according to the active session instead of just the background
The Color column in the info table shows a block (█) in each session's assigned color, matching what you see on the chart background.
→ Information Table Breakdown
→ Timeframe Warning
If you're viewing a timeframe of 12 hours or higher, a red warning label appears center-screen. Session boundaries don't render accurately on high timeframes because the time() function in Pine Script can't detect intra-bar session changes when each bar spans multiple sessions. The warning tells you to switch to sub-12H timeframes (e.g., 4H, 1H, 30m, 15m, etc.) for proper session detection. You can disable this warning in Color Settings if needed, but session highlighting can be unreliable on 12H+ charts regardless.
→ Time Range Configuration
Every session's time range is editable in Session Settings:
1. Click the time input field next to each session
2. Enter time as HHMM-HHMM in 24-hour format
3. All times are interpreted as UTC
4. Modify these to account for daylight saving shifts or to define custom session periods based on your backtested optimal trading windows
For example, if your strategy performs best during London/NY overlap specifically, you could set London to 08:00-17:00 and New York to 13:00-22:00 to ensure you see the full overlap highlighted.
→ Weekdays Filter
The "Weekdays Only (Mon-Fri)" toggle controls whether sessions display on weekends:
Enabled: Sessions only show Monday-Friday and hide on Saturday-Sunday. Use this for markets that close on weekends (most equities, forex).
Disabled: Sessions display 24/7 including weekends. Use this for markets that trade continuously (crypto).
→ Table Display Options
The info table has several configuration options in Table Settings:
Visibility: Toggle "Show Info Table" on/off to display or hide the entire table.
Position: Nine position options (Top/Middle/Bottom + Left/Center/Right) let you place the table wherever it doesn't block your price action or other indicators.
Text Size: Four size options (Tiny, Small, Normal, Large) to match your screen resolution and visual preferences.
→ Color Schemes:
Mono: Black background, gray header, white text
Light: White background, light gray header, black text
Blue: Dark blue background, medium blue header, white text
Custom: Manual selection of all five color components (table background, header background, header text, data text, borders)
→ Alert Functionality
The indicator includes ten alert conditions you can access via TradingView's alert system:
Session Opens:
1. Sydney Session Started
2. Tokyo Session Started
3. London Session Started
4. New York Session Started
5. Any Session Started
Session Closes:
6. Sydney Session Ended
7. Tokyo Session Ended
8. London Session Ended
9. New York Session Ended
10. Any Session Ended
These alerts fire when sessions transition based on your configured time ranges, letting you automate monitoring of session changes without watching the chart continuously. Useful for strategies that trade specific session opens/closes or need to adjust position sizing when volatility regime shifts between sessions.

VWAP TrendSignalVWAP TrendSignal
VWAP (Volume-Weighted Average Price) is the market’s true fair value — the benchmark institutions use to see when price is balanced, extended, or trending with real intent.
Price often snaps back when it moves too far (mean reversion), and only shows genuine strength when it holds above or below VWAP.
VWAP TrendSignal makes this insight effortless by color-coding VWAP direction:
Yellow = VWAP rising → bullish pressure
Red = VWAP falling → bearish pressure
No bands. No noise. Just pure directional clarity.
Anchor VWAP to the Session, Week, Month, Quarter, or Year, and tailor the Slope Smoothing Filter to your timeframe:
1–2 smoothing → fast & reactive (1–5m scalping)
3–5 smoothing → clean & stable (5–15m intraday)
6–10 smoothing → slow flips (1H–4H swings)
10–15 smoothing → macro bias only (Daily/Weekly)
The line adapts to how you trade.
How to Use It
Mean Reversion
When price stretches far from VWAP, expect pullbacks or snapbacks.
Trend Direction
Yellow supports long bias, red supports short bias.
Simple, reliable, instantly visible.
Balance Zones
Price sitting near VWAP = compression, buildup, or chop.
A perfect signal to wait or prepare for a breakout.
Why It Works
VWAP TrendSignal distills institutional logic into a clean, single-line tool.
It shows fair value, trend slope, and balance all at once — making your chart clearer and your decisions faster.
Once you get used to reading it, trading without it feels blind.

Normalised Volume Oscillator [BackQuant]Normalised Volume Oscillator
A refined evolution of the Klinger Volume Oscillator, rebuilt for clarity, precision, and adaptability. This tool normalizes volume-driven momentum into a bounded scale so you can easily identify shifts in accumulation and distribution across any asset or timeframe, while keeping readings comparable between markets.
What this indicator does
The Normalised Volume Oscillator quantifies the balance between buying and selling pressure using the Klinger Volume Oscillator (KVO) as its base, then rescales it dynamically into a normalized range between -0.5 and +0.5. This normalization allows traders to interpret relative strength and exhaustion in volume flow, rather than dealing with raw unbounded values that differ across symbols.
It is a momentum-volume hybrid that reveals the strength of trend participation: when buyers dominate, normalized readings rise toward +0.5; when sellers dominate, they fall toward -0.5. The midline (0) acts as an equilibrium between accumulation and distribution.
Core components
Klinger Volume Oscillator: The foundation of this indicator, combining volume with price trend direction to measure long-term money flow relative to short-term movement.
Normalization process: The raw KVO is scaled over a user-defined Normalisation Period , computing `(KVO - lowest) / (highest - lowest) - 0.5`. This centers all readings around zero, allowing overbought/oversold detection independent of asset volatility or volume magnitude.
Signal moving average: The normalized KVO is smoothed with a user-selectable moving average type—SMA, EMA, DEMA, TEMA, HMA, ALMA, and others. This becomes the signal line for confirmation of trend direction or mean-reversion setups.
How it works conceptually
1. The KVO detects when volume supports price movement (bullish) or diverges from it (bearish).
2. The script normalizes the raw KVO so that relative magnitude is consistent—what is “strong buying pressure” looks the same on BTCUSD as it does on AAPL.
3. Overbought and oversold regions are derived statistically, rather than from arbitrary values, based on percentile zones around ±0.4 and ±0.5.
4. The oscillator is optionally combined with a moving average to help identify crossovers, momentum shifts, and divergence confirmation.
How to interpret it
Above 0: Indicates dominant buying pressure and likely continuation of upward momentum.
Below 0: Suggests dominant selling pressure and potential continuation of downward movement.
Crosses of 0: Often mark transitions between accumulation and distribution phases.
+0.4 to +0.5 zone: Overbought region where buying intensity is stretched; watch for deceleration or divergence.
[-0.4 to -0.5 zone: Oversold region indicating panic or exhaustion in selling.
Signal-line crossover: A traditional momentum confirmation method; when the normalized KVO crosses above its moving average, buyers regain control, and vice versa.
Why normalization matters
Typical volume oscillators are asset-specific—what is considered “high” volume for one symbol is not the same for another. By dynamically normalizing KVO values within a rolling lookback, this version transforms raw amplitude into a standardized scale. This means you can:
Compare multiple assets objectively.
Set consistent alert thresholds for overbought/oversold regions.
Avoid misleading interpretations from absolute oscillator values.
Customization and UI
Moving Average Type & Period: Select your preferred smoothing method (SMA, EMA, TEMA, etc.) and adjust its period to tune sensitivity.
Normalisation Period: Defines how many bars the KVO range is measured over; shorter periods adapt faster, longer ones smooth more.
Visual Toggles:
* Show Oscillator : enables or hides the core histogram.
* Show Moving Average : adds a smoothed overlay for signal confirmation.
* Paint Candles : optional color overlay for chart candles based on oscillator direction.
* Show Static Levels : displays ±0.4 and ±0.5 zones for overbought/oversold boundaries.
How to use it
Trend confirmation: Use midline (0) crossovers as confirmation of emerging trend shifts—cross above 0 suggests a new bullish phase, cross below 0 a bearish one.
Reversal spotting: Look for normalized readings reaching ±0.5 and flattening, or diverging against price extremes.
Divergence analysis: When price makes a new high but the normalized oscillator fails to, it signals waning buying conviction (and vice versa for lows).
Multi-timeframe integration: Works best alongside higher timeframe trend filters or moving averages; normalization makes this consistent.
Alerts
Prebuilt alert conditions allow quick automation:
Midline crossovers (0): transition between accumulation and distribution.
Overbought (+0.4) and Oversold (-0.4) triggers for potential exhaustion.
Signal moving-average crosses for confirmation entries.
Tips for use
Combine with price structure—don’t fade every overbought/oversold reading; confirm with break of structure or candle patterns.
Use longer normalization periods for position trading, shorter for intraday analysis.
In choppy markets, treat 0-line oscillations as noise filters, not trade triggers.
Summary
The Normalised Volume Oscillator modernizes the classic Klinger Volume Oscillator by normalizing its readings into a standardized range. This makes it more adaptive across assets and timeframes, improves interpretability, and provides intuitive, data-driven overbought/oversold levels. Whether used standalone or as a confirmation layer, it offers a clearer view of volume dynamics—revealing when markets are truly being accumulated, distributed, or stretched beyond their sustainable extremes.

MTF Checklist DashboardMTF Checklist Dashboard
Overview
The MTF Checklist Dashboard is an advanced multi-timeframe analysis tool that provides traders with a comprehensive visual dashboard to analyze market conditions across six customizable timeframes simultaneously. This indicator combines multiple technical analysis methods, including Opening Range Breakouts (ORB), VWAP, EMAs, and daily price levels, to generate high-probability confluence-based trading signals.
Unlike traditional single-timeframe indicators, this dashboard displays all critical information in one organized table, allowing traders to instantly identify when multiple timeframes align for optimal entry and exit opportunities.
Key Features
Multi-Timeframe Analysis
Analyzes up to 6 timeframes simultaneously (default: 1m, 5m, 15m, 30m, 1h, 4h)
Fully customizable timeframe selection via comma-separated input
Color-coded cells for instant visual recognition (green=bullish, red=bearish, yellow=neutral)
Technical Indicators Tracked
Current and previous candle direction
Opening Range Breakout (ORB) positioning with custom period
VWAP relationship (above/below)
200 EMA positioning
Daily and previous day high/low proximity
EMA crossovers (9 vs 21, both vs 200)
Advanced Signal Filtering System
Confluence scoring: Requires multiple timeframes to align (3-6 timeframes)
Higher timeframe confirmation: Ensures 30m/1h/4h agreement
Volume filter: Confirms signals with above-average volume (1.5x default)
ATR volatility filter: Validates sufficient market movement
Session timing: Restricts signals to optimal trading hours (EST)
Momentum confirmation: Requires recent directional strength
Range positioning: Blocks signals near daily extremes
Candle strength: Validates strong directional candles (60%+ body ratio)
Visual Signals
Optional entry arrows (above/below bars)
Background color highlighting
Organized dashboard with real-time price levels
ORB range, current day, and previous day summary rows
Alert Conditions
JSON-formatted alerts for automated trading integration
Separate alerts for long entry, short entry, long exit, and short exit
Compatible with webhook automation systems
How To Use
Dashboard Interpretation
The dashboard displays a color-coded table with the following columns:
TF: Timeframe being analyzed
C: Current candle (Green=bullish, Red=bearish)
P: Previous candle (Green=bullish, Red=bearish)
ORB: Opening Range Breakout position (A=Above, B=Below, W=Within)
VWAP: Price vs VWAP (A=Above, B=Below)
E200: Price vs 200 EMA (A=Above, B=Below)
D Hi/Lo: Proximity to current day high/low (Hi/Lo/Mid)
PD Hi/Lo: Proximity to previous day high/low (Hi/Lo/Mid)
9 vs 21: EMA 9 vs EMA 21 relationship (A=9 above 21, B=9 below 21)
9&21 v200: Both EMAs vs 200 EMA (>>=both above, <<=both below, <>=mixed)
Signal Generation
Long Entry Signal triggers when:
Minimum number of timeframes show bullish alignment (default: 5 of 6)
Higher timeframes (30m/1h/4h) confirm direction (default: 2 of 3)
Price breaks above ORB high with sufficient distance
Volume exceeds average by specified multiplier
ATR shows adequate volatility
Trade occurs during optimal session hours
Recent momentum is upward
Price not too close to daily high
Strong bullish candle forms
Short Entry Signal uses opposite conditions
Exit Signals trigger when opposing timeframe confluence reaches threshold (default: 3 timeframes)
Recommended Workflow
Select your asset and primary trading timeframe
Observe the dashboard - Look for rows showing mostly green (bullish) or red (bearish)
Wait for alignment - The indicator will show arrows when confluence requirements are met
Check the bottom rows - Review ORB levels and daily ranges for context
Set alerts - Enable TradingView alerts using the built-in alert conditions
Manage risk - Use appropriate position sizing and stop losses based on ORB range or daily ATR
Settings Guide
Basic Settings
Timeframes: Enter comma-separated values (e.g., "1,5,15,30,60,240")
Show Header: Toggle column headers on/off
ORB Minutes: Set opening range period (default: 15 minutes)
Near % for daily highs/lows: Define proximity threshold (default: 0.20%)
Use close for comparisons: Compare using close vs current price
Dashboard Position: Choose from 9 screen positions
Confluence Filters
Minimum Timeframes Aligned: Set required confluence (3-6, default: 5)
Require Higher Timeframe Confirmation: Toggle HTF requirement on/off
Min Higher Timeframes: Specify HTF agreement needed (1-3, default: 2)
Volume Filter
Volume Confirmation: Enable/disable volume filtering
Volume vs Average: Set multiplier threshold (default: 1.5x)
Volume Average Length: Period for volume average (default: 20 bars)
Volatility Filter (ATR)
Volatility Filter: Enable/disable ATR confirmation
ATR Length: Calculation period (default: 14)
Min ATR vs Average: Required ATR level (default: 0.5x = 50%)
ORB Filters
ORB Breakout Distance Required: Toggle distance requirement
Min Breakout % Beyond ORB: Additional breakout threshold (default: 0.10%)
Session Filter
Trade Only During Best Hours: Enable time-based filtering
Session 1: First trading window (default: 0930-1130 EST)
Session 2: Second trading window (default: 1400-1530 EST)
Momentum Filter
Recent Momentum Required: Enable directional momentum check
Lookback Bars: Period for momentum comparison (default: 3 bars)
Daily Range Filter
Block Signals Near Daily Extremes: Prevent entries at extremes
Distance from High/Low %: Minimum distance required (default: 2.0%)
Candle Filter
Strong Directional Candle: Require candle strength
Min Candle Body %: Body-to-range ratio threshold (default: 60%)
Visual Signals
Show Entry Signals: Master toggle for visual signals
Show Arrows: Display entry arrows on chart
Background Color: Enable background highlighting
Best Practices
Start with default settings and adjust based on your trading style and asset volatility
Higher confluence requirements (5-6 timeframes) produce fewer but higher-quality signals
Enable all filters for conservative trading; disable some for more frequent signals
Use the dashboard as confirmation alongside your existing trading strategy
Backtest on your specific instruments before live trading
Consider market conditions—trending vs ranging markets may require different settings
Alerts
This indicator includes four alert conditions with JSON formatting for webhook integration:
Long Entry Signal: Triggers when all long conditions are met
Short Entry Signal: Triggers when all short conditions are met
Long Exit Signal: Triggers when opposing confluence reaches exit threshold
Short Exit Signal: Triggers when opposing confluence reaches exit threshold
Alert messages include ticker symbol, action (buy/sell), price, and quantity for automated trading systems.
Important Notes
This indicator works best on liquid instruments with clear price action
Highly volatile markets may require adjusted ATR and ORB distance settings
Session times are in EST timezone—adjust if trading non-US markets
The ORB calculation requires sufficient price history for the day
Signals are generated in real-time but should be confirmed at candle close
Limitations
Maximum of 6 timeframes can be analyzed due to TradingView's security call limits
ORB calculations may not work correctly on instruments with gaps or irregular sessions
The indicator is most effective during regular market hours when volume and volatility are adequate
Lower timeframes (1m, 5m) may produce more false signals in choppy conditions
License
Mozilla Public License 2.0 (MPL-2.0)
This indicator is licensed under the Mozilla Public License 2.0. You are free to use, modify, and distribute this code under the terms of the MPL-2.0. The full license text is available at mozilla.org
Key license provisions:
You may use this code commercially
You may modify and distribute modified versions
Modified versions must be released under the same license
You must include the original license notice in any distributions
No trademark rights are granted
Disclaimer
This indicator is provided for educational and informational purposes only. It is not financial advice, and past performance does not guarantee future results. Trading involves substantial risk of loss. Always:
Practice proper risk management
Test thoroughly on paper/demo accounts before live trading
Use appropriate position sizing
Never risk more than you can afford to lose
Consult with a financial advisor for personalized advice
The creator assumes no liability for trading losses incurred using this indicator.
Version: 2.0
Pine Script Version: v6
Author: © EliasVictor

Frequency Momentum Oscillator [QuantAlgo]🟢 Overview
The Frequency Momentum Oscillator applies Fourier-based spectral analysis principles to price action to identify regime shifts and directional momentum. It calculates Fourier coefficients for selected harmonic frequencies on detrended price data, then measures the distribution of power across low, mid, and high frequency bands to distinguish between persistent directional trends and transient market noise. This approach provides traders with a quantitative framework for assessing whether current price action represents meaningful momentum or merely random fluctuations, enabling more informed entry and exit decisions across various asset classes and timeframes.
🟢 How It Works
The calculation process removes the dominant trend from price data by subtracting a simple moving average, isolating cyclical components for frequency analysis:
detrendedPrice = close - ta.sma(close , frequencyPeriod)
The detrended price series undergoes frequency decomposition through Fourier coefficient calculation across the first 8 harmonics. For each harmonic frequency, the algorithm computes sine and cosine components across the lookback window, then derives power as the sum of squared coefficients:
for k = 1 to 8
cosSum = 0.0
sinSum = 0.0
for n = 0 to frequencyPeriod - 1
angle = 2 * math.pi * k * n / frequencyPeriod
cosSum := cosSum + detrendedPrice * math.cos(angle)
sinSum := sinSum + detrendedPrice * math.sin(angle)
power = (cosSum * cosSum + sinSum * sinSum) / frequencyPeriod
Power measurements are aggregated into three frequency bands: low frequencies (harmonics 1-2) capturing persistent cycles, mid frequencies (harmonics 3-4), and high frequencies (harmonics 5-8) representing noise. Each band's power normalizes against total spectral power to create percentage distributions:
lowFreqNorm = totalPower > 0 ? (lowFreqPower / totalPower) * 100 : 33.33
highFreqNorm = totalPower > 0 ? (highFreqPower / totalPower) * 100 : 33.33
The normalized frequency components undergo exponential smoothing before calculating spectral balance as the difference between low and high frequency power:
smoothLow = ta.ema(lowFreqNorm, smoothingPeriod)
smoothHigh = ta.ema(highFreqNorm, smoothingPeriod)
spectralBalance = smoothLow - smoothHigh
Spectral balance combines with price momentum through directional multiplication, producing a composite signal that integrates frequency characteristics with price direction:
momentum = ta.change(close , frequencyPeriod/2)
compositeSignal = spectralBalance * math.sign(momentum)
finalSignal = ta.ema(compositeSignal, smoothingPeriod)
The final signal oscillates around zero, with positive values indicating low-frequency dominance coupled with upward momentum (trending up), and negative values indicating either high-frequency dominance (choppy market) or downward momentum (trending down).
🟢 How to Use This Indicator
→ Long/Short Signals: the indicator generates long signals when the smoothed composite signal crosses above zero (indicating low-frequency directional strength dominates) and short signals when it crosses below zero (indicating bearish momentum persistence).
→ Upper and Lower Reference Lines: the +25 and -25 reference lines serve as threshold markers for momentum strength. Readings beyond these levels indicate strong directional conviction, while oscillations between them suggest consolidation or weakening momentum. These references help traders distinguish between strong trending regimes and choppy transitional periods.
→ Preconfigured Presets: three optimized configurations are available with Default (32, 3) offering balanced responsiveness, Fast Response (24, 2) designed for scalping and intraday trading, and Smooth Trend (40, 5) calibrated for swing trading and position trading with enhanced noise filtration.
→ Built-in Alerts: the indicator includes three alert conditions for automated monitoring - Long Signal (momentum shifts bullish), Short Signal (momentum shifts bearish), and Signal Change (any directional transition). These alerts enable traders to receive real-time notifications without continuous chart monitoring.
→ Color Customization: four visual themes (Classic green/red, Aqua blue/orange, Cosmic aqua/purple, Custom) allow chart customization for different display environments and personal preferences.

Gold 1&5 Min Trading Strategy [TradingFinder] XAU Scalper Signal🔵 Introduction
Scalping in financial markets is based on immediate price reactions and precise analysis of price action behavior. In this trading approach, the trader must identify signals that originate directly from market structure, momentum shifts, candlestick formations, and the position of price relative to key zones.
Supply and demand areas serve as the primary regions of order concentration and form the foundation of scalping analysis, since they provide the most accurate representation of balance or imbalance between buyers and sellers as well as the active flow of liquidity in the market.
In demand zones, price reactions usually begin with the formation of reversal or continuation candlestick patterns. These patterns include structures such as Pin Bar, Engulfing, Doji, Failure, Rejection, and other forms of false breakout behavior, each of which can indicate a potential short term change in direction.
Liquidity plays a central role in these reactions, because price entering a demand zone typically coincides with the absorption of sell side liquidity and the restoration of order flow. This process often leads to rapid movements that are suitable for scalping. Therefore, combining candlestick confirmation with the location of price inside a supply or demand zone is one of the most reliable methods of identifying low risk scalping signals.
Demand zones include several structural variations, each representing a different form of liquidity behavior. One of the most well known examples is the order block, which is the final bearish candle before a strong bullish movement and indicates the presence of unfilled buy side interest.
Another important structure is the Fair Value Gap, which appears when a price void forms across three consecutive candles due to a lack of liquidity during the moment of displacement. The market often returns to this area to restore balance. Imbalance structures also represent one sided pressure in order flow where the market reacts later to correct these inefficiencies.
Breaker structure is another key element in demand analysis. A breaker is formed when an order block is violated and price returns to the same level after collecting liquidity, then continues in the opposite direction. This pattern often appears near liquidity based highs or lows and reflects a shift in the strength of market participants.
Together, order blocks, Fair Value Gaps, imbalances, and breakers form the core of demand analysis in price action and are widely used in precise scalping strategies due to their strong connection with liquidity and the high predictability of price reactions within them.
Bullish Setup :
Bearish Setup :
🔵 How to Use
This strategy is built on price action analysis, market reactions inside supply and demand zones, and confirmation through candlestick patterns. The first step is to identify key areas such as order blocks, Fair Value Gaps, imbalances, or breakers.
After these zones are located, price behavior within them is examined using candlestick structure and momentum direction. Entries are taken only when price reaches a validated zone, a clear sign of liquidity absorption or injection appears, and a confirming candlestick forms inside the zone.
This approach allows the trader to capture fast and precise entries during moments when the market is actively reacting to decision points.
🟣 Long Setup
In the buy setup, a valid demand zone must first be identified. This can be a bullish order block, an unfilled bullish Fair Value Gap, an imbalance at the lower part of structure, or a bullish breaker. When price enters this zone and shows signs of absorbing sell side liquidity, candlestick behavior must be examined.
Formation of reversal signals such as a Pin Bar with a long lower wick, bullish Engulfing, Rejection Candle, or a false breakout of the low, indicates a favorable shift in order flow. After receiving candlestick confirmation, a buy entry is taken within the same zone and the stop level is placed below the liquidity boundary. Targets are typically based on filling gaps, reaching supply zones, or returning to structural means.
🟣 Short Setup
In the sell setup, a valid supply zone must be recognized. This may include a bearish order block, a bearish Fair Value Gap, an imbalance at the upper part of structure, or a bearish breaker. When price enters this zone and liquidity accumulates above nearby highs, the probability of a fast momentum shift increases.
Confirmation occurs when a bearish reversal pattern forms such as Engulfing, Pin Bar with a long upper wick, indecisive Doji followed by rejection, or a false breakout of the high. After confirmation, the sell entry is placed and the stop level is set above the liquidity zone. Targets are selected based on filling lower Fair Value Gaps, reaching demand zones, or returning to structural midpoints.
🔵 Settings
Last Candle in Signal Direction : When On, a signal is issued only if the last candle moves in the direction required by the signal.
Signal in Nearly Zone : When enabled, the signal becomes valid even if the candle is near the zone rather than strictly inside it. When disabled, only signals formed inside the zone are allowed.
Allow Both Side Signals : When On, signals from both sides of the structure can be issued even if a limiting level exists. When disabled, only signals that do not violate the limiting level are allowed.
🔵 Conclusion
Using price action, supply and demand zones, and candlestick confirmation alongside liquidity analysis creates an effective framework for identifying fast market reactions in scalping conditions. Focusing on structures such as order blocks, Fair Value Gaps, imbalances, and breakers allows the trader to recognize shifts in momentum and changes in order flow with greater precision.
In this approach, entries are taken only when price reaches a validated zone, liquidity behavior is observable, and the confirming candle forms at the correct location. This leads to organized, low risk scalping signals that are aligned with the real time behavior of the market.

ATHENS Gold ICT + Smart Money [Advanced Signals]🎯 ADVANCED ICT + SMART MONEY CONFLUENCE INDICATOR
This indicator combines Inner Circle Trader (ICT) concepts with Smart Money theory to deliver high-probability trading signals based on institutional order flow and market structure.
━━━━━━━━━━━━━━━━━━━━━━━━━━━━━━━━━━━━━━━━
⚡ KEY FEATURES:
✅ ICT CONFLUENCE SYSTEM (0-4 Score)
• Order Blocks (Institutional Entry Zones)
• Fair Value Gaps (Price Imbalances)
• Liquidity Sweeps (Stop Hunt Detection)
• Market Structure (BOS & ChoCh)
✅ SMART SIGNALS
• Signals only trigger with minimum confluence
• Customizable requirements (OB/FVG/Liquidity)
• Filters out low-quality setups
• Higher win rate potential (65-85%)
✅ VISUAL COMPONENTS
• Order Blocks (OB+ / OB-)
• Fair Value Gaps (FVG↑ / FVG↓)
• Liquidity Zones (💧 markers)
• Break of Structure (BOS)
• Change of Character (ChoCh)
✅ PERSISTENT TP/SL LINES
• Entry, Stop Loss, TP1, TP2
• Automatically calculated from OB levels
• Lines extend across chart canvas
• Clear risk:reward visualization
✅ SMART DASHBOARD
• Real-time confluence score
• Component status (OB/FVG/Liquidity)
• Trend direction & RSI
• Signal strength indicator
━━━━━━━━━━━━━━━━━━━━━━━━━━━━━━━━━━━━━━━━
🎯 HOW IT WORKS:
The indicator scores each setup based on 4 key components:
1️⃣ ORDER BLOCK PRESENCE
• Bullish OB = Last bearish candle before strong move up
• Bearish OB = Last bullish candle before strong move down
• Price must be in OB zone
2️⃣ FAIR VALUE GAP (FVG)
• Gap between 3 candles indicating imbalance
• Price tends to fill these gaps
• Bounce from FVG = high probability entry
3️⃣ LIQUIDITY SWEEP
• Price sweeps recent high/low
• Retail stop losses triggered
• Smart money enters opposite direction
4️⃣ MARKET STRUCTURE
• Bullish = HH + HL
• Bearish = LH + LL
• Confirms trend direction
CONFLUENCE SCORE:
- 4/4 = Excellent (75-85% win rate)
- 3/4 = Good (65-75% win rate)
- 2/4 = Moderate (55-65% win rate)
- 1/4 = Weak (avoid)
━━━━━━━━━━━━━━━━━━━━━━━━━━━━━━━━━━━━━━━━
⚙️ CUSTOMIZABLE SETTINGS:
SIGNAL REQUIREMENTS:
- Require Order Block (ON/OFF)
- Require FVG (ON/OFF)
- Require Liquidity Sweep (ON/OFF)
- Minimum Confluence (1-4)
VISUAL SETTINGS:
- Show/Hide OB, FVG, BOS, ChoCh
- Adjustable lookback periods
- Customizable colors
- Line extension length
RISK MANAGEMENT:
- Risk:Reward ratio (1:1 to 5:1)
- Stop Loss buffer (%)
- Auto TP/SL calculation
- Clear old lines option
━━━━━━━━━━━━━━━━━━━━━━━━━━━━━━━━━━━━━━━━
📈 RECOMMENDED SETTINGS:
CONSERVATIVE (High Quality):
- Require OB: ON
- Require FVG: ON
- Min Confluence: 3/4
- Result: 1-2 signals/day, 70-80% win rate
BALANCED (Recommended):
- Require OB: ON
- Require FVG: OFF
- Min Confluence: 2/4
- Result: 2-4 signals/day, 60-70% win rate
AGGRESSIVE (More Signals):
- Require OB: OFF
- Require FVG: OFF
- Min Confluence: 2/4
- Result: 3-6 signals/day, 55-65% win rate
━━━━━━━━━━━━━━━━━━━━━━━━━━━━━━━━━━━━━━━━
🎯 BEST PRACTICES:
✅ Trade 3/4 or 4/4 confluence signals only
✅ Confirm with higher timeframe (H4/Daily)
✅ Trade during kill zones (London/NY open)
✅ Use proper position sizing (1-2% risk)
✅ Wait for all components to align
✅ Respect stop losses
✅ Take partial profits at TP1
❌ Don't trade 1/4 confluence signals
❌ Don't ignore liquidity sweeps
❌ Don't trade against higher TF trend
❌ Don't overtrade (quality > quantity)
━━━━━━━━━━━━━━━━━━━━━━━━━━━━━━━━━━━━━━━━
⚡ SIGNAL TYPES:
🟢 BUY SIGNAL (Green Triangle)
- Appears when bullish confluence met
- Label shows "BUY ICT"
- Blue entry line + Red SL + Green/Lime TPs
- Long opportunity
🔴 SELL SIGNAL (Red Triangle)
- Appears when bearish confluence met
- Label shows "SELL ICT"
- Blue entry line + Red SL + Green/Lime TPs
- Short opportunity
━━━━━━━━━━━━━━━━━━━━━━━━━━━━━━━━━━━━━━━━
📊 SUITABLE FOR:
- Gold (XAUUSD) - Optimized
- Forex pairs (Major pairs)
- Indices (US30, NAS100, SPX500)
- Crypto (BTC, ETH - adjust settings)
Recommended Timeframes:
- 15M - Primary for scalping
- 5M - Entry refinement
- 1H - Swing trading
- H4/Daily - Trend confirmation
━━━━━━━━━━━━━━━━━━━━━━━━━━━━━━━━━━━━━━━━
⚠️ DISCLAIMER:
This indicator is for educational purposes only. Past performance does not guarantee future results. Always:
- Practice on demo account first
- Use proper risk management
- Never risk more than you can afford to lose
- Seek professional financial advice
- Understand that trading carries risk
━━━━━━━━━━━━━━━━━━━━━━━━━━━━━━━━━━━━━━━━
🎓 BASED ON:
- ICT (Inner Circle Trader) Concepts
- Smart Money Theory
- Order Flow Analysis
- Institutional Trading Zones
- Market Structure Theory
━━━━━━━━━━━━━━━━━━━━━━━━━━━━━━━━━━━━━━━━
📢 FEATURES SUMMARY:
✅ Confluence-based signals (not random)
✅ Order Blocks + FVG + Liquidity integration
✅ Persistent TP/SL lines (scroll-friendly)
✅ Smart dashboard (real-time info)
✅ Customizable requirements
✅ High-probability setups
✅ Professional trading approach
✅ Works on multiple assets
✅ Clean visual presentation
✅ Beginner to advanced friendly
━━━━━━━━━━━━━━━━━━━━━━━━━━━━━━━━━━━━━━━━
Trade smart. Trade with confluence. 🎯
#ICT #SmartMoney #OrderBlocks #FVG #Gold #Forex #TradingStrategy #Confluence

BTC CME Gaps Detector [SwissAlgo]BTC CME Gaps Detector
Track Unfilled Gaps & Identify Price Magnets
------------------------------------------------------
Overview
The BTC CME Gap Detector identifies and tracks unfilled price gaps on any timeframe (1-minute recommended for scalping) to gauge potential trading bias.
Verify Gap Behavior Yourself : Use TradingView's Replay Mode on the 1-Minute chart to observe how the price interacts with gaps. Load the BTC1! ticker (Bitcoin CME Futures), enable Replay Mode, and play forward through time (for example: go back 15 days). You may observe patterns such as price frequently returning to fill gaps, nearest gaps acting as near-term targets, and gaps serving as potential support/resistance zones. Some gaps may fill quickly, while others may remain open for longer periods. This hands-on analysis lets you independently assess how gaps may influence price movement in real market conditions and whether you may use this indicator as a complement to your trading analysis.
------------------------------------------------------
Purpose
Price gaps occur when there is a discontinuity between consecutive candles - when the current candle's low is above the previous candle's high (gap up), or when the current candle's high is below the previous candle's low (gap down).
This indicator identifies and tracks these gaps on any timeframe to help traders:
Identify gap zones that may attract price (potential "price magnets")
Monitor gap fill progression
Assess potential directional bias based on nearest unfilled gaps (long, short)
Analyze market structure and liquidity imbalances
------------------------------------------------------
Why Use This Indicator?
Universal Gap Detection : Identifies all gaps on any timeframe (1-minute, hourly, daily, etc.)
Multi-Candle Mitigation Tracking : Detects gap fills that occur across multiple candles
Distance Analysis : Shows percentage distance to nearest bullish and bearish gaps
Visual Representation : Color-coded boxes indicate gap status (active vs. mitigated)
Age Filtering : Option to display only gaps within specified time periods (3/6/12/24 months), as older gaps may lose relevance
ATR-Based Sizing : Minimum gap size adjusts to instrument volatility to filter noise (i.e. small gaps)
------------------------------------------------------
Trading Concept
Gaps represent price zones where no trading occurred. Historical market behavior suggests that unfilled gaps may attract price action as markets tend to revisit areas of incomplete price discovery. This phenomenon creates potential trading opportunities:
Bullish gaps (above current price) may act as upside targets where the price could move to fill the gap
Bearish gaps (below current price) may act as downside targets where price could move to fill the gap
The nearest gap often provides directional bias, as closer gaps may have a higher probability of being filled in the near term
This indicator helps quantify gap proximity and provides a visual reference for these potential target zones.
EXAMPLE
Step 1: Bearish Gaps Appear Below Price
Step 2: Price Getting Close to Fill Gap
Step 3: Gap Mitigated Gap
------------------------------------------------------
Recommended Setup
Timeframe: 1-minute chart recommended for maximum gap detection frequency. Works on all timeframes (higher timeframes will show fewer, larger gaps).
Symbol: Any tradable instrument. Originally designed for BTC1! (CME Bitcoin Futures) but compatible with all symbols.
Settings:
ATR Length: 14 (default)
Min Gap Size: 0.5x ATR (adjust based on timeframe and noise level)
Gap Age Limit: 3 months (configurable)
Max Historical Gaps: 300 (adjustable 1-500)
------------------------------------------------------
How It Works
Gap Detection : Identifies price discontinuities on every candle where:
Gap up: current candle low > previous candle high
Gap down: current candle high < previous candle low
Minimum gap size filter (ATR-based) eliminates insignificant gaps
Mitigation Tracking : Monitors when price touches both gap boundaries. A gap is marked as filled when the price has touched both the top and bottom of the gap zone, even if this occurs across multiple candles.
Visual Elements :
Green boxes: Unfilled gaps above current price (potential bullish targets)
Red boxes: Unfilled gaps below current price (potential bearish targets)
Gray boxes: Filled gaps (historical reference)
Labels: Display gap type, price level, and distance percentage
Analysis Table: Shows :
Distance % to nearest bullish gap (above price)
Distance % to nearest bearish gap (below price)
Trade bias (LONG if nearest gap is above, SHORT if nearest gap is below)
------------------------------------------------------
Key Features
Detects gaps on any timeframe (1m, 5m, 1h, 1D, etc.)
Boxes extend 500 bars forward for active gaps, stop at the fill bar for mitigated gaps
Real-time distance calculations update on every candle
Configurable age filter removes outdated gaps
ATR multiplier ensures gap detection adapts to market volatility and timeframe
------------------------------------------------------
Disclaimer
This indicator is provided for informational and educational purposes only.
It does not constitute financial advice, investment recommendations, or trading signals. The concept that gaps attract price is based on historical observation and does not guarantee future results.
Gap fills are not certain - gaps may remain unfilled indefinitely, or the price may reverse before reaching a gap. This indicator should not be used as the sole basis for trading decisions.
All trading involves substantial risk, including the potential loss of principal. Users should conduct their own research, apply proper risk management, test strategies thoroughly, and consult with qualified financial professionals before making trading decisions.
The authors and publishers are not responsible for any losses incurred through the use of this indicator.

Trend Pulse Algo (LTM)Trend Pulse Algo LTM Indicator Description
Overview
Trend Pulse Algo LTM is an advanced multi layer technical indicator designed for TradingView that combines moving average MA crossovers confirmation signals pivot based structure analysis imbalance zone detection and overextension warnings to identify potential trend shifts continuations and reversal points. It aims to provide traders with reliable entry and exit signals in trending markets while highlighting areas of market inefficiency imbalances and overextended price moves that could signal exhaustion.
This indicator operates on a pulse concept where it detects rhythmic shifts in market momentum through layered MAs a quick MA for short term sensitivity a mid MA for intermediate confirmation and a long MA as a baseline trend filter. Signals are generated based on alignments and crosses between these MAs but with added layers of confirmation to reduce false positives such as requiring consecutive bars above below the long MA and breaks of prior pivot highs lows. It incorporates higher timeframe HTF analysis for imbalance zones to capture broader market context making it suitable for swing trading trend following or scalping on lower timeframes when combined with the overextension detector.
Unlike simple MA crossover systems for example standard dual EMA strategies this algo uses adaptive MA types based on timeframe pivot deviation for structural breaks and a tally based confirmation to filter noise. Imbalance zones identify fair value gaps or inefficiencies between candle bodies and wicks where price may retrace to fill. Overextension is calculated relative to the mid MA using a rolling mean absolute deviation MAD ratio highlighting potential tops bottoms in strong trends. The result is a visually clean or detailed based on mode overlay that colors bars backgrounds plots labels for signals and pivots and draws zones to guide decision making.
How It Works
MA Layers and Signal Generation
Three MAs quick mid long are computed using either SMA or EMA selected dynamically based on the charts timeframe for optimal responsiveness for example EMA on lower TFs for faster signals.
Early Signals A crossover of the quick MA above the mid MA while above the long MA triggers a Possible Bull label indicating early momentum shifts. A crossunder below triggers Possible Bear.
Confirmed Signals Bullish confirmation requires a set number of bars closing above the long MA plus alignment quick greater than mid and a break above the prior pivot high. Bearish requires bars below the long MA and a break below the prior pivot low. This uses a counter mechanism to ensure persistence reducing whipsaws. Breaks are detected via crossovers under of close versus prior highs lows.
State persistence tracks the current regime bull bear warn early coloring the chart accordingly until a new signal overrides it.
Pivot Detection and Structure
Pivots are identified by scanning for highs lows separated by a minimum bar depth with a percentage deviation threshold to confirm validity. This follows a zigzag like approach but with deviation filtering for robustness.
Labels like HH Higher High HL Higher Low LH Lower High LL Lower Low highlight market structure helping identify trends for example HH HL for uptrends or breakdowns. These are used internally to validate signal breaks.
Imbalance Zones
Zones detect imbalances or gaps between candle bodies and prior highs lows where unfilled inefficiencies attract price.
For bullish zones If open greater than close and high minus low two less than zero a zone is drawn from calculated top bottom limits. Bearish similarly for close greater than open.
Supports current TF HTF or both. Zones extend rightward until filled price touches the opposite side or mid line if enabled then either delete or shorten based on settings. Mid lines can act as fill triggers for partial closures.
HTF data is fetched via security for broader context resetting on new HTF bars.
Overextension Indicator
Measures price deviation from the mid MA relative to a rolling average RMA of relative deviations over a length.
Multipliers define tiers mild for example two times avg deviation moderate three times extreme four times. Circles plot above below bars in bull bear states when thresholds are exceeded signaling potential reversals for example red for extreme tops in uptrends. This is akin to a Bollinger Band squeeze expansion but normalized to MA distance for trend specific warnings.
Chart Coloring and Visuals
Background or candle coloring reflects the state green for bull red for bear orange for warn blue for early.
Modes control clutter Clean hides MAs zones pivots Balanced shows essentials Detailed includes all.
How to Use It
Setup Add to your chart via TradingViews indicator search. Adjust inputs based on asset timeframe for example shorter MA periods for volatile cryptos longer for stocks.
Trading Strategy Ideas
Trend Following Enter long on Confirmed Bull labels exit on Confirmed Bear or extreme overextension circles. Use imbalance zones as support resistance for stops targets for example buy dips to unfilled bullish zones.
Reversal Scalping Watch for Possible Bull Bear near pivot labels for example HL LL and overextension in the opposite direction. Confirm with zone fills.
Multi TF Analysis Set HTF to D for daily context on hourly charts zones from HTF often act as magnets.
Risk Management Place stops below prior lows in bulls or above highs in bears. Target zone edges or MA crosses. Avoid trading against strong states without confirmation.
Alerts Set up via TradingView for Early Up Down or Up Down Confirm to notify on signal edges.
Limitations Best in trending markets may lag in ranges. Test on historical data no indicator is foolproof combine with volume price action.
Detailed Input Settings
Below is a comprehensive breakdown of all user adjustable inputs from the settings panel grouped as in the script. Each explains what it controls its effect on the indicators logic and usage tips. Defaults are provided for reference.
Chart Mode
Chart Mode default Detailed Mode options Clean Mode Balanced Mode Detailed Mode
Controls visual detail level. Clean Mode hides MAs imbalance zones and pivots for a minimal overlay focused on signals and coloring. Balanced Mode shows MAs and signals but omits zones pivots. Detailed Mode displays everything for in depth analysis. Use Clean for live trading to reduce clutter Detailed for backtesting structure review.
Display Settings
Color Style default Candles options Background Candles
Determines how states bull bear warn early are visualized. Background colors the chart area for example green shading for bull. Candles colors bar bodies wicks directly. Background is subtler for multi indicator setups Candles emphasizes signals on naked charts.
Imbalance Zone HTF Config
Higher TF Period default D
Sets the higher timeframe for imbalance detection for example D for daily four H for four hour. This fetches broader data to identify significant zones. Use a TF four to five times your current for context for example daily on one H charts avoid very high TFs like W on intraday for relevance.
TF Mode default Current TF options Current TF Current plus HTF HTF Only
Defines timeframe handling for zones. Current TF uses only your charts TF. Current plus HTF combines both for layered zones. HTF Only ignores current TF. Current plus HTF is ideal for multi TF confluence HTF Only simplifies for swing traders.
Shift default ten min zero max five hundred
Horizontal offset in bars for current TF zone labels. Higher values shift labels rightward to avoid overlap. Adjust if labels crowd the chart.
HTF Shift default twenty min zero max five hundred
Similar to Shift but for HTF zone labels. Use larger offsets for HTF to distinguish them visually.
Imbalance Zone Core Options
Mid Line Fill default false
Enables a midpoint line in each zone zones fill close short when price touches this mid line instead of the far edge. Activates partial fill logic for more conservative zone closure. Enable for tighter risk in volatile markets.
Remove Filled Zones default true
If true completely deletes filled zones if false shortens them to the fill point keeping history. True clears clutter false retains context for review.
Display TF on Zone default false
Shows the timeframe for example D IZ on zone labels. Useful for distinguishing current versus HTF zones in combined mode.
Max Upward Zones default twenty min one max fifty
Limits displayed bullish upward zones removes oldest when exceeded. Lower for cleaner charts higher for historical depth.
Max Downward Zones default twenty min one max fifty
Same as above but for bearish downward zones.
Imbalance Zone Visuals
Upward Zone color green at ninety percent transparency
Color for current TF upward imbalance zones. Adjust opacity for visibility.
HTF Upward Zone color lime at eighty percent transparency
Color for higher timeframe upward imbalance zones. Differentiate from current for example lighter shade.
Downward Zone color red at ninety percent transparency
Color for current TF downward imbalance zones.
HTF Downward Zone color maroon at eighty percent transparency
Color for higher timeframe downward imbalance zones.
Mid Line Color color white at eighty five percent transparency
Color for the optional midpoint line in zones.
Text Color color white
Color for text labels on zones.
MA Layers
Quick MA Period default ten min one
Length for the fastest moving average sensitive to short term price. Shorter for example five for scalping longer for example fifteen for less noise.
Mid MA Period default twenty min one
Intermediate MA length used for crossovers and overextension base. Typically two times quick for balance.
Long MA Period default fifty min one
Baseline trend filter length. Longer for example one hundred for major trends shorter for active trading.
MA Variants by Period
Under one H default EMA options SMA EMA
MA type for timeframes under one hour for example EMA for faster response.
One H to less than five H default EMA options SMA EMA
MA type for one to five hour timeframes.
Five H to less than one D default EMA options SMA EMA
MA type for five hour to one day timeframes.
One D plus default EMA options SMA EMA
MA type for daily and higher timeframes. Adapt to market EMA for trends SMA for mean reversion.
Signal Confirmation
Bull Confirm Bars default one min zero
Consecutive bars needed above long MA for bull confirmation. Zero for instant higher for example three filters noise but delays entries.
Bear Confirm Bars default two min zero
Same for bear below long MA. Asymmetrical default higher for bears assumes uptrend bias.
Pivot Detection
Pivot Depth default six min one
Min bars between pivots. Higher reduces minor swings lower captures more structure.
Pivot Deviation percent default one point zero min zero point one
Percent change required for new pivot. Higher ignores small moves for example two percent for stocks zero point five percent for forex.
Display HH and HL default true
Shows labels for Higher Highs Lows bullish structure.
Display LH and LL default true
Shows labels for Lower Highs Lows bearish structure.
Overextension Indicator
Show Overextension Circles Potential Tops default true
Enables circles above bars in bull states for potential tops.
Show Overextension Circles Potential Bottoms default true
Enables below bars in bear states for bottoms.
Overextension Length default fourteen min one
Period for rolling relative deviation average. Matches RSI STOCH defaults for alignment.
Mild Multiplier default two point zero min zero point zero
Threshold for mild overextension yellow circle. Zero disables tier.
Moderate Multiplier default three point zero min zero point zero
For moderate orange.
Extreme Multiplier default four point zero min zero point zero
For extreme red. Tune lower for sensitive warnings in ranging markets.

Binary Options 1 Minute Signals [TradingFinder] 1 Min Strategy🔵 Introduction
At first sight, price movement in binary options appears random, but behind every move lies a clear logic of liquidity and market imbalance. The market is always driven by the hunt for liquidity and the continuous rebalancing that takes place around Fair Value Gaps (FVGs) and Order Blocks (OBs). These zones are where institutional activity is concentrated and where Smart Money creates the most significant reactions.
When price approaches a key liquidity zone, it often performs a Liquidity Sweep to capture orders resting around previous highs or lows. This move usually presents itself as a False Breakout. Price briefly breaks a level to trigger stop losses and collect liquidity, then quickly reverses direction. Understanding this false breakout behavior is essential for identifying high probability reversals in binary options trading.
After the liquidity sweep, price typically retraces into a Fair Value Gap or Order Block, where the market seeks balance and new orders are introduced. This interaction between liquidity, imbalance, and institutional order flow forms the core logic of every Smart Money trading model.
By focusing on Liquidity Sweeps, False Breakouts, and the structure of FVGs and OBs, traders can read the true intention behind price movements. What seems like random volatility becomes a structured cycle of liquidity collection and reaction, offering clear opportunities for precision-based binary entries.
Bullish Setup :
Bearish Setup :
🔵 How to Use
This indicator works within the Smart Money framework and focuses on the connection between Liquidity Sweep, False Breakout, Fair Value Gap (FVG) and Order Block (OB).
It is created to help traders identify the moment when the market finishes collecting liquidity and begins to show signs of reversal.
The indicator studies how price behaves around zones where liquidity is concentrated, such as previous highs and lows or areas with visible inefficiency. When a clear reaction forms and a valid candle pattern confirms the shift in direction, the indicator generates a signal that represents the activity of Smart Money.
This tool does not respond to random volatility or noise. It waits for structure, liquidity and confirmation to align together before providing an entry. As a result, every signal has a logical base related to institutional order flow rather than ordinary price fluctuations. This approach allows traders to focus only on the movements that reflect true liquidity behavior.
🟣 Long Setup
A bullish setup takes place when the market moves downward and reaches a sell-side liquidity zone located below previous swing lows. In this area, price performs a Liquidity Sweep by moving under key levels to trigger stop losses and capture liquidity from trapped sellers.
This movement usually appears as a False Breakout because the market breaks below a level for a short moment and then quickly moves back inside the range.
Around this zone, a bullish Order Block or Fair Value Gap (FVG) often exists, showing where institutional demand is active.
When the indicator detects the presence of liquidity collection together with a valid bullish confirmation candle near an OB or FVG, it creates a Call signal.
This marks the moment when Smart Money is shifting from selling pressure to accumulation, and a strong bullish move often follows. For binary entries, the best opportunity usually comes immediately after the confirmation candle closes.
The reaction tends to happen quickly because the liquidity grab has completed and new institutional buying pressure is entering the market. This type of setup often provides a clean and precise entry with a high probability of success.
🟣 Short Setup
A bearish setup happens when the market rises and enters a buy-side liquidity area above previous highs. Here, the market performs a Liquidity Sweep to trigger stop losses placed above those highs and to absorb liquidity from trapped buyers.
This pattern forms what traders recognize as a False Breakout because the price only breaks the level temporarily before reversing in the opposite direction. A bearish Order Block or Fair Value Gap (FVG) often appears around this zone, showing where institutional selling interest exists.
Once the liquidity sweep completes and a bearish confirmation candle closes, the indicator produces a Put signal that reflects the shift from buying to selling pressure by Smart Money.
This moment often leads to a fast downward reaction as the market rebalances and fills the nearby inefficiency.
The most effective entry for binary trading is right after the confirmation candle closes, when the false breakout and liquidity collection are both completed. The price usually reacts sharply as the market transitions from liquidity hunting to a new directional move. This setup represents a structured view of how liquidity drives market cycles and how Smart Money creates precise reversals through controlled imbalance and reaction.
🔵 Settings
Time Frame : Defines the timeframe used for analysis. If left blank, the indicator automatically uses the chart’s current timeframe.
Swing Period : Determines how many candles are used to identify structural turning points such as swing highs and swing lows. Higher values increase accuracy but reduce the number of signals.
Signal Type : Specifies the type of signal generated by the indicator. The option All shows every signal, Main Signal displays only the primary one, and Alternative Signal produces a secondary signal that appears one candle after the main signal for additional confirmation.
Candle Pattern : Enables candle pattern logic for reversal confirmation. When active, the indicator issues a signal only when a valid candle formation confirms the market reaction.
Candle LookBack Check : Verifies that the last few candles move in the opposite direction of the signal to be generated. This condition acts as a confirmation filter, ensuring that the signal appears only after a clear counter-move in price.
Last Candle Direction : Considers the direction of the most recent candle in the analysis. It helps determine whether the final candle moves with or against the current trend.
Last Candle Shadow Ratio : Sets the ratio between the last candle’s wick and body to refine confirmation accuracy. Higher values require longer wicks, indicating stronger rejection and a more reliable reversal pattern.
🔵 Conclusion
Trading with Smart Money logic means understanding how liquidity moves through the market.
Each Liquidity Sweep, False Breakout, Fair Value Gap (FVG) and Order Block (OB) reflects the process of collecting and redistributing orders.
This indicator captures that sequence and turns it into precise, structured signals for binary entries. When liquidity is absorbed and a candle confirmation appears, the market reveals its true direction.
At that moment, traders can act with confidence, following institutional flow instead of reacting to random price moves.
Success with this system comes from patience, confirmation, and a clear reading of liquidity behavior, the core principles behind every Smart Money reversal.

Pulsar Trading System-LITE📡 Pulsar Trading System
OVERVIEW
Pulsar is a comprehensive breakout trading system that combines dynamic support/resistance detection, trend filtering, and volume confirmation to identify high-probability entry opportunities. Unlike simple breakout indicators, Pulsar uses multi-timeframe analysis and adaptive ATR-based calculations to filter false signals and provide complete trade management from entry to exit.
WHAT MAKES THIS ORIGINAL
This indicator is unique in its integration of multiple complementary systems:
-Adaptive ATR Zones: Support and resistance levels are not static—they dynamically adjust based on current market volatility (ATR), creating entry zones that expand and contract with market conditions rather than using fixed price levels.
-Multi-Timeframe SuperTrend Filter: The trend filter operates on a higher timeframe than the chart (e.g., 5-minute SuperTrend on a 1-minute chart) to prevent counter-trend trades while maintaining granular entry precision. The visual ribbon with humorous warning text ("🚫 Don't Short - Trend is Your Friend! 📈") provides immediate trend awareness.
-Intelligent Cooldown System: After any trade exit (stop loss or take profit), the system enters a configurable cooldown period, preventing overtrading during choppy or consolidating market conditions—a critical feature often missing in breakout systems.
-Dynamic Trailing Stops: The trailing stop uses ATR multipliers to lock in profits while adapting to volatility, moving only in the favorable direction and never loosening.
-Comprehensive Dashboard: Real-time analysis displays trade status, entry prices, distances to targets in both points and ATR multiples, volume confirmation status, and cooldown countdown.
HOW IT WORKS
Core Detection Logic:
Pulsar identifies breakout opportunities by monitoring price interaction with dynamically calculated support and resistance levels:
Support/Resistance Calculation: Uses ta.lowest() and ta.highest() over a configurable lookback period to identify key levels, then adds ATR-based buffers (0.5 × ATR) to create entry zones.
Breakout Conditions:
Long Entry: Price closes above support buffer AND recent low touched support AND volume exceeds threshold
Short Entry: Price closes below resistance buffer AND recent high touched resistance AND volume exceeds threshold
SuperTrend Filter: A separate higher-timeframe SuperTrend calculation determines overall trend direction. Entries only trigger when breakout direction aligns with SuperTrend (bullish breakout + bullish trend, or bearish breakout + bearish trend).
Volume Confirmation: Current volume must exceed a configurable multiple of the 14-period SMA (default 1.0×) to confirm genuine interest in the breakout.
Cooldown Mechanism: After exit, the system tracks bars elapsed and blocks new signals until the cooldown period completes, preventing rapid-fire entries in ranging markets.
Trade Management:
Stop Loss: Calculated as entry zone ± (ATR × SL Multiplier)
Take Profit 1: Entry zone ± (ATR × TP1 Multiplier)
Take Profit 2: Entry zone ± (ATR × TP2 Multiplier)
Trailing Stop (optional): Updates every bar, moving the stop closer by maintaining distance of (ATR × Trailing Multiplier) from current price, but only in favorable direction
SuperTrend Calculation:
The SuperTrend uses standard methodology:
Upper Band = (High + Low) / 2 + (Multiplier × ATR)
Lower Band = (High + Low) / 2 - (Multiplier × ATR)
Direction changes when price crosses opposite band
The ribbon visualization adds a width offset (ATR × Ribbon Width) to create a filled zone rather than a single line.
HOW TO USE
Setup:
Add Pulsar to your chart (works best on liquid instruments like NQ, ES, CL)
Configure timeframe-specific settings (see recommendations below)
Enable SuperTrend Filter for trend-following mode, or disable for pure breakout mode
Set up alerts for Entry, TP1, TP2, and Stop Loss events
Recommended Settings by Timeframe:
1-Minute Charts:
Lookback Period: 10-15
SuperTrend Timeframe: 5 min
ATR Timeframe: 5 min (for stability)
Cooldown: 8-12 bars
Trailing Stop: Enabled with 0.8-1.0 multiplier
5-Minute Charts:
Lookback Period: 15-20
SuperTrend Timeframe: 15 min
ATR Timeframe: current chart
Cooldown: 5-8 bars
Trailing Stop: Optional
15-Minute+ Charts:
Lookback Period: 20-30
SuperTrend Timeframe: 1 hour
ATR Timeframe: current chart
Cooldown: 3-5 bars
Trailing Stop: Optional
Interpreting Signals:
Long/Short Zone Box: Green (long) or red (short) box appears when breakout conditions are met
Blue Entry Line: Shows your entry price
Red/Orange SL Line: Red = fixed stop, Orange = trailing stop (moves in real-time)
Green TP Lines: TP1 (closer) and TP2 (further) targets
SuperTrend Ribbon: Green = bullish trend (favor longs), Red = bearish trend (favor shorts)
Dashboard Status: Monitor trade state, distances, volume confirmation, and cooldown
Best Practices:
Use SuperTrend Filter: Significantly reduces false signals by avoiding counter-trend trades
Enable Cooldown on Fast Timeframes: Prevents overtrading on 1-5 minute charts
Volume Confirmation is Critical: Don't lower volume multiplier below 0.9 on futures
Use Higher Timeframe ATR: On 1-minute charts, use 5-minute ATR for stability
Avoid Major News Events: Disable during FOMC, NFP, CPI releases
Scale Out Strategy: Consider taking partial profits at TP1, letting remainder run to TP2
Parameter Optimization:
Start conservative and adjust based on results:
Too many stop-outs: Increase SL multiplier or SuperTrend multiplier
Missing good trades: Decrease volume multiplier or cooldown period
Too many false signals: Increase volume multiplier, lookback period, or cooldown
Profits not protected: Enable trailing stop or reduce trailing multiplier
KEY FEATURES
✅ Dynamic ATR-Based Zones: Entry, stop loss, and take profit levels automatically adjust to market volatility
✅ Multi-Timeframe Trend Filter: Uses higher timeframe SuperTrend to eliminate counter-trend trades
✅ Volume Confirmation: Filters low-volume false breakouts
✅ Intelligent Cooldown: Prevents overtrading with configurable post-trade waiting period
✅ Trailing Stop System: Optional dynamic stops that lock in profits using ATR distance
✅ Real-Time Dashboard: 13-row analysis showing trade status, targets, distances, volume, and cooldown
✅ Visual Ribbon Warnings: Humorous trend-following reminders on SuperTrend ribbon
✅ Complete Alert System: Notifications for entries, TP1, TP2, fixed stops, and trailing stops
✅ Customizable Visuals: Adjustable colors, dashboard position, text size, and line lengths
✅ Non-Repainting: Uses lookahead = barmerge.lookahead_off for all multi-timeframe calculations
SETTINGS EXPLAINED
SuperTrend Filter:
Enable: Toggle trend filtering on/off
Timeframe: Higher timeframe for trend analysis (recommended 3-5x chart timeframe)
ATR Period: Period for ATR calculation in SuperTrend (10-14 standard)
Multiplier: Distance from center band (2.5-3.5 for most markets)
Ribbon Width: Visual thickness of trend ribbon (0.2-0.5)
Core Parameters:
Lookback Period: Bars used to identify support/resistance (lower = more sensitive)
ATR Period: Bars for Average True Range calculation (14 is standard)
ATR Timeframe: Use higher timeframe ATR for smoother calculations on fast charts
Volume Multiplier: Required volume vs average (1.0 = average, 1.5 = 50% above average)
TP/SL:
SL Multiplier: Stop loss distance in ATR units (1.0-2.0 typical)
TP1 Multiplier: First target in ATR units (1.5-2.5 typical)
TP2 Multiplier: Second target in ATR units (2.0-3.5 typical)
Trailing Stop:
Enable: Activate dynamic trailing stop
Multiplier: Distance from current price in ATR units (0.8-1.5 typical)
Cooldown:
Enable: Prevent new signals after trade exit
Bars: Number of bars to wait before allowing next trade (higher on fast timeframes)
IMPORTANT NOTES
⚠️ Not a Holy Grail: No indicator is perfect. Pulsar is a tool that requires proper risk management, position sizing, and trading discipline.
⚠️ Backtest First: Test settings on historical data before live trading. Results vary by instrument, timeframe, and market conditions.
⚠️ Market Conditions Matter: Breakout systems perform best in trending markets. Consider reducing size or disabling during known choppy periods.
⚠️ Stop Loss is Mandatory: Always use the provided stop loss levels. Markets can move against you rapidly.
⚠️ Volume Data Required: This indicator requires volume data to function properly. It will display a warning if volume is unavailable.
⚠️ No Repainting: All multi-timeframe calls use non-repainting settings. What you see in real-time is what will be plotted historically.
TECHNICAL SPECIFICATIONS
Version: Pine Script v6
Type: Indicator (overlay = true)
Max Boxes: 500 (for zone visualization)
Max Lines: 500 (for TP/SL levels)
Max Labels: Unlimited (for annotations)
Repainting: None (uses lookahead = barmerge.lookahead_off)
COMPATIBLE INSTRUMENTS
Works best on liquid instruments with reliable volume data:
✅ Futures: NQ, MNQ, ES, MES, YM, MYM, RTY, M2K, CL, GC
✅ Forex: Major pairs (EUR/USD, GBP/USD, etc.)
✅ Stocks: Large-cap stocks with high volume
⚠️ Crypto: Works but requires higher ATR multipliers
❌ Low Volume Stocks: May produce unreliable signals
SUPPORT
For questions, suggestions, or to report issues, please comment below. I actively maintain this indicator and appreciate feedback from the community.
Enjoy trading with Pulsar! 🌟

Predicta Futures – Scalping Predictor with Confidence FilterPredicta Futures is an advanced short-term forecasting indicator that combines historical pattern similarity analysis with weighted technical signals to predict price movements 1–10 minutes ahead.
**Core Functionality**
The script scans up to 5,000 historical bars to identify structurally similar price patterns. It aggregates forward outcomes from matched patterns and integrates real-time signals from RSI, MACD, Bollinger Bands, volume momentum, and volatility. A composite confidence score filters signals, displaying only those meeting the user-defined threshold (default ≥68%).
**Key Outputs**
- Buy/sell triangles with text labels
- Dashed projection line to predicted price
- Dotted target and ATR-based stop lines
- Info panel showing forecast direction, confidence %, expected move %, pattern count, order book status, and data access details
**Customization & Performance**
- Execution modes: Fast, Balanced, Accurate
- Adaptive sampling with recency bias option
- Filters for volatility and market hours
- Adjustable weights, lookback period, and prediction horizon
**Use Cases**
Scalping, intraday trading, futures, cryptocurrencies, equities.
*Order book metrics are simulated (platform limitation). Technical analysis tool; not financial advice.*
