Live Economic Calendar by toodegrees⚠️ PLEASE READ ⚠️
Although this indicator is accurate in showcasing live and upcoming News Events, checking the original sources is always suggested. This indicator aims to save Time, but due to limitations it may not be 100% correct 100% of the Time.
Description:
The Live Economic Calendar indicator seamlessly integrates with external news sources to provide real-Time, upcoming, and past financial news directly on your Tradingview chart.
By having a clear understanding of when news are planned to be released, as well as their respective impact, analysts can prepare their weeks and days in advance. These injections of volatility can be harnessed by analysts to support their thesis, or may want to be avoided to ensure higher probability market conditions. Fundamentals and news releases transcend the boundaries of technical analysis, as their effects are difficult to predict or estimate.
Designed for both novice and experienced traders, the Live Economic Calendar indicator enhances your analysis by keeping you informed of the latest and upcoming market-moving news.
This is achieved with three different visual components:
News Table: A dedicated News Table shows the Day of the Week, Date, Time of the Day, Currency, Expected Impact, and News Name for each event (in chronological order). Once a news event has occurred, or the day is over, it will be greyed out – helping to focus on the next upcoming news events.
News Lines: Vertical lines plotted in the future help analysts monitor upcoming news events; vertical lines in the past help analysts spot and backtest previous news events that already occurred.
News Labels: Color-coded news labels will plot once the news events have occurred. This not only gives analysts a minimalistic visual cue, but also retains the information of which news were released at that Time in their tooltips.
Forex Factory Calendar News Feed:
The Forex Factory Data Feed includes news events from January 2007 to the present. The data is updated daily. Please see the Technical Description below for more information.
Forex Factory provides news for all major currencies and markets:
Australia (AUD)
Canada (CAD)
Switzerland (CHF)
China (CNY)
European Union (EUR)
United Kingdom (GBP)
Japan (JPY)
New Zealand (NZD)
United States of America (USD)
Further, there are four types of news impact, defined by respective color-coding which is retained to avoid confusion:
⚪ Holiday
🟡 Low Impact
🟠 Medium Impact
🔴 High Impact
News' Time of the day data is in 24H format, and 'All Day' news are marked at Daily candle open.
⚠️ Original Release Notes ⚠️
The original release of this indicator supports the Forex Factory News Calendar in EST (New York Time). Future updates will include multiple news sources, as well as supporting different Timezones.
Given Data limitations, the Daily chart can omit some data due to the market being close on some days. This will be fixed in the future once an efficient solution is implemented.
Key Features:
Impact-Based News Filtering: Filter news items based on their expected impact (holiday, low, medium, high) to focus on the most market-critical information.
Symbol-Specific News: Automatically filter news to display only what's relevant to the currency pair or trading symbol you are analyzing.
Custom Currency News: Want to see more than the news relevant to the current symbol? Toggle which markets' news you are most interested in.
Chart History: Keep your charts clean by displaying only the drawings of Today's news, or This Week's news.
Custom Lookback: Look further back in Time by choosing a custom number of Lookback Days, allowing you to backtest and keep in mind salient news events from the past.
Line and Label Customization: Both the News Lines and Labels are highly customizable (except the colors), allowing you to make the indicator yours.
Table History: Choose whether to focus on Today's news only, or the news for This Week.
Table Customization: The table colors and position are highly customizable, allowing you to make it fit your visual preference and your layouts' aesthetic.
"Wondering how it's done? 👇"
Technical Description:
This script utilizes Pine Seeds , a service integrated with TradingView for importing custom data. This stunning feature enables users to upload and access custom End Of Day (EOD) data, which can be updated as frequently as five times daily.
This data can be imported in one of two formats:
Single Value: integer or float
Candle Data: open, high, low, close, volume
Upon encountering Pine Seeds, I recognized its potential for importing financial news events. Given that Forex Factory is a primary source of financial news in my personal analysis, integrating it into my layouts seemed like an exciting opportunity. This integration is expected to provide significant value to users looking to integrate additional news feeds all in one place.
Development Challenges:
Format Limitations: News events must be converted into numerical values for import, due to the required Pine Seeds format.
Amount of Data: With all currencies considered, the system may encounter over 40 news events in a single day.
Data Availability: The reliance on End Of Day (EOD) data means that information for the current day is displayed with a delay, and accessing future data is not possible.
Solutions:
Encoding: Each news event is encoded as an integer in the "DCHHMMITYP" format.
D = day of the week
C = currency
HHMM = Time of day
I = news impact
TYP = event ID (see Event Library A and Event Library B )
To ensure data assignment for each candle across the open, high, low, close, and volume series, the value "999" is used as a placeholder:
Importing: Utilizing the encoding system, up to five news events per day can be imported for a singular Pine Seeds custom symbol.
By creating multiple custom Pine Seeds Symbols, efficient imports of a larger number of events is then easily achievable. Nine unique symbols have been established, accommodating up to 45 news events per day.
These symbols are searchable, and accessible as " TOODEGREES_FOREX_FACTORY_SLOT_N " where N ranges from 1 to 9.
The Pine Seeds data feed appears as follows:
Uploading Schedule: To ensure analysts are informed about current and upcoming week's news, events are uploaded one week in advance.
This approach is vital for preparing for potential market impacts across various asset classes and currencies, allowing visibility of an entire week's news ahead of Time.
Data Scraping:
Unfortunately Forex Factory doesn't offer an API to fetch their news feed.
Hence an ad hoc python scraper was developed to read and save news events from January 2007 till the present leveraging Selenium. The scraper algorithm is part of a larger script responsible for scraping data, formatting data, and creating all necessary datasets.
The pseudo-code for the python script is as follows:
Read and save news event data on Forex Factory
Format day of the week, currency, Time of the day, and impact data for the Encoding
Encode and save News Event IDs – Event ID dataset is created
Format news data for Pine Seeds (roll-back date by one week, assign news to open, high, low, close, and volume values)
Create Pine Seeds Datasets
This script is ran everyday at Futures market close (16:00 EST) to update the last part of the each dataset, ensuring accuracy, and taking into account last-minute news additions or revisions.
Once the data (next week's news) is imported by the Live Economic Calendar indicator, it's immediately decoded by leveraging the Forex Factory Decoding Library , and saved into an array.
Upon a new week open, the decoded data is used to plot news events on the chart and in the news table.
See the inner workings of these processes in the Forex Factory Utility Library .
Although these libraries are specifically built for this indicator, feel free to use them to create your own scripts. Looking forward to see what the Pine Script community comes up with!
Thank you for making it this far. Enjoy!
Ciao,
toodegrees
This tool is available ONLY on the TradingView platform.
Terms and Conditions
Our charting tools are provided for informational and educational purposes only and do not constitute financial, investment, or trading advice. Our charting tools are not designed to predict market movements or provide specific recommendations. Users should be aware that past performance is not indicative of future results and should not be relied upon for making financial decisions. By using our charting tools, the user agrees that Toodegrees and the Toodegrees Team are not responsible for any decisions made based on the information provided by these charting tools. The user assumes full responsibility and liability for any actions taken and the consequences thereof, including any loss of money or investments that may occur as a result of using these products. Hence, by using these charting tools, the user accepts and acknowledges that Toodegrees and the Toodegrees Team are not liable nor responsible for any unwanted outcome that arises from the development, or the use of these charting tools. Finally, the user indemnifies Toodegrees and the Toodegrees Team from any and all liability.
By continuing to use these charting tools, the user acknowledges and agrees to the Terms and Conditions outlined in this legal disclaimer.
ابحث في النصوص البرمجية عن "信达股份40周年"

Altcoin ManagerThe Altcoin Manager is a comprehensive script for identifying the current altcoin narrative by tracking and analyzing of a wide array of altcoins across various blockchain layers and categories, such as DeFi, GameFi, AI, and Meme coins. Ideal for traders looking to get a broad yet detailed view of the altcoin market, covering various sectors and chains.
The Key Features:
Versatile Asset Tracking:
Tracks 40 different cryptocurrencies (as of publishing) across different categories, allowing for a diversified and detailed analysis of the altcoin market.
Customizable Assets and Category Analysis:
Select 20 of your own coins across 4 different categories such as DeFi, GameFi, AI, and Meme coins as well as specifying their individual chains.
Dynamic Layer and Chain Analysis:
Includes options to plot and analyze specific blockchain layers and chains such as Ethereum Chain, Solana Chain, BNB Smart Chain, Arbitrum Chain, and Polygon Chain. The script associates various assets with specific blockchains, providing a clearer picture of how different segments of the altcoin market are performing.
Cumulative and Per-Candle Change:
Switch between viewing the total cumulative change since a set start date or the per-candle change, offering flexibility in analyzing price movements over different timeframes.
Denomination Adjustment:
Includes a functionality to denominate asset prices in other currencies or crypto such as BTC, allowing for a more tailored financial analysis according to your preference.
Moving Averages for Categories and Chains:
Calculates and plots moving averages for each category and chain, aiding in the identification of trends over the selected moving average length.
How do I use it?
This script is not used with any particular chart. Instead, assign it it's own tab and layout.
For a clearer analysis, use multiple different panels to track Categories and Chains separately, both Cumulative for a longer term analysis and Per-Candle to find ongoing breakouts and changes in trend.
You can either use the pre-selected altcoins to represent the market, or you can select your own.
The Layer 1 and Layer 2 are not customizable but consists of 15 popular Layer 1 incl Bitcoin, Ethereum, Solana etc. Layer 2 consists of 5 popular Layer 2.

Megabar Breakout (Range & Volume & RSI)Hey there,
This strategy is based on the idea that certain events lead to what are called Megabars. Megabars are bars that have a very large range and volume. I wanted to verify whether these bars indicate the start of a trend and whether one should follow the trend.
Summary of the Code:
The code is based on three indicators: the range of the bar, the volume of the bar, and the RSI. When certain values of these indicators are met, a Megabar is identified. The direction of the Megabar indicates the direction in which we should trade.
Why do I combine these indicators?
I want to identify special bars that have the potential to mark the beginning of a breakout. Therefore, a bar needs to exhibit high volume, have a large range (huge price movement), and we also use the Relative Strength Index (RSI) to assess potential momentum. Only if all three criteria are met within one candle, do we use this as an identifier for a megabar.
Explanation of Drawings on the Chart:
As you can see, there is a green background on my chart. The green background symbolizes the time when I'm entering a trade. Only if a Megabar happens during that time, I'm ready to enter a trade. The time is between 6 AM and 4 PM CET. It's just because I prefer that time. Also, the strategy draws an error every time a Megabar happens based on VOL and Range only (not on the RSI). That makes it pretty easy to go through your chart and check the biggest bars manually. You can activate or deactivate these settings via the input data of the strategy.
When Do We Enter a Trade?
We wait for a Megabar to happen during our trading session. If the Megabar is bullish, we open a LONG trade at the opening price of the next candle. If the Megabar is bearish, we open a SHORT trade at the opening price of the next candle.
Where Do We Put Our Take Profit & Stop Loss?
The default setting is TP = 40 Pips and SL = 30 Pips. In that case, we are always trading with a risk-reward ratio of 1.33 by default. You can easily change these settings via the input data of the strategy.
Strategy Results
The criteria for Megabars were chosen by me in a way that makes Megabars something special. They are not intended to occur too frequently, as the fundamental idea of this strategy would otherwise not hold. This results in only 37 closed trades within the last 12 months. If you change the criterias for a megabar to a milder one, you will create more Megabars and therefore more trades. It's up to you. I have adapted this strategy to the 30-minute chart of the EURUSD. In the evaluation, we consider a period of 12 months, which I believe is sufficient.
My default settings for the indicators look like this:
Avg Length Vol 20
Avg Multiplier Vol 3
Avg Length Range 20
Avg Multiplier Range 4
Value SMA RSI for Long Trades 50
Value SMA RSI for Short Trades 70
IMPORTANT: The current performance overview does not display the results of these settings. Please change the settings to my default ones so that you can see how I use this strategy.
I do not recommend trading this strategy without further testing. The script is meant to reflect a basic idea and be used as a tool to identify Megabars. I have made this strategy completely public so that it can be further developed. One can take this framework and test it on different timeframes and different markets.

Stock WatchOverview
Watch list are very common in trading, but most of them simply provide the means of tracking a list of symbols and their current price. Then, you click through the list and perform some additional analysis individually from a chart setup. What this indicator is designed to do is provide a watch list that employs a high/low price range analysis in a table view across multiple time ranges for a much faster analysis of the symbols you are watching.
Discussion
The concept of this Stock Watch indicator is best understood when you think in terms of a 52 Week Range indication on many financial web sites. Taken a given symbol, what is the high and the low over a 52 week range and then determine where current price is within that range from a percentage perspective between 0% and 100%.
With this concept in mind, let's see how this Stock Watch indicator is meant to benefit.
There are four different H/L ranges relative to the chart's setting and a Scope property. Let's use a three month (3M) chart as our example and set the indicator's Scope = 4. A 3M chart provides three months of data in a single candle, now when we set the Scope = 4 we are stating that 1X is going to look over four candles for the high/low range.
The Scope property is used to determine how many candles it is to scan to determine the high/low range for the corresponding 1X, 3X, 5X and 10X periods. This is how different time ranges are put into perspective. Using a 3M chart with Scope = 4 would represent the following time windows:
- 1X = 3M * 4 is a 12 Months or 1 Year High/Low Range
- 3X = 3M * 4 * 3 is a 36 Months or 3 Years High/Low Range
- 5X = 3M * 4 * 5 is a 60 Months or 5 Years High/Low Range
- 10X = 3M * 4 * 10 is a 120 Months or 10 Years High/Low Range.
With these calculations, the indicator then determines where current price is within each of these High/Low ranges from a percentage perspective between 0% and 100%.
Once the 0% to 100% value is calculated, it then will shade the value according to a color gradient from red to green (or any other two colors you set the indictor to). This color shading really helps to interpret current price quickly.
The greater power to this range and color shading comes when you are able to see where price is according to price history across the multiple time windows. In this example, there is quick analysis across 1 Year, 3 Year, 5 Year and 10 Year windows.
Now let's further improve this quick analysis over 15 different stocks for which the indicator allows you to watch up to at any one time.
For value traders this is huge, because we're always looking for the bargains and we wait for price to be in the value range. Using this indicator helps to instantly see if price has entered a value range before we decide to do further analysis with other charting and fundamental tools.
The Code
The heart of all this is really very simple as you can see in the following code snippet. We're simply looking for the highest high and lowest low across the different scopes and calculating the percentage of the range where current price is for each symbol being watched.
scope = baseScope
watch1X = math.round(((watchClose - ta.lowest(watchLow, scope)) / (ta.highest(watchHigh, scope) - ta.lowest(watchLow, scope))) * 100, 0)
table.cell(tblWatch, columnId, 2, str.format("{0, number, #}%", watch1X), text_size = size.small, text_color = colorText, bgcolor = getBackColor(watch1X))
//3X Lookback
scope := baseScope * 3
watch3X = math.round(((watchClose - ta.lowest(watchLow, scope)) / (ta.highest(watchHigh, scope) - ta.lowest(watchLow, scope))) * 100, 0)
table.cell(tblWatch, columnId, 3, str.format("{0, number, #}%", watch3X), text_size = size.small, text_color = colorText, bgcolor = getBackColor(watch3X))
Conclusion
The example I've laid out here are for large time windows, because I'm a long term investor. However, keep in mind that this can work on any chart setting, you just need to remember that your chart's time period and scope work together to determine what 1X, 3X, 5X and 10X represent.
Let me try and give you one last scenario on this. Consider your chart is set for a 60 minute chart, meaning each candle represents 60 minutes of time and you set the Stock Watch indicator to a scope = 4. These settings would now represent the following and you would be watching up to 15 different stocks across these windows at one time.
1X = 60 minutes * 4 is 240 minutes or 4 hours of time.
3X = 60 minutes * 4 * 3 = 720 minutes or 12 hours of time.
5X = 60 minutes * 4 * 5 = 1200 minutes or 20 hours of time.
10X = 60 minutes * 4 * 10 = 2400 minutes or 40 hours of time.
I hope you find value in my contribution to the cause of trading, and if you have any comments or critiques, I would love to here from you in the comments.

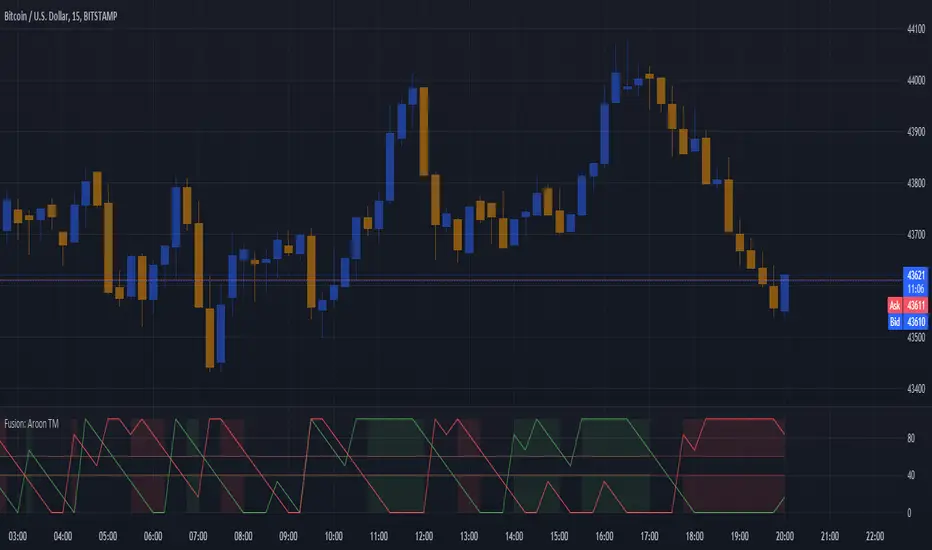
Fusion: Aroon trend matching with dual thresholds 2Same as previous one, just making the code publicly available.
You set an upper and lower threshold and when both are met a direction is determined.
I use this primarily as a confirmation indicator of a trend.
The addition to the normal Aroon is simply the threshold settings and the visuals. There is even an option to see the length you are using which I find useful when the length is long, say 40+ so you don't forget that it's considerably longer than how it's normally used.
Additionally it defaults to the normal colors we are familar with for up and down (long/short) but you can choose Aroon colors if you wish with just a checkbox.
The length is certainly not optimized so set to whatever suits your needs. The Aroon default is 14, I used 6 for one particular case so that's what it ended up being for this indicator.
I default to a dark theme so if you are using a light theme you may need to change some brightness settings.
Finally, if you find value please do make a comment, give a thumbs up etc.
Enjoy and good luck!
SentinelsSentinels is a playful variation on combining different mean averages (MA).
A cross of 2 user-defined MA's (MA 1 & MA 2) initiates the drawing of a sentinel with tentacles, which, on its turn can provide potential support/resistance or entry/stop-loss/take profit zones.
The type of each MA (MA 1, MA 2 and tentacles) can be chosen from following options:
SMA
EMA
SMMA (RMA)
HullMA
WMA
VWMA
DEMA
TEMA
🔹 Examples
Fast & slow MA: HullMA, Tentacles: TEMA
Fast & slow MA: SMA, Tentacles: WMA
Fast & slow MA: WMA, Tentacles: WMA
Fast & slow MA: TEMA, Tentacles: TEMA
🔶 DETAILS
🔹 Head-Body
The head-body is formed by:
the slow MA when there is a crossunder.
the fast MA when there is a crossover.
The color of the head-body is a gradient which can be set. The color of the tentacles (non-gradient) can be set as well.
The head-body of the sentinel will be visible for maximum 60 bars after a cross has occured.
🔹 Tentacles
The length of the 'Tentacles' is calculated by taking the difference between the length of MA 1 and MA 2 , and dividing this by 6 -> diff .
The length of each tentacle is MA 1 + a multiple of diff .
The tentacles will only begin to show from 2 bars after a cross.
Each tentacle will be shown maximum x bars after the cross:
Tentacle 1: 15 bars
Tentacle 2: 20 bars
Tentacle 3: 25 bars
Tentacle 4: 30 bars
Tentacle 5: 35 bars
Tentacle 6: 40 bars
🔹 Switch lengths
By switching lengths the colors get switched too.
Note that the tentacles act differently though.
In that way, this can be an extra option to visualize the tentacles .
🔶 Happy Holidays
Merry Christmas and a Happy New Year!

FlexiMA Variance Tracker - Strategy [presentTrading]█ Introduction and How It Is Different
The FlexiMA Variance Tracker by PresentTrading introduces a novel approach to technical trading strategies. Unlike traditional methods, it calculates deviations between a chosen indicator source (such as price or average) and a moving average with a variable length. This flexibility is achieved through a unique combination of a starting factor and an increment factor, allowing the moving average to adapt dynamically within a specified range. This strategy provides a more responsive and nuanced view of market trends, setting it apart from standard trading methodologies.
BTC 8h L/S
Local
█ Strategy, How It Works: Detailed Explanation
The FlexiMA Variance Tracker, developed by PresentTrading, stands at the forefront of trading strategies, distinguished by its adaptive and multifaceted approach to market analysis. This strategy intricately weaves various technical elements to construct a comprehensive trading logic. Here's an in-depth professional breakdown:
🔶Foundation on Variable-Length Moving Averages:
Central to this strategy is the concept of variable-length Moving Averages (MAs). Unlike traditional MAs with a fixed period, this strategy dynamically adjusts the length of the MA based on a starting factor and an incremental factor. This approach allows the strategy to adapt to market volatility and trend strength more effectively.
Each MA iteration offers a distinct temporal perspective, capturing short-term price movements to long-term trends. This aggregation of various time frames provides a richer and more nuanced market analysis, essential for making informed trading decisions.
🔶Deviation Analysis and Normalization:
The strategy calculates deviations of the price (or the chosen indicator source) from each of these MAs. These deviations are pivotal in identifying the immediate market direction relative to the average trend captured by each MA.
To standardize these deviations for comparability, they undergo a normalization process. The choice of normalization method (Max-Min or Absolute Sum) can significantly influence the interpretation of market conditions, offering distinct insights into price movements and trend strength.
🔹Normalization: Absolute Sum
🔶Composite Oscillator Construction:
A composite oscillator is derived from the median of these normalized deviations. The median serves as a balanced and robust central trend indicator, minimizing the impact of outliers and market noise.
Additionally, the standard deviation of these deviations is computed, providing a measure of market volatility. This volatility indicator is crucial for assessing market risk and can guide traders in setting appropriate stop-loss and take-profit levels.
🔶Integration with SuperTrend Indicator:
The FlexiMA strategy integrates the SuperTrend indicator, renowned for its effectiveness in identifying trend direction and reversals. The SuperTrend's incorporation enhances the strategy's ability to filter out false signals and confirm genuine market trends.
* The SuperTrend Toolkit is made by @QuantiLuxe
This combination of the variable-length MA oscillator with the SuperTrend indicator forms a potent duo, offering traders a dual-confirmation mechanism for trade signals.
🔹Supertrend's incorporation
🔶Strategic Trade Signal Generation:
Trade signals are generated when there is a confluence between the composite oscillator and the SuperTrend indicator. For example, a long position signal might be considered when the oscillator suggests an uptrend, and the SuperTrend flips to bullish.
The strategy's parameters are fully customizable, enabling traders to tailor the signal generation process to their specific trading style, risk tolerance, and market conditions.
█ Usage
To effectively employ the FlexiMA Variance Tracker strategy:
Traders should set their desired trade direction and fine-tune the starting and increment factors according to their market analysis and risk tolerance.
Indicator Length: 5
Indicator Length: 40
The strategy is suitable for a wide range of markets and can be adapted to different time frames, making it a versatile tool for various trading scenarios.
█ Default Settings Impact on Performance: FlexiMA Variance Tracker
1. Trade Direction (Configurable: Long, Short, Both): Determines trade types. 'Long' for buying, 'Short' for selling, 'Both' adapts to market trends.
2. Indicator Source: HLC3: Balances market sentiment by considering high, low, and close, providing comprehensive period analysis.
4. Indicator Length (Default: 10): Baseline for moving averages. Shorter lengths increase responsiveness but add noise, while longer lengths favor trends.
5. Starting and Increment Factor (Default: 1.0): Adjusts MA lengths range. Higher values capture broad market dynamics, lower values focus analysis.
6. Normalization Method (Options: None, Max-Min, Absolute Sum): Standardizes deviations. 'None' for raw deviations, 'Max-Min' for relative scaling, 'Absolute Sum' emphasizes relative strength.
7. SuperTrend Settings (ATR Length: 10, Multiplier: 15.0): Influences indicator sensitivity. Short ATR or high multiplier for short-term, long ATR or low multiplier for long-term trends.
8. Additional Settings (Mesh Style, Color Customization): Enhances visual clarity. Mesh style for detailed deviation view, colors for quick market condition identification.

FlexiMA Variance Tracker [presentTrading]🔶 Introduction and How it is Different
The FlexiMA Variance Tracker (FlexiMA-VT) represents a novel approach in technical analysis, distinctively standing out in the realm of financial market indicators. It leverages the concept of a variable Length Moving Average (MA) to create a versatile and dynamic oscillator. Unlike traditional oscillators that rely on a fixed-length MA, the FlexiMA-VT adapts to market conditions by varying the length of the MA, offering a more responsive and nuanced view of market trends. (*The achieved method took reference from SuperTrend Polyfactor Oscillator)
This innovative design allows the FlexiMA-VT to capture a broader spectrum of market movements, making it highly effective in diverse trading environments. Whether in stable or volatile markets, its adaptability ensures consistent relevance, providing traders with deeper insights into potential market swings.
The proposed oscillator accentuates several key aspects through a distinctive mesh of bars, which are derived from the differences between the price and a set of 20 Moving Averages, each altered by varying factors. The intensity of the mesh's colors serves as an indicator, with brighter hues signifying a greater convergence of Moving Average signals.
Starting Length = 5
Starting Length = 40
🔶 Strategy, How it Works: Detailed Explanation
1. Core Concept:
The FlexiMA-VT operates by comparing the price or an average value (indicator source) against a set of moving averages with varying lengths.
These lengths are dynamically adjusted through a starting factor and multiple increment factors, ensuring a comprehensive analysis over different time scales.
2. Normalization and Standard Deviation Calculation:
Once deviations are calculated, they undergo a normalization process, which can be set to 'None', 'Max-Min', or 'Absolute Sum'.
This step is crucial as it standardizes the deviations, allowing for a consistent scale of comparison.
The standard deviation of these normalized deviations is then calculated, offering insights into the market’s volatility and potential trend strength.
🔹Normalization
3. Median Value and Oscillator Creation:
The median of the normalized deviations forms the core of the FlexiMA-VT oscillator.
This median value provides a balanced central point, reflecting the consensus of various MA lengths.
The standard deviation bands plotted around the median enhance the interpretative power of the oscillator, indicating potential overbought or oversold conditions.
4. Multi-Factor Analysis:
The FlexiMA-VT uses multiple increment factors to generate a range of MAs, each factor representing a different scale of trend analysis.
By averaging the results from these different scales, the FlexiMA-VT forms a more comprehensive and reliable oscillator.
🔹Consensus
5. Practical Application:
Traders can use the FlexiMA-VT for various purposes, including identifying trend reversals, gauging market momentum, and determining overbought or oversold conditions.
Its dynamic nature makes it adaptable to different trading strategies, from short-term scalping to long-term position trading.
🔶 Settings
1. Indicator Source (indicatorSource): Determines the base data for calculations, typically a price average (HLC3).
2. Indicator Length (indicatorLength): Sets the base length for Moving Averages, influencing initial calculations.
3. Starting Factor (startingFactor): Initial multiplier for MA length, impacting the starting point of analysis.
4. Increment Factors (incrementFactor_1, incrementFactor_2, incrementFactor_3): Modulate the rate of change in MA lengths, adding variability.
5. Normalization Method (normalizeMethod): Standardizes deviations, with methods like 'Max-Min' and 'Absolute Sum' for comparability.

41-80 F&O MA ScreenerThis Pine Script is a TradingView indicator named "41-80-F&O EMA Screener." It calculates and displays four moving averages (MA1, MA2, MA3, and MA4) and the Relative Strength Index (RSI) on a chart. The script generates buy and short signals based on certain conditions involving the moving averages and RSI. Additionally, it includes a screener section that displays a table of symbols with buy and short signals.
Here's a breakdown of the key components:
Moving Averages (MAs):
MA1: Simple Moving Average with length len1 (green line).
MA2: Simple Moving Average with length len2 (red line).
MA3: Simple Moving Average with length len3 (orange line).
MA4: Simple Moving Average with length len4 (black line).
Relative Strength Index (RSI):
The RSI is calculated with a length of rsiLengthInput and a source specified by rsiSourceInput.
Conditions for Buy and Short Signals:
Buy Signal: When MA1 is above MA2 and MA3, and RSI is above 50.
Short Signal: When MA1 is below MA2 and MA3, and RSI is below 50.
Signal Plots:
Buy signals are plotted as "B" below the corresponding bars.
Short signals are plotted as "S" above the corresponding bars.
Background Coloring:
Bars are colored based on their opening and closing prices.
Screener Section:
The script defines a watchlist (gticker) with 40 predefined symbols.
It then calls the getSignal function for each symbol to identify buy and short signals.
The results are displayed in a table with long signals in green and short signals in red.
Table Theming:
The script allows customization of the table's background, frame, and text colors, as well as the text size.
The table's location on the chart can also be customized.
Please note that the script uses the Mozilla Public License 2.0. Make sure to review and comply with the terms of this license if you plan to use or modify the script.
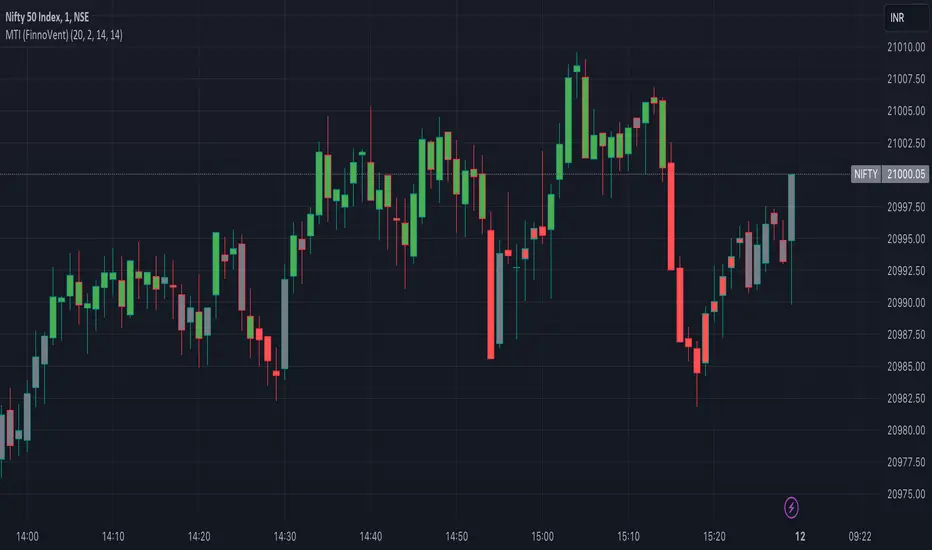
Market Trend Indicator (FinnoVent)The Market Trend Indicator (FinnoVent) is a comprehensive trading tool designed to provide clear visual cues for market trends on TradingView charts. This indicator combines the principles of Exponential Moving Averages (EMAs), Bollinger Bands, the Average Directional Index (ADX), and the Relative Strength Index (RSI) to offer a nuanced view of market movements.
How It Works:
Trend Identification with EMAs: The indicator uses two EMAs (3-period and 30-period) to identify the primary trend. An upward trend is signaled when the 3-period EMA crosses above the 30-period EMA, while a downward trend is indicated when the 3-period EMA crosses below the 30-period EMA.
Sideways Market Detection: To identify sideways trends, the indicator employs Bollinger Bands, ADX, and RSI. A sideways (or consolidating) market condition is identified when:
The price is between the middle 60% of the Bollinger Bands (avoiding the top and bottom 20%).
The ADX is below 30, indicating a lack of a strong trend.
The RSI is between 40 and 60, suggesting a neutral market momentum.
Visual Representation:
Bar Colors: The indicator colors the price bars on the chart based on the identified trend:
Green Bars: Indicate an upward trend.
Red Bars: Indicate a downward trend.
Grey Bars: Indicate a sideways or consolidating market.
How to Use:
Trend Following: Use the colored bars as a guide for trend following. Green bars suggest a potential entry for a long position, while red bars may indicate opportunities for short positions.
Sideways Market Caution: Grey bars signal a sideways market. In such conditions, traders might exercise caution and avoid trend-following strategies, as the market lacks a clear direction.
Complementary Analysis: While the Market Trend Indicator (FinnoVent) provides valuable insights, it's recommended to use it in conjunction with other forms of analysis (like fundamental analysis, other technical indicators, or price action) for comprehensive decision-making.
Suitable for: This indicator is versatile and can be applied to various timeframes and trading instruments, including stocks, forex, commodities, and indices.
Important Notes:
The indicator is designed to minimize repainting but always consider the latest data for the most accurate analysis.
Like all indicators, it is not foolproof. It works best when combined with a solid trading plan and risk management strategies.
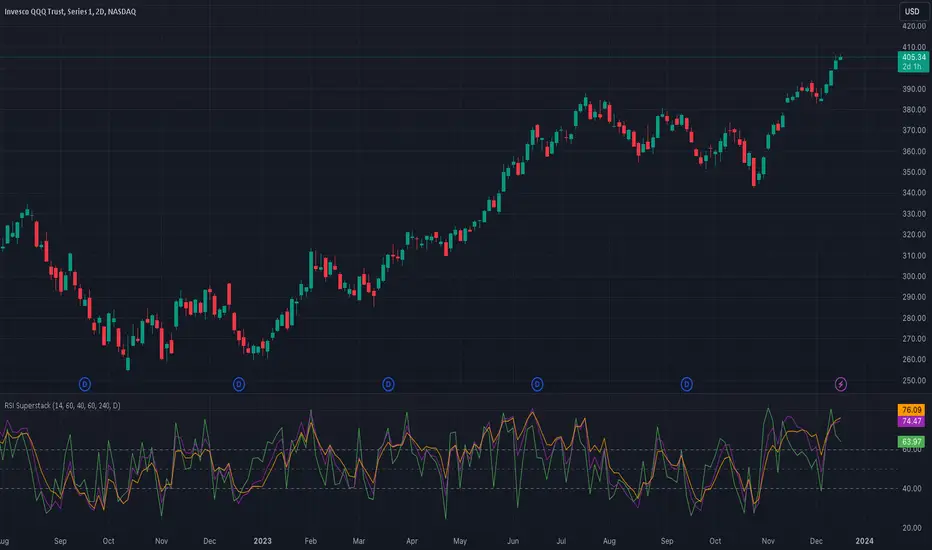
RSI SuperstackThis script integrates three Relative Strength Index (RSI) indicators across multiple time frames, providing a comprehensive overview of oversold and overbought conditions. This holistic approach enhances the precision of entry and exit points on shorter time frames.
As a momentum indicator, the Relative Strength Index assesses a security's strength during upward and downward price movements within the specified time period.
In a broader context, an upward slope in all indicators (green, purple, and orange) signifies an increasing market momentum, suggesting a potential continuation of the upward trend.
More specifically, a collective upward slope reaching or surpassing the 40 level in all indicators serves as a buy signal. Conversely, a uniform downward slope descending to or below the 60 level in all indicators constitutes a sell signal.
The default time frames for analysis include:
- 1 Hour (1H)
- 4 Hours (4H)
- Daily (D)
It is imperative to note that this indicator should not serve as the sole determinant for initiating long or short positions. Instead, it is recommended to consider it as part of a broader analysis, incorporating factors such as trend analysis and significant support levels.
Disclaimer: The utilization of this indicator should complement a comprehensive analysis and not be solely relied upon for decision-making regarding long or short positions.
savitzkyGolay, KAMA, HPOverview
This trading indicator integrates three distinct analytical tools: the Savitzky-Golay Filter, Kaufman Adaptive Moving Average (KAMA), and Hodrick-Prescott (HP) Filter. It is designed to provide a comprehensive analysis of market trends and potential trading signals.
Components
Hodrick-Prescott (HP) Filter
Purpose: Smooths out the price data to identify the underlying trend.
Parameters: Lambda: Controls the smoothness. Range: 50 to 1600.
Impact of Parameters:
Increasing Lambda: This makes the trend line more responsive to short-term market fluctuations, suitable for short-term analysis. A higher Lambda value decreases the degree of smoothing, making the trend line follow recent market movements more closely.
Decreasing Lambda: A lower Lambda value makes the trend line smoother and less responsive to short-term market fluctuations, ideal for longer-term trend analysis. Decreasing Lambda increases the degree of smoothing, thereby filtering out minor market movements and focusing more on the long-term trend.
Kaufman Adaptive Moving Average (KAMA):
Purpose: An adaptive moving average that adjusts to price volatility.
Parameters: Length, Fast Length, Slow Length: Define the sensitivity and adaptiveness of KAMA.
Impact of Parameters:
Adjusting Length affects the base period for efficiency ratio, altering the overall sensitivity.
Fast Length and Slow Length control the speed of KAMA’s adaptation. A smaller Fast Length makes KAMA more sensitive to price changes, while a larger Slow Length makes it less sensitive.
Savitzky-Golay Filter:
Purpose: Smooths the price data using polynomial regression.
Parameters: Window Size: Determines the size of the moving window (7, 9, 11, 15, 21).
Impact of Parameters:
A larger Window Size results in a smoother curve, which is more effective for identifying long-term trends but can delay reaction to recent market changes.
A smaller Window Size makes the curve more responsive to short-term price movements, suitable for short-term trading strategies.
General Impact of Parameters
Adjusting these parameters can significantly alter the signals generated by the indicator. Users should fine-tune these settings based on their trading style, the characteristics of the traded asset, and market conditions to optimize the indicator's performance.
Signal Logic
Buy Signal: The trend from the HP filter is below both the KAMA and the Savitzky-Golay SMA, and none of these indicators are flat.
Sell Signal: The trend from the HP filter is above both the KAMA and the Savitzky-Golay SMA, and none of these indicators are flat.
Usage
Due to the combination of smoothing algorithms and adaptability, this indicator is highly effective at identifying emerging trends for both initiating long and short positions.
IMPORTANT : Although the code and user settings incorporate measures to limit false signals due to lateral (sideways) movement, they do not completely eliminate such occurrences. Users are strongly advised to avoid signals that emerge during simultaneous lateral movements of all three indicators.
Despite the indicator's success in historical data analysis using its signals alone, it is highly recommended to use this code in combination with other indicators, patterns, and zones. This is particularly important for determining exit points from positions, which can significantly enhance trading results.
Limitations and Recommendations
The indicator has shown excellent performance on the weekly time frame (TF) with the following settings:
Savitzky-Golay (SG): 11
Hodrick-Prescott (HP): 100
Kaufman Adaptive Moving Average (KAMA): 20, 2, 30
For the monthly TF, the recommended settings are:
SG: 15
HP: 100
KAMA: 30, 2, 35
Note: The monthly TF is quite variable. With these settings, there may be fewer signals, but they tend to be more relevant for long-term investors. Based on a sample of 40 different stocks from various countries and sectors, most exhibited an average trade return in the thousands of percent.
It's important to note that while these settings have been successful in past performance, market conditions vary and past performance is not indicative of future results. Users are encouraged to experiment with these settings and adjust them according to their individual needs and market analysis.
As this is my first developed trading indicator, I am very open to and appreciative of any suggestions or comments. Your feedback is invaluable in helping me refine and improve this tool. Please feel free to share your experiences, insights, or any recommendations you may have.

TASC 2023.12 Growth and Value Switching System█ OVERVIEW
This script implements a rotation system for trading value and growth ETFs, as developed by Markos Katsanos and detailed in the article titled 'Growth Or Value?' in TASC's December 2023 edition of Traders' Tips . The purpose of this script is to demonstrate how short-term momentum can be employed to track market trends and provide clarity on when to switch between value and growth.
█ CONCEPTS
The central concept of the presented rotation strategy is based on the observation that the stock market undergoes cycles favoring either growth or value stocks. Consequently, the script introduces a momentum trading system that is designed to switch between value and growth equities based on prevailing market conditions. Specifically tailored for long-term index investors, the system focuses on trading Vanguard's value and growth ETFs ( VTV and VUG ) on a weekly timeframe.
To identify the ETF likely to outperform, the script uses a custom relative strength indicator applied to both VTV and VUG in comparison with an index ( SPY ). To minimize risk and drawdowns during bear markets, when both value and growth experience downtrends, the script employs the author's custom volume flow indicator (VFI) and blocks trades when its reading indicates money outflow . Positions are closed if the relative strength of the current open trade ETF falls below that of the other ETF for two consecutive weeks and is also below its moving average. Additionally, the script implements a stop-loss when the ETF is trading below its 40-week moving average, but only during bear markets.
The script plots the relative strengths of the value and growth equities along with the signals triggered by the aforementioned rules. Information about the current readings of the relative strength and volume flow indicators, along with the current open position, is displayed in a table.
█ CALCULATIONS
The script uses the request.security() function to gather price data for both equities and the reference index. Custom relative strength and volume flow indicators are calculated based on the formulas presented in the original article. By default, the script employs the same parameters for these indicators as proposed in the original article for VTV and VUG on a weekly timeframe.

Rate of Change StrategyRate of Change Strategy :
INTRODUCTION :
This strategy is based on the Rate of Change indicator. It compares the current price with that of a user-defined period of time ago. This makes it easy to spot trends and even speculative bubbles. The strategy is long term and very risky, which is why we've added a Stop Loss. There's also a money management method that allows you to reinvest part of your profits or reduce the size of your orders in the event of substantial losses.
RATE OF CHANGE (ROC) :
As explained above, the ROC is used to situate the current price compared to that of a certain period of time ago. The formula for calculating ROC in relation to the previous year is as follows :
ROC (365) = (close/close (365) - 1) * 100
With this formula we can find out how many percent the change in the current price is compared with 365 days ago, and thus assess the trend.
PARAMETERS :
ROC Length : Length of the ROC to be calculated. The current price is compared with that of the selected length ago.
ROC Bubble Signal : ROC value indicating that we are in a bubble. This value varies enormously depending on the financial product. For example, in the equity market, a bubble exists when ROC = 40, whereas in cryptocurrencies, a bubble exists when ROC = 150.
Stop Loss (in %) : Stop Loss value in percentage. This is the maximum trade value percentage that can be lost in a single trade.
Fixed Ratio : This is the amount of gain or loss at which the order quantity is changed. The default is 400, which means that for each $400 gain or loss, the order size is increased or decreased by an amount chosen by the user.
Increasing Order Amount : This is the amount to be added to or subtracted from orders when the fixed ratio is reached. The default is $200, which means that for every $400 gain, $200 is reinvested in the strategy. On the other hand, for every $400 loss, the order size is reduced by $200.
Initial capital : $1000
Fees : Interactive Broker fees apply to this strategy. They are set at 0.18% of the trade value.
Slippage : 3 ticks or $0.03 per trade. Corresponds to the latency time between the moment the signal is received and the moment the order is executed by the broker.
Important : A bot has been used to test the different parameters and determine which ones maximize return while limiting drawdown. This strategy is the most optimal on BITSTAMP:BTCUSD in 1D timeframe with the following parameters :
ROC Length = 365
ROC Bubble Signal = 180
Stop Loss (in %) = 6
LONG CONDITION :
We are in a LONG position if ROC (365) > 0 for at least two days. This allows us to limit noise and irrelevant signals to ensure that the ROC remains positive.
SHORT CONDITION :
We are in a SHORT position if ROC (365) < 0 for at least two days. We also open a SHORT position when the speculative bubble is about to burst. If ROC (365) > 180, we're in a bubble. If the bubble has been in existence for at least a week and the ROC falls back below this threshold, we can expect the asset to return to reasonable prices, and thus a downward trend. So we're opening a SHORT position to take advantage of this upcoming decline.
EXIT RULES FOR WINNING TRADE :
The strategy is self-regulating. We don't exit a LONG trade until a SHORT signal has arrived, and vice versa. So, to exit a winning position, you have to wait for the entry signal of the opposite position.
RISK MANAGEMENT :
This strategy is very risky, and we can easily end up on the wrong side of the trade. That's why we're going to manage our risk with a Stop Loss, limiting our losses as a percentage of the trade's value. By default, this percentage is set at 6%. Each trade will therefore take a maximum loss of 6%.
If the SL has been triggered, it probably means we were on the wrong side. This is why we change the direction of the trade when a SL is triggered. For example, if we were SHORT and lost 6% of the trade value, the strategy will close this losing trade and open a long position without taking into account the ROC value. This allows us to be in position all the time and not miss the best opportunities.
MONEY MANAGEMENT :
The fixed ratio method was used to manage our gains and losses. For each gain of an amount equal to the value of the fixed ratio, we increase the order size by a value defined by the user in the "Increasing order amount" parameter. Similarly, each time we lose an amount equal to the value of the fixed ratio, we decrease the order size by the same user-defined value. This strategy increases both performance and drawdown.
NOTE :
Please note that the strategy is backtested from 2017-01-01. As the timeframe is 1D, this strategy is a medium/long-term strategy. That's why only 34 trades were closed. Be careful, as the test sample is small and performance may not necessarily reflect what may happen in the future.
Enjoy the strategy and don't forget to take the trade :)

ICT Silver Bullet with signals
The "ICT Silver Bullet with signals" indicator (inspired from the lectures of "The Inner Circle Trader" (ICT)),
goes a step further than the ICT Silver Bullet publication, which I made for LuxAlgo :
• uses HTF candles
• instant drawing of Support & Resistance (S/R) lines when price retraces into FVG
• NWOG - NDOG S/R lines
• signals
The Silver Bullet (SB) window which is a specific 1-hour interval where a Fair Value Gap (FVG) pattern can be formed.
When price goes back to the FVG, without breaking it, Support & Resistance lines will be drawn immediately.
There are 3 different Silver Bullet windows (New York local time):
The London Open Silver Bullet (03 AM — 04 AM ~ 03:00 — 04:00)
The AM Session Silver Bullet (10 AM — 11 AM ~ 10:00 — 11:00)
The PM Session Silver Bullet (02 PM — 03 PM ~ 14:00 — 15:00)
🔶 USAGE
This technique can visualise potential support/resistance lines, which can be used as targets.
The script contains 2 main components:
• forming of a Fair Value Gap (FVG)
• drawing support/resistance (S/R) lines
🔹 Forming of FVG
When HTF candles forms an FVG, the FVG will be drawn at the end (close) of the last HTF candle.
To make it easier to visualise the 2 HTF candles that form the FVG, you can enable
• SHOW -> HTF candles
During the SB session, when a FVG is broken, the FVG will be removed, together with its S/R lines.
The same goes if price did not retrace into FVG at the last bar of the SB session
Only exception is when "Remove broken FVG's" is disabled.
In this case a FVG can be broken, as long as price bounces back before the end of the SB session, it will remain to be visible:
🔹 Drawing support/resistance lines
S/R target lines are drawn immediately when price retraces into the FVG.
They will remain updated until they are broken (target hit)
Potential S/R lines are formed by:
• previous swings (swing settings (left-right)
• New Week Opening Gap (NWOG): close on Friday - weekly open
• New Day Opening Gap (NWOG): close previous day - current daily open
Only non-broken lines are included.
Broken =
• minimum of open and close below potential S/R line
• maximum of open and close above potential S/R line
NDOG lines are coloured fuchsia (as in the ICT lectures), NWOG are coloured white (darkmode) or black (lightmode ~ ICT lectures)
Swing line colour can be set as desired.
Here S/R includes NDOG lines:
The same situation, with "Extend Target-lines to their source" enabled:
Here with NWOG lines:
This publication contains a "Minimum Trade Framework (mTFW)", which represents the best-case expected price delivery, this is not your actual trade entry - exit range.
• 40 ticks for index futures or indices
• 15 pips for Forex pairs
The minimum distance (if applicable) can be shown by enabling "Show" - "Minimum Trade Framework" -> blue arrow from close to mTFW
Potential S/R lines needs to be higher (bullish) or lower (bearish) than mTFW.
🔶 SETTINGS
(check USAGE for deeper insights and explanation)
🔹 Only last x bars: when enabled, the script will do most of the calculations at these last x candles, potentially this can speeds calculations.
🔹 Swing settings (left-right): Sets the length, which will set the lookback period/sensitivity of the ZigZag patterns (which directs the trend and points for S/R lines)
🔹 FVG
HTF (minutes): 1-15 minutes.
• When the chart TF is equal of higher, calculations are based on current TF.
• Chart TF > 15 minutes will give the warning: "Please use a timeframe <= 15 minutes".
Remove broken FVG's: when enabled the script will remove FVG (+ associated S/R lines) immediately when FVG is broken at opposite direction.
FVG's still will be automatically removed at the end of the SB session, when there is no retrace, together with associated S/R lines,...
~ trend: Only include FVG in the same direction as the current trend
Note -> when set 'right' (swing setting) rather high ( > 3), he trend change will be delayed as well (default 'right' max 5)
Extend: extend FVG to max right side of SB session
🔹 Targets – support/resistance
Extend Target-lines to their source: extend lines to their origin
Colours (Swing S/R lines)
🔹 Show
SB session: show lines and labels of SB session (+ colour)
• Labels can be disabled separately in the 'Style' section, colour is set at the 'Inputs' section
Trend : Show trend (ZigZag, coloured ~ trend)
HTF candles: Show the 2 HTF candles that form the FVG
Minimum Trade Framework: blue arrow (if applicable)
🔶 ALERTS
There are 4 signals provided (bullish/bearish):
FVG Formed
FVG Retrace
Target reached
FVG cancelled
You can choose between dynamic alerts - only 1 alert needs to be set for all signals, or you can set specific alerts as desired.
💜 PURPLE BARS 😈
• Since TradingView has chosen to give away our precious Purple coloured Wizard Badge, bars are coloured purple 😊😉

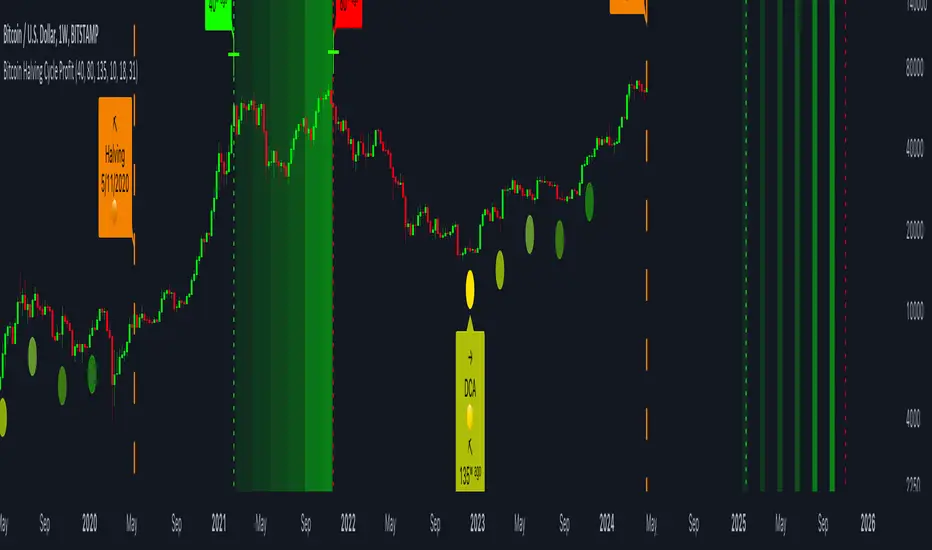
Bitcoin Halving Cycle ProfitThe Bitcoin Halving Cycle Profit indicator, developed by Kevin Svenson , unveils a consistent and predetermined profit-taking cycle triggered by each Bitcoin halving event. This indicator streamlines the analysis of halving occurrences, providing explicit signals for both profit-taking and Dollar-Cost Averaging strategies.
Following each Bitcoin halving event, a fixed number of weeks consistently mark the period of maximum profitability for profit-taking:
🔄 Halving Cycle Profit Timeline Explained:
• 40 Weeks (Post-Halving) = Start of the optimal profit-taking zone.
• 80 Weeks (Post-Halving) = "Last Call" for profit-taking before the onset of a bear market.
• 125 Weeks (Post-Halving) = The optimal timeframe to begin Dollar-Cost Averaging.
(Bitcoin Weekly Chart using Halving Cycle Profit)
One standout feature of this indicator is its inherent clarity and comprehensive labeling. This quality makes it exceptionally easy to discern the locations of key factors and turning points, enhancing your understanding of the market dynamics it highlights.
(Bitcoin Daily Chart using Halving Cycle Profit)
🚀 This indicator doesn't limit its effectiveness to just Bitcoin; it seamlessly integrates with top blue-chip altcoins like Ethereum and most household names in the crypto industry.
( Ethereum Weekly Chart using Halving Cycle Profit)
🛠️ Customizable display options are availible. Users have the flexibility to toggle/adjust labels, lines, and color fills according to their preferences.
📑 In summary, the Bitcoin Halving Cycle Profit indicator is a versatile and user-friendly tool, offering clarity and customization for traders navigating both Bitcoin and top altcoins.
⚠️ It's important to note that while the Bitcoin Halving Cycle Profit indicator provides historical insights, past performance does not guarantee future results. Timing profitability in the cryptocurrency market involves inherent risks, and this indicator should not be construed as financial advice. Users are encouraged to exercise caution, conduct thorough research, and make informed decisions based on their individual risk tolerance and financial goals.
Watchlist Heatmap PlusIntroducing 'Watchlist Heatmap Plus,' an advanced indicator designed to supercharge your trading experience. With this tool, you can easily track up to 40 symbols in your watchlist and gain valuable insights into their performance. Here's what it does:
1. Data Visualization: Watchlist Heatmap Plus displays essential data for each symbol, including open, high, low, close, close percent, volume, and volume percent.
2. Dynamic Color Coding: The indicator leverages a dynamic color-coding system to make data interpretation a breeze. By default, red indicates a decrease or a lower value compared to the immediate previous candle, while green represents an increase or a higher value. This color scheme is consistently applied to open, high, low, close, and volume data, making it easy to spot trends at a glance. Close percent and volume percent are color-coded according to their actual values.
3. Customization Options: Users have the power to customize the displayed data to align with their trading strategy. They can choose from several data display options:
- Regular: Display the original data as is.
- Change: Show the difference between the current value and the previous candle.
- Change Percent: Display the percentage change between the current and previous values.
- Equal To, Less Than, Less Than or Equal To, Greater Than, Greater Than or Equal To: Perform comparison operations between the current and previous value, producing a boolean output.
4. Consistent Color Coding: Regardless of the data display option chosen, the color-coding functionality remains the same, based on the percentage change, allowing traders to quickly assess the health of each symbol.
Performance Considerations:
Please be aware that due to the complexity of this indicator and the substantial volume of data requests it handles, users may experience occasional data lag and performance slowdown, particularly when applied to certain timeframes. In some cases, there may be a risk of memory exhaustion, especially on smaller timeframes.
To optimize your experience and ensure smooth functionality, I recommend using this indicator on higher timeframes where data processing is less resource-intensive. Additionally, when using the indicator with the chart's replay feature, be cautious as it may encounter memory limits, affecting its performance.
Machine Learning: Optimal RSI [YinYangAlgorithms]This Indicator, will rate multiple different lengths of RSIs to determine which RSI to RSI MA cross produced the highest profit within the lookback span. This ‘Optimal RSI’ is then passed back, and if toggled will then be thrown into a Machine Learning calculation. You have the option to Filter RSI and RSI MA’s within the Machine Learning calculation. What this does is, only other Optimal RSI’s which are in the same bullish or bearish direction (is the RSI above or below the RSI MA) will be added to the calculation.
You can either (by default) use a Simple Average; which is essentially just a Mean of all the Optimal RSI’s with a length of Machine Learning. Or, you can opt to use a k-Nearest Neighbour (KNN) calculation which takes a Fast and Slow Speed. We essentially turn the Optimal RSI into a MA with different lengths and then compare the distance between the two within our KNN Function.
RSI may very well be one of the most used Indicators for identifying crucial Overbought and Oversold locations. Not only that but when it crosses its Moving Average (MA) line it may also indicate good locations to Buy and Sell. Many traders simply use the RSI with the standard length (14), however, does that mean this is the best length?
By using the length of the top performing RSI and then applying some Machine Learning logic to it, we hope to create what may be a more accurate, smooth, optimal, RSI.
Tutorial:
This is a pretty zoomed out Perspective of what the Indicator looks like with its default settings (except with Bollinger Bands and Signals disabled). If you look at the Tables above, you’ll notice, currently the Top Performing RSI Length is 13 with an Optimal Profit % of: 1.00054973. On its default settings, what it does is Scan X amount of RSI Lengths and checks for when the RSI and RSI MA cross each other. It then records the profitability of each cross to identify which length produced the overall highest crossing profitability. Whichever length produces the highest profit is then the RSI length that is used in the plots, until another length takes its place. This may result in what we deem to be the ‘Optimal RSI’ as it is an adaptive RSI which changes based on performance.
In our next example, we changed the ‘Optimal RSI Type’ from ‘All Crossings’ to ‘Extremity Crossings’. If you compare the last two examples to each other, you’ll notice some similarities, but overall they’re quite different. The reason why is, the Optimal RSI is calculated differently. When using ‘All Crossings’ everytime the RSI and RSI MA cross, we evaluate it for profit (short and long). However, with ‘Extremity Crossings’, we only evaluate it when the RSI crosses over the RSI MA and RSI <= 40 or RSI crosses under the RSI MA and RSI >= 60. We conclude the crossing when it crosses back on its opposite of the extremity, and that is how it finds its Optimal RSI.
The way we determine the Optimal RSI is crucial to calculating which length is currently optimal.
In this next example we have zoomed in a bit, and have the full default settings on. Now we have signals (which you can set alerts for), for when the RSI and RSI MA cross (green is bullish and red is bearish). We also have our Optimal RSI Bollinger Bands enabled here too. These bands allow you to see where there may be Support and Resistance within the RSI at levels that aren’t static; such as 30 and 70. The length the RSI Bollinger Bands use is the Optimal RSI Length, allowing it to likewise change in correlation to the Optimal RSI.
In the example above, we’ve zoomed out as far as the Optimal RSI Bollinger Bands go. You’ll notice, the Bollinger Bands may act as Support and Resistance locations within and outside of the RSI Mid zone (30-70). In the next example we will highlight these areas so they may be easier to see.
Circled above, you may see how many times the Optimal RSI faced Support and Resistance locations on the Bollinger Bands. These Bollinger Bands may give a second location for Support and Resistance. The key Support and Resistance may still be the 30/50/70, however the Bollinger Bands allows us to have a more adaptive, moving form of Support and Resistance. This helps to show where it may ‘bounce’ if it surpasses any of the static levels (30/50/70).
Due to the fact that this Indicator may take a long time to execute and it can throw errors for such, we have added a Setting called: Adjust Optimal RSI Lookback and RSI Count. This settings will automatically modify the Optimal RSI Lookback Length and the RSI Count based on the Time Frame you are on and the Bar Indexes that are within. For instance, if we switch to the 1 Hour Time Frame, it will adjust the length from 200->90 and RSI Count from 30->20. If this wasn’t adjusted, the Indicator would Timeout.
You may however, change the Setting ‘Adjust Optimal RSI Lookback and RSI Count’ to ‘Manual’ from ‘Auto’. This will give you control over the ‘Optimal RSI Lookback Length’ and ‘RSI Count’ within the Settings. Please note, it will likely take some “fine tuning” to find working settings without the Indicator timing out, but there are definitely times you can find better settings than our ‘Auto’ will create; especially on higher Time Frames. The Minimum our ‘Auto’ will create is:
Optimal RSI Lookback Length: 90
RSI Count: 20
The Maximum it will create is:
Optimal RSI Lookback Length: 200
RSI Count: 30
If there isn’t much bar index history, for instance, if you’re on the 1 Day and the pair is BTC/USDT you’ll get < 4000 Bar Indexes worth of data. For this reason it is possible to manually increase the settings to say:
Optimal RSI Lookback Length: 500
RSI Count: 50
But, please note, if you make it too high, it may also lead to inaccuracies.
We will conclude our Tutorial here, hopefully this has given you some insight as to how calculating our Optimal RSI and then using it within Machine Learning may create a more adaptive RSI.
Settings:
Optimal RSI:
Show Crossing Signals: Display signals where the RSI and RSI Cross.
Show Tables: Display Information Tables to show information like, Optimal RSI Length, Best Profit, New Optimal RSI Lookback Length and New RSI Count.
Show Bollinger Bands: Show RSI Bollinger Bands. These bands work like the TDI Indicator, except its length changes as it uses the current RSI Optimal Length.
Optimal RSI Type: This is how we calculate our Optimal RSI. Do we use all RSI and RSI MA Crossings or just when it crosses within the Extremities.
Adjust Optimal RSI Lookback and RSI Count: Auto means the script will automatically adjust the Optimal RSI Lookback Length and RSI Count based on the current Time Frame and Bar Index's on chart. This will attempt to stop the script from 'Taking too long to Execute'. Manual means you have full control of the Optimal RSI Lookback Length and RSI Count.
Optimal RSI Lookback Length: How far back are we looking to see which RSI length is optimal? Please note the more bars the lower this needs to be. For instance with BTC/USDT you can use 500 here on 1D but only 200 for 15 Minutes; otherwise it will timeout.
RSI Count: How many lengths are we checking? For instance, if our 'RSI Minimum Length' is 4 and this is 30, the valid RSI lengths we check is 4-34.
RSI Minimum Length: What is the RSI length we start our scans at? We are capped with RSI Count otherwise it will cause the Indicator to timeout, so we don't want to waste any processing power on irrelevant lengths.
RSI MA Length: What length are we using to calculate the optimal RSI cross' and likewise plot our RSI MA with?
Extremity Crossings RSI Backup Length: When there is no Optimal RSI (if using Extremity Crossings), which RSI should we use instead?
Machine Learning:
Use Rational Quadratics: Rationalizing our Close may be beneficial for usage within ML calculations.
Filter RSI and RSI MA: Should we filter the RSI's before usage in ML calculations? Essentially should we only use RSI data that are of the same type as our Optimal RSI? For instance if our Optimal RSI is Bullish (RSI > RSI MA), should we only use ML RSI's that are likewise bullish?
Machine Learning Type: Are we using a Simple ML Average, KNN Mean Average, KNN Exponential Average or None?
KNN Distance Type: We need to check if distance is within the KNN Min/Max distance, which distance checks are we using.
Machine Learning Length: How far back is our Machine Learning going to keep data for.
k-Nearest Neighbour (KNN) Length: How many k-Nearest Neighbours will we account for?
Fast ML Data Length: What is our Fast ML Length? This is used with our Slow Length to create our KNN Distance.
Slow ML Data Length: What is our Slow ML Length? This is used with our Fast Length to create our KNN Distance.
If you have any questions, comments, ideas or concerns please don't hesitate to contact us.
HAPPY TRADING!

Scoopy StacksWaffle Around Multiple
(Open, High, Low, Close) Stacks On
Pre/Post Market & (Daily, Weekly,
Monthly, Yearly) Sessions With
Meticulous Columns, Rows, Tooltips,
Colors, Custom Ideas, and Alerts.
Sessions Use Two Step Incremental Values
Default Value: (1) Shows Two Previous
(O, H, L, C); Increasing Value Swaps
Sessions With Next Two Stacks.
⬛️ KEY WORDS:
🟢 Crossover | 🔴 Crossunder
📗 High | 📕 Low
📔 Open | 📓 Close
🥇 First Idea | 🥈 Second Idea
🥉 Third Idea | 🎖️ Fourth Idea
🟥 ALERTS:
Default Option: (Per Bar)
Alerts Once Conditions Are Met
(Bar Close) Alerts When Bar Closes
Default Option: (Reg)
Alerts During Regular Market
Trading Hours, (0930-1600)
(Ext) Alerts During Extended
Market Hours, (1600-0930)
(24/7) Alerts All Day
Optional Preferences:
Regular Alerts - Stocks
Extended Alerts - Futures
24/7 Alerts - Crypto
🟧 STACKS:
Default Value: (1)
Incremental Stack Value, Increasing Value
Swaps Sessions With the Next Two Stacks
(✓) Swap Stacks?
Pre/Post Market High/Lows,
1-2 Day High/Lows, 1-2 Week High/Lows,
1-2 Month High/Lows, 1-2 Year High/Lows
( ) Swap Stacks?
Pre/Post Market Open/Close,
1-2 Day Open/Close, 1-2 Week Open/Close,
1-2 Month Open/Close, 1-2 Year Open/Close
🟨 EXAMPLES:
Default Stack:
🟢 | 📗 Pre Market High (PRE) | 4600.00
🔴 | 📕 Post Market Low (POST) | 420.00
Optional: (Open)
🟢 | 📔 Post Market Open (POST) | 4400.00
Optional: (Close)
🔴 | 📓 Pre Market Close (PRE) | 430.00
Default Stack Value: (1)
🔴 | 📗 1 Day High (1DH) | 460.00
Next Stack Value: (3)
🟢 | 📕 4 Day Low (4DL) | 420.00
Optional: (Open)
🔴 | 📔 2 Day Open (2DO) | 440.00
Optional: (Close)
🟢 | 📓 3 Day Close (3DC) | 430.00
Default Stack Value: (5)
🟢 | 📗 5 Week High (5WH) | 460.00
Next Stack Value: (7)
🔴 | 📕 8 Week Low (8WL) | 420.00
Optional: (Open)
🔴 | 📔 7 Week Open (7WO) | 4400.00
Optional: (Close)
🟢 | 📓 6 Week Close (6WC) | 430.00
Default Stack Value: (9)
🔴 | 📗 9 Month High (9MH) | 460.00
Next Stack Value: (11)
🟢 | 📕 12 Month Low (12ML) | 420.00
Optional: (Open)
🟢 | 📔 11 Month Open (11MO) | 4400.00
Optional: (Close)
🔴 | 📓 10 Month Close (10MC) | 430.00
Default Stack Value: (13)
🟢 | 📗 13 Year High (13YH) | 460.00
Next Stack Value: (15)
🟢 | 📕 16 Year Low (16YL) | 420.00
Optional: (Open)
🔴 | 📔 15 Year Open (15YO) | 4400.00
Optional: (Close)
🔴 | 📓 14 Year Close (14YC) | 430.00
🟩 TABLES:
Default Value: (1)
Moves Table Up, Down, Left, or Right
Based on Second Default Value
First Default Value: (Top Right)
Sets Table Placement, Middle Center
Allows Table To Move In All Directions
Second Default Value: (Default)
Fixed Table Position, Switching Values
Moves Direction of the Table
🟦 IDEAS:
(✓) Show Ideas?
Shows Four Ideas With Custom Texts
and Values; Ideas Are Based Around
Post-It Note Reminders with Alerts
Suggestions For Text Ideas:
Take Profit, Stop Loss, Trim, Hold,
Long, Short, Bounce Spot, Retest,
Chop, Support, Resistance, Buy, Sell
🟪 EXAMPLES:
Default Value: (5)
Shows the Custom Table Value For
Sorted Table Positions and Alerts
Default Text: (🥇)
Shown On First Table Cell and
Message Appearing On Alerts
Alert Shows: 🟢 | 🥇 | 5.00
Default Value: (10)
Shows the Custom Table Value For
Sorted Table Positions and Alerts
Default Text: (🥈)
Shown On Second Table Cell and
Message Appearing On Alerts
Alert Shows: 🔴 | 🥈 | 10.00
Default Value: (50)
Shows the Custom Table Value For
Sorted Table Positions and Alerts
Default Text: (🥉)
Shown On Third Table Cell and
Message Appearing On Alerts
Alert Shows: 🟢 | 🥉 | 50.00
Default Value: (100)
Shows the Custom Table Value For
Sorted Table Positions and Alerts
Default Text: (🎖️)
Shown On Fourth Table Cell and
Message Appearing On Alerts
Alert Shows: 🔴 | 🎖️ | 100.00
⬛️ REFERENCES:
Pre-market Highs & Lows on regular
trading hours (RTH) chart
By Twingall
Previous Day Week Highs & Lows
By Sbtnc
Screener for 40+ instruments
By QuantNomad
Daily Weekly Monthly Yearly Opens
By Meliksah55

Ribbit RangesBounce Around Multiple
(Open, High, Low, Close) Ranges
On Pre/Post Market & (Daily, Weekly,
Monthly, Yearly) Sessions With
Meticulous Lines, Labels, Tooltips,
Colors, Custom Ideas, and Alerts.
Sessions Use Two Step Incremental Values
Default Value: (1) Shows Two Previous
(O, H, L, C); Increasing Value Swaps
Sessions With Next Two Ranges.
⬛️ KEY WORDS:
🟢 Crossover | 🔴 Crossunder
📗 High | 📕 Low
📔 Open | 📓 Close
🥇 First Idea | 🥈 Second Idea
🥉 Third Idea | 🎖️ Fourth Idea
🟥 ALERTS:
Default Option: (Per Bar)
Alerts Once Conditions Are Met
(Bar Close) Alerts When Bar Closes
Default Option: (Reg)
Alerts During Regular Market
Trading Hours, (0930-1600)
(Ext) Alerts During Extended
Market Hours, (1600-0930)
(24/7) Alerts All Day
Optional Preferences:
Regular Alerts - Stocks
Extended Alerts - Futures
24/7 Alerts - Crypto
🟧 RANGES:
Default Value: (1)
Incremental Range Value, Increasing Value
Swaps Sessions With the Next Two Ranges
(✓) Swap Ranges?
Pre/Post Market High/Lows,
1-2 Day High/Lows, 1-2 Week High/Lows,
1-2 Month High/Lows, 1-2 Year High/Lows
( ) Swap Ranges?
Pre/Post Market Open/Close,
1-2 Day Open/Close, 1-2 Week Open/Close,
1-2 Month Open/Close, 1-2 Year Open/Close
🟨 EXAMPLES:
Default Range:
🟢 | 📗 Pre Market High (PRE) | 4600.00
🔴 | 📕 Post Market Low (POST) | 420.00
Optional: (Open)
🟢 | 📔 Post Market Open (POST) | 4400.00
Optional: (Close)
🔴 | 📓 Pre Market Close (PRE) | 430.00
Default Range Value: (1)
🔴 | 📗 1 Day High (1DH) | 460.00
Next Range Value: (3)
🟢 | 📕 4 Day Low (4DL) | 420.00
Optional: (Open)
🔴 | 📔 2 Day Open (2DO) | 440.00
Optional: (Close)
🟢 | 📓 3 Day Close (3DC) | 430.00
Default Range Value: (5)
🟢 | 📗 5 Week High (5WH) | 460.00
Next Range Value: (7)
🔴 | 📕 8 Week Low (8WL) | 420.00
Optional: (Open)
🔴 | 📔 7 Week Open (7WO) | 4400.00
Optional: (Close)
🟢 | 📓 6 Week Close (6WC) | 430.00
Default Range Value: (9)
🔴 | 📗 9 Month High (9MH) | 460.00
Next Range Value: (11)
🟢 | 📕 12 Month Low (12ML) | 420.00
Optional: (Open)
🟢 | 📔 11 Month Open (11MO) | 4400.00
Optional: (Close)
🔴 | 📓 10 Month Close (10MC) | 430.00
Default Range Value: (13)
🟢 | 📗 13 Year High (13YH) | 460.00
Next Range Value: (15)
🟢 | 📕 16 Year Low (16YL) | 420.00
Optional: (Open)
🔴 | 📔 15 Year Open (15YO) | 4400.00
Optional: (Close)
🔴 | 📓 14 Year Close (14YC) | 430.00
🟩 COLORS:
(✓) Swap Colors?
Text Color Is Shown Using
Background Color
( ) Swap Colors?
Background Color Is Shown
Using Text Color
🟦 IDEAS:
(✓) Show Ideas?
Plots Four Ideas With Custom Lines
and Labels; Ideas Are Based Around
Post-It Note Reminders with Alerts
Suggestions For Text Ideas:
Take Profit, Stop Loss, Trim, Hold,
Long, Short, Bounce Spot, Retest,
Chop, Support, Resistance, Buy, Sell
🟪 EXAMPLES:
Default Value: (5)
Shows the Custom Value For
Lines, Labels, and Alerts
Default Text: (🥇)
Shown On First Label and
Message Appearing On Alerts
Alert Shows: 🟢 | 🥇 | 5.00
Default Value: (10)
Shows the Custom Value For
Lines, Labels, and Alerts
Default Text: (🥈)
Shown On Second Label and
Message Appearing On Alerts
Alert Shows: 🔴 | 🥈 | 10.00
Default Value: (50)
Shows the Custom Value For
Lines, Labels, and Alerts
Default Text: (🥉)
Shown On Third Label and
Message Appearing On Alerts
Alert Shows: 🟢 | 🥉 | 50.00
Default Value: (100)
Shows the Custom Value For
Lines, Labels, and Alerts
Default Text: (🎖️)
Shown On Fourth Label and
Message Appearing On Alerts
Alert Shows: 🔴 | 🎖️ | 100.00
⬛️ REFERENCES:
Pre-market Highs & Lows on regular
trading hours (RTH) chart
By Twingall
Previous Day Week Highs & Lows
By Sbtnc
Screener for 40+ instruments
By QuantNomad
Daily Weekly Monthly Yearly Opens
By Meliksah55

Market Internals (TICK, ADD, VOLD, TRIN, VIX)OVERVIEW
This script allows you to perform data transformations on Market Internals, across exchanges, and specify signal parameters, to more easily identify sentiment extremes.
Notable transformations include:
1. Cumulative session values
2. Directional bull-bear Ratios and Percent Differences
3. Data Normalization
4. Noise Reduction
This kind of data interaction is very useful for understanding the relationship between two mutually exclusive metrics, which is the essence of Market Internals: Up vs. Down. Even so, they are not possible with symbol expressions alone. And the kind of symbol expression needed to produce baseline data that can be reliably transformed is opaque to most traders, made worse by the fact that prerequisite symbol expressions themselves are not uniform across symbols. It's very nuanced, and if this last bit was confusing … exactly.
All this to say, rather than forcing that burden onto you, I've baked the baseline symbol expressions into the indicator so: 1) the transform functions consistently ingest the baseline data in the correct format and 2) you don't have to spend time trying to figure it all out. Trading is hard. There's no need to make it harder.
INPUTS
Indicator
Allows you to specify the base Market Internal and Exchange data to use. The list of Market Internals is simplified to their fundamental representation (TICK, ADD, VOLD, TRIN, VIX, ABVD, TKCD), and the list of Exchange data is limited to the most common (NYSE, NASDAQ, All US Stocks). There are also options for basic exchange combinations (Sum or Average of NYSE & NASDAQ).
Mode
Short for "Plot Mode", this is where you specify the bars style (Candles, Bars, Line, Circles, Columns) and the source value (used for single value plots and plot color changes).
Scale
This is the first and second data transformation grouped together. The default is to show the origin data as it might appear on a chart. You can then specify if each bar should retain it's unique value (Bar Value) or be added to a running total (Cumulative). You can also specify if you would like the data to remain unaltered (Raw) or converted to a directional ratio (Ratio) or a percentage (Percent Diff). These options determine the scale of the plot.
Both Ratio and Percent Diff. convert a given symbol into a positive or negative number, where positive numbers are bullish and negative numbers are bearish.
Ratio will divide Bull values by Bear values, then further divide -1 by the quotient if it is less than 1. For example, if "0.5" was the quotient, the Ratio would be "-2".
Percent Diff. subtracts Bear values from Bull values, then divides that difference by the sum of Bull and Bear values multiplied by 100. If a Bull value was "3" and Bear value was "7", the difference would be "-4", the sum would be "10", and the Percent Diff. would be "-40", as the difference is both bearish and 40% of total.
Ratio Norm. Threshold
This is the third data transformation . While quotients can be less than 1, directional ratios are never less than 1. This can lead to barcode-like artifacts as plots transition between positive and negative values, visually suggesting the change is much larger than it actually is. Normalizing the data can resolve this artifact, but undermines the utility of ratios. If, however, only some of the data is normalized, the artifact can be resolved without jeopardizing its contextual usefulness.
The utility of ratios is how quickly they communicate proportional differences. For example, if one side is twice as big as the other, "2" communicates this efficiently. This necessarily means the numerical value of ratios is worth preserving. Also, below a certain threshold, the utility of ratios is diminished. For example, an equal distribution being represented as 0, 1, 1:1, 50/50, etc. are all equally useful. Thus, there is a threshold, above which we want values to be exact, and below which the utility of linear visual continuity is more important. This setting accounts for that threshold.
When this setting is enabled, a ratio will be normalized to 0 when 1:1, scaled linearly toward the specified threshold when greater than 1:1, and then retain its exact value when the threshold is crossed. For example, with a threshold of "2", 1:1 = 0, 1.5:1 = 1, 2:1 = 2, 3:1 = 3, etc.
With all this in mind, most traders will want to set the ratios threshold at a level where accuracy becomes more important than visual continuity. If this level is unknown, "2" is a good baseline.
Reset cumulative total with each new session
Cumulative totals can be retained indefinitely or be reset each session. When enabled, each session has its own cumulative total. When disabled, the cumulative total is maintained indefinitely.
Show Signal Ranges
Because everything in this script is designed to make identifying sentiment extremes easier, an obvious inclusion would be to not only display ranges that are considered extreme for each Market Internal, but to also change the color of the plot when it is within, or beyond, that range. That is exactly what this setting does.
Override Max & Min
While the min-max signal levels have reasonable defaults for each symbol and transformation type, the Override Max and Override Min options allow you to … (wait for it) … override the max … and min … signal levels. This may be useful should you find a different level to be more suitable for your exact configuration.
Reduce Noise
This is the fourth data transformation . While the previous Ratio Norm. Threshold linearly stretches values between a threshold and 0, this setting will exponentially squash values closer to 0 if below the lower signal level.
The purpose of this is to compress data below the signal range, then amplify it as it approaches the signal level. If we are trying to identify extremes (the signal), minimizing values that are not extreme (the noise) can help us visually focus on what matters.
Always keep both signal zones visible
Some traders like to zoom in close to the bars. Others prefer to keep a wider focus. For those that like to zoom in, if both signals were always visible, the bar values can appear squashed and difficult to discern. For those that keep a wider focus, if both signals were not always visible, it's possible to lose context if a signal zone is vertically beyond the pane. This setting allows you to decide which scenario is best for you.
Plot Colors
These define the default color, within signal color, and beyond signal color for Bullish and Bearish directions.
Plot colors should be relative to zero
When enabled, the plot will inherit Bullish colors when above zero and Bearish colors when below zero. When disabled and Directional Colors are enabled (below), the plot will inherit the default Bullish color when rising, and the default Bearish color when falling. Otherwise, the plot will use the default Bullish color for all directions.
Directional colors
When the plot colors should be relative to zero (above), this changes the opacity of a bars color if moving toward zero, where "100" percent is the full value of the original color and "0" is transparent. When the plot colors are NOT relative to zero, the plot will inherit Bullish colors when rising and Bearish colors when falling.
Differentiate RTH from ETH
Market Internal data is typically only available during regular trading hours. When this setting is enabled, the background color of the indicator will change as a reminder that data is not available outside regular trading hours (RTH), if the chart is showing electronic trading hours (ETH).
Show zero line
Similar to always keeping signal zones visible (further up), some traders prefer zooming in while others prefer a wider context. This setting allows you to specify the visibility of the zero line to best suit your trading style.
Linear Regression
Polynomial regressions are great for capturing non-linear patterns in data. TradingView offers a "linear regression curve", which this script is using as a substitute. If you're unfamiliar with either term, think of this like a better moving average.
Symbol
While the Market Internal symbol will display in the status line of the indicator, the status line can be small and require more than a quick glance to read properly. Enabling this setting allows you to specify if / where / how the symbol should display on the indicator to make distinguishing between Market Internals more efficient.
Speaking of symbols, this indicator is designed for, and limited to, the following …
TICK - The TICK subtracts the total number of stocks making a downtick from the total number of stocks making an uptick.
ADD - The Advance Decline Difference subtracts the total number of stocks below yesterdays close from the total number of stocks above yesterdays close.
VOLD - The Volume Difference subtracts the total declining volume from the total advancing volume.
TRIN - The Arms Index (aka. Trading Index) divides the ratio of Advancing Stocks / Volume by the ratio of Declining Stocks / Volume. Given the inverse correlation of this index to market movement, when transforming it to a Ratio or Percent Diff., its values are inverted to preserve the bull-bear sentiment of the transformations.
VIX - The CBOE Volatility Index is derived from SPX index option prices, generating a 30-day forward projection of volatility. Given the inverse correlation of this index to market movement, when transforming it to a Ratio or Percent Diff., its values are inverted and normalized to the sessions first bar to preserve the bull-bear sentiment of the transformations. Note: If you do not have a Cboe CGIF subscription , VIX data will be delayed and plot unexpectedly.
ABVD - The Above VWAP Difference is an unofficial index measuring all stocks above VWAP as a percent difference. For the purposes of this indicator (and brevity), TradingViews PCTABOVEVWAP has has been shortened to simply be ABVD.
TKCD - The Tick Cumulative Difference is an unofficial index that subtracts the total number of market downticks from the total number of market upticks. Where "the TICK" (further up) is a measurement of stocks ticking up and down, TKCD is a measurement of the ticks themselves. For the purposes of this indicator (and brevity), TradingViews UPTKS and DNTKS symbols have been shorted to simply be TKCD.
INSPIRATION
I recently made an indicator automatically identifying / drawing daily percentage levels , based on 4 assumptions. One of these assumptions is about trend days. While trend days do not represent the majority of days, they can have big moves worth understanding, for both capitalization and risk mitigation.
To this end, I discovered:
• Article by Linda Bradford Raschke about Capturing Trend Days.
• Video of Garrett Drinon about Trend Day Trading.
• Videos of Ryan Trost about How To Use ADD and TICK.
• Article by Jason Ruchel about Overview of Key Market Internals.
• Including links to resources outside of TradingView violates the House Rules, but they're not hard to find, if interested.
These discoveries inspired me adopt the underlying symbols in my own trading. I also found myself wanting to make using them easier, the net result being this script.
While coding everything, I also discovered a few symbols I believe warrant serious consideration. Specifically the Percent Above VWAP symbols and the Up Ticks / Down Ticks symbols (referenced as ABVD and TKCD in this indicator, for brevity). I found transforming ABVD or TKCD into a Ratio or Percent Diff. to be an incredibly useful and worthy inclusion.
ABVD is a Market Breadth cousin to Brian Shannon's work, and TKCD is like the 3rd dimension of the TICKs geometry. Enjoy.

NSDT Average 6This is a pretty simple concept that we were asked to put together. It uses 6 Moving Averages, and takes the average of each one, then averages them all together.
If you don't want to use 6, and only 3 for example, then just enter the same length in two of the input fields as pairs.
Example:
For 6, you could use 10, 20, 30, 40, 50, 60
For 3, you could use 10, 10, 50, 50, 100, 100
It doesn't ploy 6 MA's, it only plots one - the result of the average of an average of an average, etc..
Publishing open source so other can modify as needed.
RSI Trend Detector PSAR BasedRSI Trend Detector is based on the Direction of PSAR. This indicator helps the easy detection of Trend Direction and Sideways Movement of Price. It was difficult to determine the RSI Trend Direction in a basic RSI indicator. one cannot decide the exact entry point where to enter.
RSI Trend Detector helps with the direction of trend using PSAR direction which is almost instant direction changing indicator with Zero Lag. The color of the RSI changes immediately based on PSAR direction. One can determine the trend whether its in UP / Down or Sideways.
One can easily detect Pullback and entry points using this indicator.
The basic working can be interpreted with a normal default RSI, The only additional feature is the direction of trend using a SAR signal.
Oversold Zone is below 30
Overbought Zone is above 70
how ever RSI above 50 is treated a UP trend and Below 50 as Down Trend.
when RSI is between 40 and 60 price must be considered as Sideways. One can easily interpret the TREND.
Yellow Line = RSI Moving Average
RED and Green Line= RSI
Grey Zone = Sideways
Horizontal line = RSI level 50
Settings can be changed as required.
RSI Line:
RSI Above 50 up trend and Entry when color is green
RSI Below 50 down trend and Entry when color is Red
RSI in Grey Zone is sideways, wait for a breakout
RSI above 50 and color is red then its a pullback in uptrend
RSI below 50 and color is green then its a pullback in downtrend
ALERTS:
Up signal and Down Signal are provided when ever RSI crosses RSIMA
Up Signal: RSI crosses RSI Moving Average upwards
Down Signal: RSI crosses RSI Moving Average Downwards
Hope the Tradingview community likes this.
