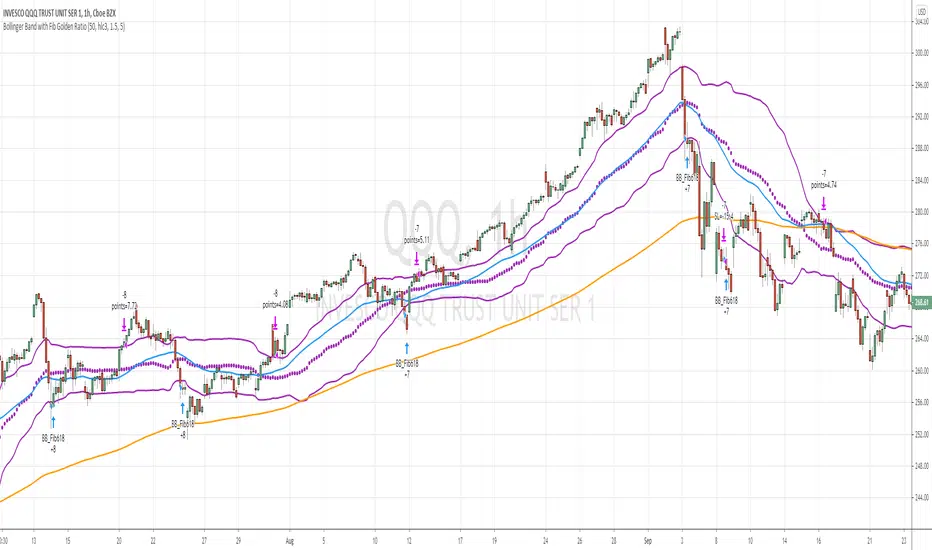
Bollinger Band with Fib Golden Ratio (0.618)This startegy uses Fib level (0.618) of Bollinger Band for long entry. I find this is the only strategy which gives similar results on the different time frames. I have tested QQQ for 1H, 2H , 3H and 4H charts , all showed over 70% winning rate.
BB settings 50 , mult 1.5 (or you can use 2.5 or 3 )
Note: for the basis I have used VWMA instead of SMA .
BUY
=========
ema 50 is above ema 200
when the price close or low touches BB50(Fib0.615) lower band
Exit
=========
when the price crossover BB50(Fib0.615) upper band
Stop Loss
=========
Stop oss set to 5% , configurable
Strategy works similar to mean reversion style. When it touches the lower bans (which 0.615 level of the BB50) , it bounces from there.
Warning
=========
This strategy is for educational purposes only. Please do your own reserach for trading decissions.
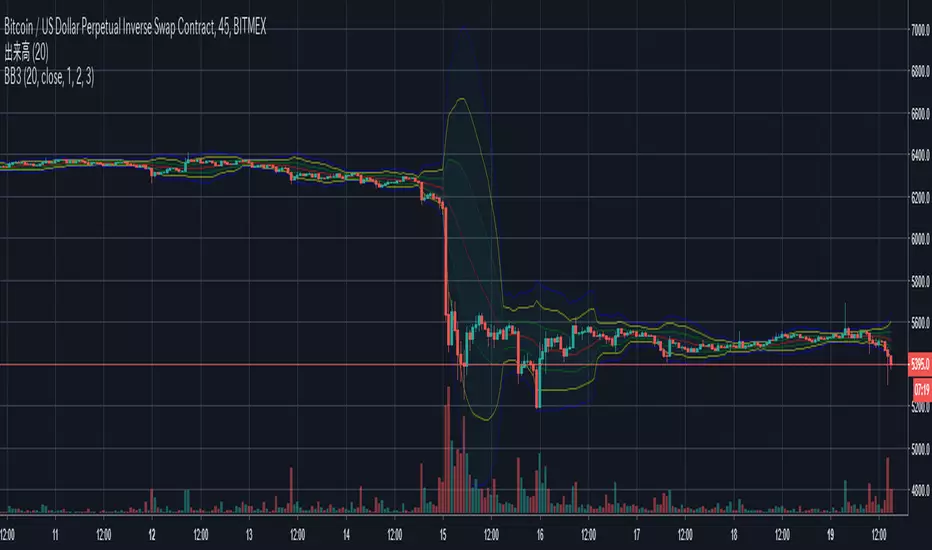
ابحث في النصوص البرمجية عن "弘历投教boll指标代码分析"

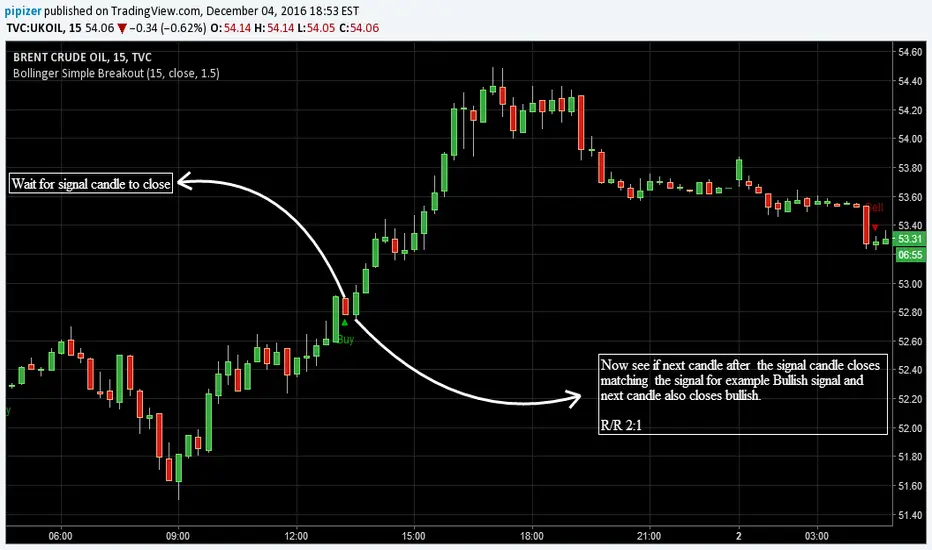
Bollinger Bands BreakoutThis indicator applies Bollinger Bands to a line* that represents the difference in closing prices to produce buy & sell signals.
*Equation of line = close - previous close
Enjoy, and hit the follow button to get easy access to my latest indicators!

Multi Bollinger BandsBollinger Bands across multiple configurable time frames (Default - 1H, 2H, 4H, 1D)
You can show / hide individual bands from the settings

Bollinger levelesSimilar to VRSI level script , only this time I use bolliger
plus add similar to a fib system to it
the cross up or down of high and low are optional if you want to see as L=low.h = high
so it a bollinger just it look different:)

Bollinger Breakout IndicatorA script to find breakouts/bullish movement in alt coins.This script builds up on the awesome bollinger indicator and analyzes the breakouts

Bollinger Bands T3/SMA/EMAModify the collor of the scandlestick to the trend using as core the Bollinger

Bollinger Bands Width Expansion IdentifierFind out if the Bollinger Band Width has rapidly expanded compared to the N number of previous periods.
I've written a function: 'bbw_expansion' that performs this check so that it can be incorporated in other projects of mine.
Example: bbw_expansion(bbw, 5, 1.2) will return 'true' if 'bbw' is 20% greater (or more) compared to the last 5 bbw periods.
The function returns: 'true' or 'false'

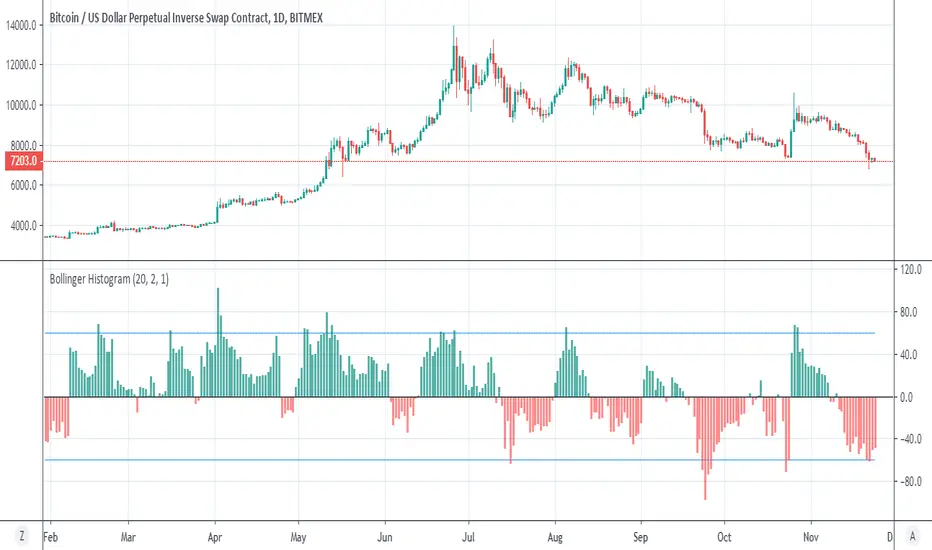
Bollinger HistogramIn the same way that I make the donchian histogram , we can make a histogram for bollinger
above zero =buy , green color
bellow zero =sell. red color
try to play with setting to get optimal results
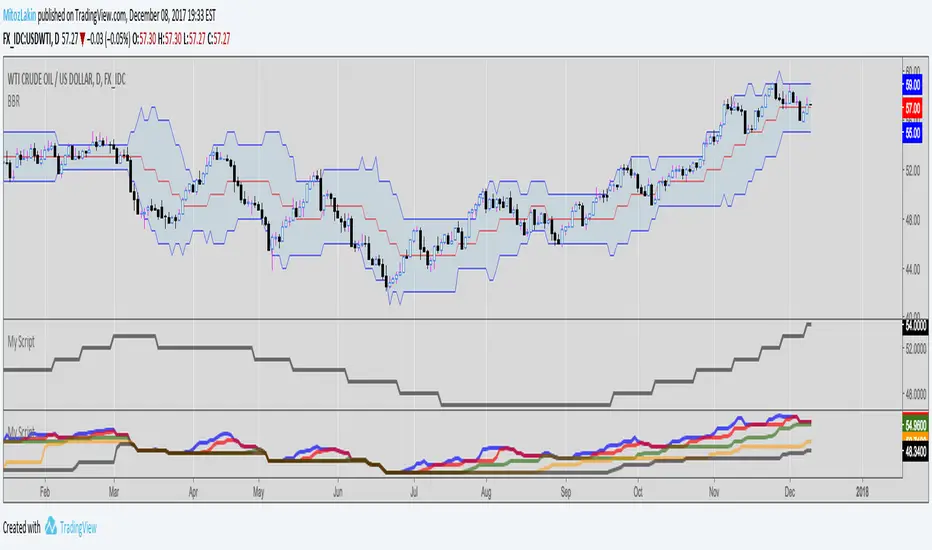
Bollinger MTFSo this is a Bollinger resistance and support map, I just convert it to v4 and add info for current upper and lower levels
The length is 60 (instead of regular 20) and we make it to be MTF
Ok , so how this system work
we choose TF and I normaly use 3x or 4X of the MTF (you can choose your own)
then we need to decide if we want to long or short
if we go long then the buy point will be the lower value and TP will be TP in green -
If we go short then our entry value will be upper and TP (take profit) will be in red
so one can put few tweeks and make this system to be more automatic , but I just show this as a easy concept for trade system
the main issue in such system is properly to decide when to go short or when to go long
that why you need to add other indicators in order to make this call and make this system effective

Bollinger BandwidthThe bandwidth is the difference (gap) between the upper band and the lower band.
This Bandwidth indicator takes the current Width of the Bollinger Bands and compares it to the Maximum and Minimum Width of the Bands over N periods
If the calculated percentage is less than or equal to X Percent (which we will specify), then the histogram shows yellow. If the calculated percentage is greater than the X Percent, then the histogram shows Red.
This works out well to quickly see if the currency pair is ranging (Yellow) and if it has broken out of range (Red)
To have a valid trade, the bandwidth indicator must be Yellow which means prices are contained within a tight range. This give us the opportunity to be able to trade inside the band picking top and bottom of the range with the help of the Stochastic indicator.


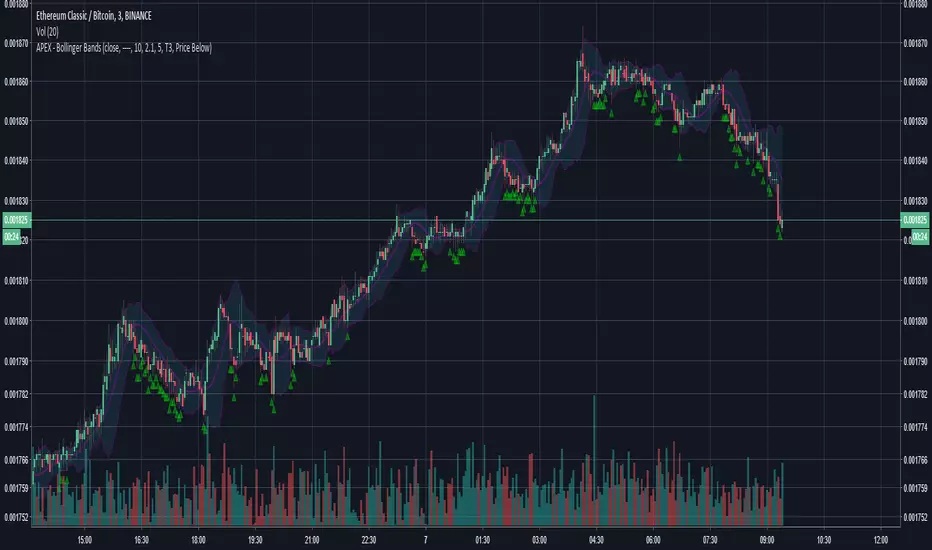
Noro's Bollinger Strategy v1.3Bollinger Bands
Pyramiding!!!
For:
- any crypto
- timeframe: 1min, 3min, 5min, 15min, 30min, 1h

Noro's Bollinger Strategy v1.2Bollinger Bands
Pyramiding!!!
For:
- any crypto
- timeframe: 1min, 3min, 5min, 15min, 30min, 1h

Noro's Bollinger Strategy v1.1Bollinger Bands
Pyramiding!!!
For:
- any crypto
- timeframe: 1min, 3min, 5min, 15min, 30min, 1h

Noro's Bollinger Strategy v1.0Bollinger Bands only
Piramiding!!!
For:
- any crypto
- timeframe: 1min, 3min, 5min, 15min, 30min, 1h, 2h

Bollinger Band with Touch Alerts and Disappear on Low TimeframesModified Bollinger Band with Touch Alerts and Disappear on Low Timeframes

Bollinger Bands PlusI wondered what Bollinger Bands would look like based on a Hull Moving Average compared to that of a Simple Moving Average.
This script allows you to turn on and off SMA and HMA based bands.
This is my way of learning Pine script, I hope it is of use to someone :-)