MACD frontSide backSide + TTM Squeeze by bangkokskaterDark Mode is enabled by default for black theme
disable Dark Mode for white theme
MACD frontSide backSide
===================
an elegant, much better way to use MACD
for trend following momentum ( aka momo) style
MACD with default settings of 12/26 smoothing of 9
✔️ but without histogram
✔️ only has MACD and signal "lines"
green = frontSide momentum impulse
take longs only
red = backSide momentum impulse
take shorts only
black area = exit (once green or red is no longer showing)
or keep holding till next bigger TP
PS: credits to Warrior Trading Ross Cameron for this idea
youtu.be
TTM Squeeze
===================
white dots = incoming pump / dump (monitor for entry)
PS: credits to John Carter's TTM Squeeze & Greeny for PineScript adaptation
ابحث في النصوص البرمجية عن "手机同花顺macd指标超出框架"
5 Minute Scalping StrategyTaking entrys based on the 1 minute timeframe MACD
only taking longs when all emas are in the correct order and there is a bigger than usual MACD downtick and the RSI is above 51
only taking shorts when all emas are in the opposite order and there is a bigger than usual uptick on the MACD and the RSI is bellow 49
bigger than usual ticks are defined by bollinger bands around the Macd and the ticks have to be higher than 35 and lower than -10
you can change whatever setting you like to make the strategy more profitible. pls share when you find a more profitible setting than me
the stoploss doesnt work correct if it would be hit in the same candle you enter the trade. pls share when you have a solution for this
the stratagy is profitible when i backtested it for the last month, but i dont know how it will play out in the future, so you enter the signals at your own risk

Moving Average Convergence Divergence with Rate of Change
Purpose - MACD is an awesome indicator. However, I felt I could improve the existing MACD indicator by also letting it visualize the rate of change (ROC) of the histogram (whether rate of change is increasing or decreasing - just like a derivative). By doing so, the indicator will better show the rate of change of the trend.
How It's Done - To the original MACD indicator, I have added a bit more conditional statements that automatically calculates the ROC in MACD histogram and visualizes through 8 different colors.
Interpretation - While the histogram is above 0, darker color indicates the stronger up trend, and lighter the color, weaker the up trend and potentially indicates the bears are overtaking, and vice versa for the case where the histogram is below 0.
Median Convergence DivergenceIntroduction
The Median Convergence Divergence (MCD) is a derivative of the Moving Average Convergence Divergence (MACD). The difference is the change in the use of the measure of central tendency. In MACD, moving average (mean) is used, whereas, in MCD, the median is used instead. The purpose of using the median is to eliminate the outlying values, which would be calculated for a moving average. The outliers would affect the value of the moving average.
For example: 3, 5, 7, 8, 5, 4, 2, 1, 6, 21, 8. The data set average is 6.3, whereas the median value is 5. There is a difference of about 23% in the example. The reason is the outlying value '21' in the data set.
As the markets are volatile, outlying values can always emerge. A moving average will consider those values; on the other hand, the median will ignore. If the strategy calls for a tool to ignore the outliers, the Median Convergence Divergence would be a great centered oscillator.
The default values have changed to suit the current trading days in a week. When the MACD was introduced, there would be six trading days in a week. Therefore, it used 12 (2 weeks), 26(4 weeks), and 9 ( 1.5 weeks). But now that there are five trading days per week. The default values are adapted to them. Feel free to change them as per your wish.
Recommended Settings
The current settings are set to be used for the Daily Time Frame: 5 day period for the fast line, a 20 day period for the slow line, and a 10 day period for the signal line. (5 days represent a trading week, 10 days is two weeks, and 20 days is 4 weeks or a month)
For the weekly charts, use 4 week period for the fast line, 13 week period for the slow line, and 8 week period for the signal line. (4 weeks represent a month, 8 weeks is two months, and 13 weeks is 3 months or quarterly)
And for monthly charts, use 3 month period for the fast line, 12 month period for the slow line, and 6 month period for the signal line. (3 months is quarterly, 6 months is bi-yearly, and 12 month is yearly)
It'll be challenging to measure for intraday since there are many different timeframes within intraday. The settings mentioned above should also be customized as per the requirements of the trading strategy.
Strategy
The strategy application is the same as the MACD, i.e., Signal Line Crossovers, Zero Line Crossovers, and Divergence.
Signal Line Crossovers: When the MCD line crosses above the Signal line, it's a bullish crossover. When the MCD line crosses below the Signal line, it's a bearish crossover.
Zero Line Crossovers: It's a bullish crossover when the MCD line crosses above the Zero line. When the MCD line crosses below the Zero Line, it's a bearish crossover.
Divergence: When price shows a lower low, but MCD shows a higher low, it's a bullish divergence. When the price shows a higher high but MCD shows a lower high, it's a bearish divergence.
Using other indicators in conjunction with the Median Convergence Divergence is recommended to take entry and exit signals.

MACD Trendprediction Strategy V1A trend following indicator based on the MACD and EMA. In this case, signals are not generated by crossing the signal lines as with the MACD, but as soon as the distance between the signal lines increases or decreases. A profit factor of 1.6-3.5 is achieved.
Ein Trendfolge-Indikator, auf der Basis des MACD und EMA. Dabei werden Signale nicht wie bei dem MACD per Kreuzung der Signallinien generiert, sondern sobald ein der Abstand der Signallinien zu oder abnimmt.

[fareid] Quick Backtest Framework█ OVERVIEW
This Framework allows Pine Coders to quickly code Study() based signal/strategy and validate its viability before proceed to code with more advance/complex customized rules for entry, exit, trailstop, risk management etc..
This is somewhat an upgraded version of my earlier personal template with different strategy used, cleaner code
and additional features.
█ USE CASES
- You have an idea for trade signal and need a quick way to verify its potential before writing lengthy/complicated code
- You found a study script for trading signal in public library and want to validate it profitability with minimum effort before including it in your trading playbook
█ FEATURES
- Alert: Ready to use alert function based on signals from your custom indicator.
- Visual Backtest: Auto-plot entry, stop-loss and take profit for simple strategy performance analysis
- Backtest Statistic: Provide basic key metrics based on backtest strategy
- BTE External Signal Protocol: Ready to use code that will supply required state to PineCoders Backtesting & Trading Engine if you wish to have more advance and sophisticated backtesting engine
Notes: All of the above features have On/Off toggle
█ Description & How To Use
This Framework consist of 5 Modules but you only need to edit the first 2 Modules:
Module1: Indicator
Module2: Framework Input Protocol
Module3: Alert
Module4: Backtest
Module5: Backtest & Trading Engine
Tips: The source-code includes collapsible block by module for easy navigating
Module1: Indicator:
-----------------------------------------------------------------------------------
Main Module. Place custom indicator input parameter/calculation/indicator plotting here
Sample Strategy: Double MACD Crossover
MACD Signal: 1st MACD Cross above signal line indicate Buy Signal
1st MACD Cross below signal line indicate Sell Signal
MACD Filter: 2nd MACD is above 0 line indicate Uptrend
2nd MACD is below 0 line indicate Downtrend
Module2: Framework Input Protocol:
-----------------------------------------------------------------------------------
Use this module to connect main indicator/signal calculated in Module1 to the rest of the framework's module
4 variables needed to be defined here:
1. Uptrend
2. Dntrend
3. BuySignal
4. SellSignal
i'm not sure how to place a code snippet here to show you example so in the source code i already put a comment in Module2 on which part u need to edit. I hope its pretty simple to use.
Module3: Alert Module Description:
-----------------------------------------------------------------------------------
As long as the variables in Module2 properly defined, the alert module is ready to use without any further modification.
Input:
Enable Alert --> Enable TV's alert and plot signal to chart
Alert Type --> Set to take Buy only, Sell only or Both alert
Module4: Backtest Module Description:
-----------------------------------------------------------------------------------
As long as the variables in Module2 properly defined, the backtest module is ready to use without any further modification.
Input:
Backtest Stat --> Enable Backtest Statistic Label
Backtest Visual --> Enable Backtest visual simulation
Backtest Type --> Set to take Buy only or Sell only or both
SL Type -->
ATR : Set SL in ATR times Multiplier below entry price
Fixed : Set SL in fixed point below entry point (in 'Dollar'). e.g. for Stocks -> 0.5 equals to 50cent while for EURUSD currency -> 0.005 equal to 50 pips
HiLo Bar: Set SL at highest/lowest wick of previous bar plus/minus Fixed point. e.g. EURUSD HiLo=3 and Fixed Point = 0.0005, buy trade will place SL 5 Pips below lowest of previous 3 bar
SL ATR Multi --> Set Lookback Period used for SL's ATR calculation
SL ATR Multi --> Set ATR Multiplier for SL
SL Fixed --> Set Fixed Level for SL
SL Bar --> Set Number of previous bar to check for SL placement
TP RR Ratio --> Set TP based on RR multiplier. e.g. 2 means TP level will be twice further from entry point compared to Entry-SL distance.
Notes: The point is for preliminary testing, so it only supports 1 trade at a time and no Trailing Stop
Module5: Backtest & Trading Engine Description:
-----------------------------------------------------------------------------------
As long as the variables in Module2 properly defined, the Pinecoders BTE module is ready to use without any further modification.
Input:
External Signal Protocol --> Set ESP State to send to "Backtesting & Trading Engine "
Signal With Filter --> Use this to send entry signal that already filtered by this study indicator (without stoploss level)
Signal Without Filter --> Use this to send raw entry signal that are NOT YET FILTERED by this study indicator (without stoploss level)
Signal and Stop With Filter --> Use this to send entry signal WITH StopLoss that already filtered by this study indicator (with stoploss level)
Signal and Stop Without Filter --> Use this to send raw entry signal WITH StopLoss that are NOT YET FILTERED by this study indicator (with stoploss level)
Notes: Backtesting & Trading Engine already have built-in Filter, Entries and Stop Level. e.g. Unselect all their filter state if only want to use custom filter and make sure send Signal with Filter (with or without SL level)
█ DISCLAIMER:
This framework main objective is to create my personal indicator template so that i just have to modify the indicator module for preliminary testing in future.
The sample strategy included are for educational purpose only. Use at your own risk
credit: LucF/PineCoders for a lot of his scripts that i use as a guide to complete this

DMA: Moving Average of OscillatorTechnical Indicator Moving Average of Oscillator (Moving Average of Oscillator OsMA) is the difference between the oscillator and oscillator smoothing. In this case, an oscillator is used the basic MACD line and the smoothing of the signal.
Calculate:
OSMA = MACD - SIGNAL
MACD = EMA(CLOSE, 12) - EMA(CLOSE, 26)
SIGNAL = EMA(MACD, 9)

Trend Checker by Hally - IndicatorIt is an indicator that overlaps MACD and Stochastics.
It has both characteristics.
The trend changes when two lines intersect.
I think the reaction is bad in the range market.
Also, when there are Stochastics and MACD lines above the indicator, it is possible to think whether it is overbought while riding the trend, and it may be helpful for making decisions such as "maybe it will reverse soon". Hmm.
Also, I think it is better to use it in combination with other indicators.
This is my first pine script, and I couldn't find it even if I searched for the script with overlapping indicators of different scales, so I tried making it by trial and error.
I hope it helps somebody trying to do the same.
MACDとStochasticsを重ね合わせたインジケーターです。
それぞれの特徴を併せ持っています。
2本のラインが交差する時トレンドが変化します。
レンジ相場では反応が悪いと思います。
また、インジケーターの上の位置にStochasticsとMACDラインがあるときはトレンドに乗りながらも買われすぎかどうか考えられることが出来ますし、「そろそろ反転するかも」などの判断の助けになるかもしれません。
また、他の指標との併用して使うほうが良いと思います。
pineスクリプトは初めてで、異なるスケールのインジケーターを重ね合わせていスクリプトは探しても見つからなかったので試行錯誤で作ってみました。
同じようなことをやろうとしてる誰かの参考になれば幸いです。

MACD + Stochastic + RSI (Long + Short)My strategy uses a combination of three indicators MACD Stochastic RSI .
The Idea is to GO LONG when ( MACD > Signal and RSI > 50 and Stochastic > 50) occures at the same time
and GO SHORT when ( MACD < Signal and RSI < 50 and Stochastic < 50)
This strategy works well on futures and stocks especially during market breaking up after consolidation
The best results are on Daily charts , so its NOT a scalping strategy. But it can work also on 1H charts.
The strategy does not have any stops and profit targets, so we can take all the market can give us at the moment.
The exit point only when MACD goes under/over Signal line
Its Preformance is quite stable.
So, use it, trade it.
If it will help you to imprive your trading results, please donate me
BTC: 12kd1F8buWisUBdq27BBwRkUvzW7Ey3og5

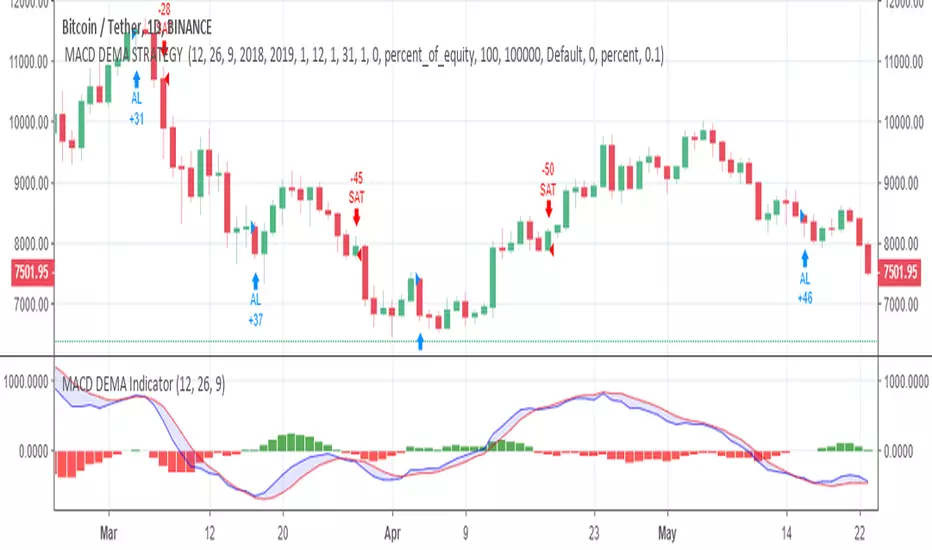
MACD DEMA STRATEGY A strategy based on ToFFF MACD DEMA indicator
Even so , ı dont recommended using MACD DEMA alone.
Combine its code with your favorite indicators.
You can visit ToFFF's indicator :
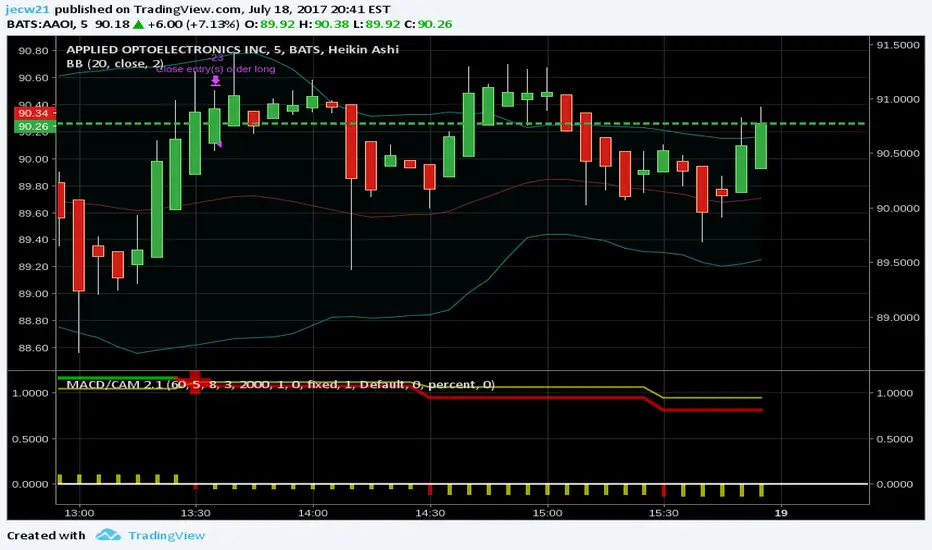
MACD/CAM 2.1
Added some modifications to Chris Moody's Macd indicator
Made fast length, slow length and signal length 5, 8, 3
Put initial capital of $2k
Buy at MACD/signal crossover
Sell at signal/MACD crossunder or when day low < previous day low
Open for feedback
Heiken Ashi zero lag EMA v1.1 by JustUncleLI originally wrote this script earlier this year for my own use. This released version is an updated version of my original idea based on more recent script ideas. As always with my Alert scripts please do not trade the CALL/PUT indicators blindly, always analyse each position carefully. Always test indicator in DEMO mode first to see if it profitable for your trading style.
DESCRIPTION:
This Alert indicator utilizes the Heiken Ashi with non lag EMA was a scalping and intraday trading system
that has been adapted also for trading with binary options high/low. There is also included
filtering on MACD direction and trend direction as indicated by two MA: smoothed MA(11) and EMA(89).
The the Heiken Ashi candles are great as price action trending indicator, they shows smooth strong
and clear price fluctuations.
Financial Markets: any.
Optimsed settings for 1 min, 5 min and 15 min Time Frame;
Expiry time for Binary options High/Low 3-6 candles.
Indicators used in calculations:
- Exponential moving average, period 89
- Smoothed moving average, period 11
- Non lag EMA, period 20
- MACD 2 colour (13,26,9)
Generate Alerts use the following Trading Rules
Heiken Ashi with non lag dot
Trade only in direction of the trend.
UP trend moving average 11 period is above Exponential moving average 89 period,
Doun trend moving average 11 period is below Exponential moving average 89 period,
CALL Arrow appears when:
Trend UP SMA11>EMA89 (optionally disabled),
Non lag MA blue dot and blue background.
Heike ashi green color.
MACD 2 Colour histogram green bars (optional disabled).
PUT Arrow appears when:
Trend UP SMA11


Adaptive Convergence Divergence### Adaptive Convergence Divergence (ACD)
By Gurjit Singh
The Adaptive Convergence Divergence (ACD) reimagines the classic MACD by replacing fixed moving averages with adaptive moving averages. Instead of a static smoothing factor, it dynamically adjusts sensitivity based on price momentum, relative strength, volatility, fractal roughness, or volume pressure. This makes the oscillator more responsive in trending markets while filtering noise in choppy ranges.
#### 📌 Key Features
1. Dual Adaptive Structure: The oscillator uses two adaptive moving averages to form its convergence-divergence line, with EMA/RMA as signal line:
* Primary Adaptive (MA): Fast line, reacts quickly to changes.
* Following Adaptive (FAMA): Slow line, with half-alpha smoothing for confirmation.
2. Adaptive MA Types
* ACMO: Adaptive CMO (momentum)
* ARSI: Adaptive RSI (relative strength)
* FRMA: Fractal Roughness (volatility + fractal dimension)
* VOLA: Volume adaptive (volume pressure)
3. PPO Option: Switch between classic MACD or Percentage Price Oscillator (PPO) style calculation.
4. Signal Smoothing: Choose between EMA or Wilder’s RMA.
5. Visuals: Colored oscillator, signal line, histogram with adaptive transparency.
6. Alerts: Bullish/Bearish crossovers built-in.
#### 🔑 How to Use
1. Add to chart: Works on any timeframe and asset.
2. Choose MA Type: Experiment with ACMO, ARSI, FRMA, or VOLA depending on market regime.
3. Crossovers:
* Bullish (🐂): Oscillator crosses above signal → potential long entry.
* Bearish (🐻): Oscillator crosses below signal → potential short entry.
4. Histogram: expansion = strengthening trend; contraction = weakening trend.
5. Divergences:
* Bullish (hidden strength): Price pushes lower, but ACD turns higher = potential upward reversal.
* Bearish (hidden weakness): Price pushes higher, but ACD turns lower = potential downward reversal.
6. Customize: Adjust lengths, smoothing type, and PPO/MACD mode to match your style.
7. Set Alerts:
* Enable Bullish or Bearish crossover alerts to catch momentum shifts in real time.
#### 💡 Tips
* PPO mode normalizes values across assets, useful for cross-asset analysis.
* Wilder’s smoothing is gentler than EMA, reducing whipsaws in sideways conditions.
* Adaptive smoothing helps reduce false divergence signals by filtering noise in choppy ranges.

MACD H4 on M15 ChartThis script displays the MACD from the H4 (4-hour) timeframe while viewing the chart in M15 (15-minute). It shows the H4 MACD line, signal line, and histogram for multi-timeframe (MTF) analysis. Use it to anticipate trend shifts on lower timeframes with confirmation from the higher timeframe MACD structure.

New Momentum H/LNew Momentum H/L shows when momentum, defined as the rate of price change over time, exceeds the highest or lowest values observed over a user-defined period. These events shows points where momentum reaches new extremes relative to that period, and the indicator plots a column to mark each occurrence.
Increase in momentum could indicate the start of a trend phase from a low volatile or balanced state. However in developed trends, extreme momentum could also mark potential climaxes which can lead to trend termination. This reflects the dual nature of the component.
This indicator is based on the MACD calculated as the difference between a 3-period and a 10-period simple moving average. New highs are indicated when this value exceeds all previous values within the lookback window; new lows when it drops below all previous values. The default lookback period is set to 40 bars, which corresponds with two months on a daily chart.
The indicator also computes a z-score of the MACD line over the past 100 bars. This standardization helps compare momentum across different periods and normalizes the values of current moves relative to recent history.
In practice, use the indicator to confirm presence of momentum at the start of a move from a balanced state (often following a volatility expansion), track how momentum develops inside of a trend structure and locate potential climactic events.
Momentum should in preference be interpreted from price movement. However, to measure and standardize provides structure and helps build more consistent models. This should be used in context of price structure and broader market conditions; as all other tools.

Express Generator StrategyExpress Generator Strategy
Pine Script™ v6
The Express Generator Strategy is an algorithmic trading system that harnesses confluence from multiple technical indicators to optimize trade entries and dynamic risk management. Developed in Pine Script v6, it is designed to operate within a user-defined backtesting period—ensuring that trades are executed only during chosen historical windows for targeted analysis.
How It Works:
- Entry Conditions:
The strategy relies on a dual confirmation approach:- A moving average crossover system where a fast (default 9-period SMA) crossing above or below a slower (default 21-period SMA) average signals a potential trend reversal.
- MACD confirmation; trades are only initiated when the MACD line crosses its signal line in the direction of the moving average signal.
- An RSI filter refines these signals by preventing entries when the market might be overextended—ensuring that long entries only occur when the RSI is below an overbought level (default 70) and short entries when above an oversold level (default 30).
- Risk Management & Dynamic Position Sizing:
The strategy takes a calculated approach to risk by enabling the adjustment of position sizes using:- A pre-defined percentage of equity risk per trade (default 1%, adjustable between 0.5% to 3%).
- A stop-loss set in pips (default 100 pips, with customizable ranges), which is then adjusted by market volatility measured through the ATR.
- Trailing stops (default 50 pips) to help protect profits as the market moves favorably.
This combination of volatility-adjusted risk and equity-based position sizing aims to harmonize trade exposure with prevailing market conditions.
- Backtest Period Flexibility:
Users can define the start and end dates for backtesting (e.g., January 1, 2020 to December 31, 2025). This ensures that the strategy only opens trades within the intended analysis window. Moreover, if the strategy is still holding a position outside this period, it automatically closes all trades to prevent unwanted exposure.
- Visual Insights:
For clarity, the strategy plots the fast (blue) and slow (red) moving averages directly on the chart, allowing for visual confirmation of crossovers and trend shifts.
By integrating multiple technical indicators with robust risk management and adaptable position sizing, the Express Generator Strategy provides a comprehensive framework for capturing trending moves while prudently managing downside risk. It’s ideally suited for traders looking to combine systematic entries with a disciplined and dynamic risk approach.

Momentum-Based Buy/Sell SignalsBuy Signal:
Triggered when ROC > threshold and the MACD line crosses above the Signal line.
Sell Signal:
Triggered when ROC < threshold and the MACD line crosses below the Signal line.
Visual Elements:
Green labels with "Buy" are displayed below the bars for buy signals.
Red labels with "Sell" are displayed above the bars for sell signals.
The background turns green during a buy signal and red during a sell signal for better visual clarity.

Chande Momentum Oscillator (CMO) Buy Sell Strategy [TradeDots]The "Chande Momentum Oscillator (CMO) Buy Sell Strategy" leverages the CMO indicator to identify short-term buy and sell opportunities.
HOW DOES IT WORK
The standard CMO indicator measures the difference between recent gains and losses, divided by the total price movement over the same period. However, this version of the CMO has some limitations.
The primary disadvantage of the original CMO is its responsiveness to short-term volatility, making the signals less smooth and more erratic, especially in fluctuating markets. This instability can lead to misleading buy or sell signals.
To address this, we integrated the concept from the Moving Average Convergence Divergence (MACD) indicator. By applying a 9-period exponential moving average (EMA) to the CMO line, we obtained a smoothed signal line. This line acts as a filter, identifying confirmed overbought or oversold states, thereby reducing the number of false signals.
Similar to the MACD histogram, we generate columns representing the difference between the CMO and its signal line, reflecting market momentum. We use this momentum indicator as a criterion for entry and exit points. Trades are executed when there's a convergence of CMO and signal lines during an oversold state, and they are closed when the CMO line diverges from the signal line, indicating increased selling pressure.
APPLICATION
Since the 9-period EMA smooths the CMO line, it's less susceptible to extreme price fluctuations. However, this smoothing also makes it more challenging to breach the original +50 and -50 benchmarks.
To increase trading opportunities, we've tightened the boundary ranges. Users can customize the target benchmark lines in the settings to adjust for the volatility of the underlying asset.
The 'cool down period' is essentially the number of bars that await before the next signal generation. This feature is employed to dodge the occurrence of multiple signals in a short period.
DEFAULT SETUP
Commission: 0.01%
Initial Capital: $10,000
Equity per Trade: 80%
Signal Cool Down Period: 5
RISK DISCLAIMER
Trading entails substantial risk, and most day traders incur losses. All content, tools, scripts, articles, and education provided by TradeDots serve purely informational and educational purposes. Past performances are not definitive predictors of future results.

OneThingToRuleThemAll [v1.4]This script was created because I wanted to be able to display a contextual chart of commonly used indicators for scalping and swing traders, with the ability to control the visual representation on the charts as their cross-overs, cross-unders, or changes of state happen in real time. Additionally, I wanted the ability to control how or when they are displayed. While looking through other community projects, I found they lacked the ability to full customize the output controls and values used for these indicators.
The script leverages standard RSI/MACD/VWAP/MVWAP/EMA calculations to help a trader visually make more informed decisions on entering or exiting a trade, depending on their understanding on what the indicators represent. Paired with a table directly on the chart, it allows a trader to quickly reference values to make more informed decisions without having to look away from the price action or look through multiple indicator outputs.
The main functionality of the indicator is controlled within the settings directly on the chart. There a user can enable the visual representations, or disable, and configure how they are displayed on the charts by altering their values or style types.
Users have the ability to enable/disable visual representations of:
The indicator chart
RSI Cross-over and RSI Reversals
MACD Uptrends and Downtrends
VWAP Cross-overs and Cross-unders
VWAP Line
MVWAP Cross-overs and Cross-unders
MVWAP Line
EMA Cross-overs and Cross-unders
EMA Line
Some traders like to use these visual indications as thresholds to enter or exit trades. Its best to find out which ones work the best with the security you are trying to trade. Personally, I use the table as a reference in conjunction with the RSI chart indicators to help me decide a logical trailing stop if I am scalping. Some users might like the track EMA200 crossovers, and have visual representations on the chart for when that happens. However, users may use the other indicators in other methods, and this script provides the ability to be able to configure those both visually and by value.
The pine script code is open source and itself is fairly straightforward, it is mostly written to provide the ultimate level of control the the user of the various indicators. Please reach out to me directly if you would like a further understanding of the code and an explanation on anything that may be unclear.
Enjoy :)
-dead1.

MACD HIstgramMA signl CrossingThis indicator highlights points where the MACD's Signal and Simple Moving Average of Histogram cross as entry points.
By incorporating the Simple Moving Average of the Histogram, it aims to avoid false entries during MACD and Signal crosses when volatility is low.
However, since it employs the Simple Moving Average of the Histogram, the appearance of entry points is less frequent and lagging compared to the cross of MACD and Signal.
Divergence for Many [Dimkud - v5]Strategy is based on "Divergence for Many Indicators v4 ST" strategy by CannyTolany01
which is based on "Divergence for Many Indicator" indicator by LonesomeTheBlue
This strategy is searching for divergences on 18 indicators which you can select and optimise one by one.
Additionally you can connect any other External Indicator value. (just add this indicator the the chart and select option in settings)
To the original indicator/strategy I have added 9 additional indicators:
( Money Flow Index, Williams_Vix, Stochastic RSI , SMI Ergodic Oscillator, Volume Weighted MACD , Bull Bear Power, Balance of Power , Relative Volatility Index , Logistic Settings).
Converted strategy to v5 of Pine Script.
Added Static SL/TP in percents (%).
Added filters to filter enters:
1. Volume Weighted MACD - Multi-TimeFrame Filter
(It checks for histogram to falling or rising for a set periods of bars)
2. Money Flow Index - Multi-TimeFrame Filter
(It checks if MFI Oscillator is in the set diapason.
Also It checks if MFI is falling or rising for a set periods of bars )
3. ATR filter
(check changes in fast ATR to slow ATR )
Strategy shows good backtest results on many crypto tokens on 45m - 1h periods. (with parameters optimisation for every indicator)
To find best parameters - you can enable indicators one-by one, and optimise best parameters for each of them.
Then enable all indicators with successful results.
Optimise SL/TP.
Then try to enable and optimise filters (channels etc.)
The better is to optimise parameters separately for Short and Long trading. And run two separate bots (in settings enable only Long or only Short.)
Updates:
- Added visualisation for open trades (SL/TP)
- Added Volatility filter by ATR with many options for tests.
- Fixed some small bugs.
- Added second RSI filter (you can use two RSIs with different TF or settings)
- Updated ATR volatility and MFI filter. Removed non-effective options
- Added CCI filter
- Added option to Enable/Disable visualisation of TP/SL on chart
- Fixed one small quick bug. ("ATR filter short" was not working)
- Added Super Trend filter
- Added Momentum filter
- Added Volume Filter
- All "request.security" MultiTimeFrame calls changed to 100% non-repait function "f_security()"

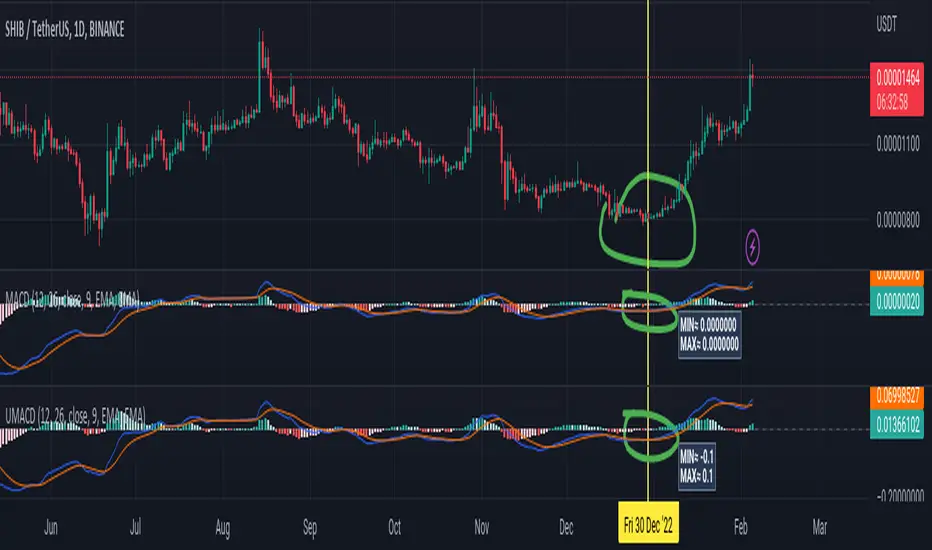
Universal Moving Average Convergence DivergenceI changed MACD formula to divergence of (MA26/MA12 - 1).
And its make it more useful.
Cuz:
1) comparability with all other coins with different prices.
2) fix small numbers in low price coines like shiba
3) making a good indicator like RSI to use it for optimization and ML/AI projects as a variable
Most important thing about this indicator is that its Universal
Now you can compare the UMACD of Shiba with Bitcoin without any problem in matamatics space.No need to use virtuality and its important in Optimization problems that we rediuse the problem from a picture to a number(A plot to a list of numbers)
If we don't care about exagrated pumps and dumps, we can say to it Normalized-MACD too. Cuz in normal situations its MAX ≈ 0.1 and MIN ≈ -0.1